Color-Magnitude Diagrams of Resolved Stars in Virgo Cluster Dwarf Galaxies
Abstract
The Advanced Camera for Surveys (ACS) on HST has been used to image two fields in the core of the Virgo cluster that contain a number of dwarf elliptical galaxies. The combined F555W and F814W images have resolved red giant stars in these galaxies, down to 1 mag below the giant branch tip. Two of the galaxies were targeted because of their extremely low central surface brightnesses (), thus the successful resolution into stars confirms the existence of such tenuous galaxies. Red giant stars were also found that are not ostensibly associated with any galaxy. Color-magnitude diagrams in V and I have been derived for the five dwarfs, as well as the halo of a nearby spiral galaxy and the intracluster stars in the two fields. These diagrams were used to derive distances and metallicities via the magnitude of the red giant branch tip, and the mean color of the giant branch. The mean abundances of stars in the dwarfs range from , and fall along the relation between galaxy luminosity and metallicity found for Local Group and M81 group dwarf ellipticals. [Fe/H] does not appear to be well-correlated with galaxy surface brightness, as the two extremely low surface brightness galaxies do not have extreme abundances. The mean distance modulus of the six Virgo galaxies is , or Mpc, whereas that for the intracluster stars in those fields is ( Mpc).
Subject headings:
1. Introduction
Dwarf galaxies in nearby clusters, particularly the dominant non-star forming galaxies, have been the subject of numerous studies, with the topics ranging from morphology, distribution and kinematics within the clusters, stellar populations, internal kinematics, and globular cluster content (Binggeli et al., 1987; Trentham & Hodgkin, 2002; Conselice et al., 2003; Geha et al., 2003; Mobasher et al., 2003; Sharina et al., 2005). Such work on the Local Group dwarf ellipticals and spheroidals (dE and dSph) of course began much earlier and is now comprehensive. Moreover, these galaxies are near enough that properties of individual stars can be studied extensively as well. Resolved star analyses have recently begun on the dwarf galaxy populations outside the Local Group in nearby groups such as the M81, Sculptor, and Cen A groups (Da Costa, 2004; Jerjen & Rejkuba, 2001; Karachentsev et al., 2001, 2002, 2003; Rejkuba et al., 2006; Caldwell et al., 1998). The next step would seem to be to resolve stars in the vast population of dwarfs found in the large clusters such as Virgo, Fornax and Coma, thus allowing detailed analyses of dwarf galaxy populations similar to the studies of the nearby dwarfs. Harris et al. (1998) used WFPC2 on HST to study one bright Virgo dE. This paper presents an attempt using the Advanced Camera for Surveys (ACS).
A CCD imaging study of several selected areas in the Virgo cluster has been conducted by Caldwell et al. (2006), using the KPNO 4m telescope and the Mosaic CCD camera with B and R filters. The long exposures used allowed the detection depth in magnitude of dwarf ellipticals to be pushed about 1 mag fainter than previously done photographically (Binggeli et al., 1987), and also 1 mag fainter in surface brightness than other recent CCD surveys (e.g., Trentham & Hodgkin (2002)). Using visual and automatic techniques, a new catalog of dwarfs was made, containing many which have physical parameters placing them in the category of the fainter Local Group dSph galaxies, and some of which are unknown in the Local Group, in the sense that their surface brightnesses are lower than the nearby dwarfs. Moreover, such galaxies are large in radius, and hence their luminosities are actually brighter than the faintest dSph in the Local Group.
A question remains however, of the reality of the extremely low surface brightness galaxies. It is curious that such galaxies can exist in the center of the Virgo cluster, where galaxy interactions and tides might have a destructive effect, depending on the orbits the dwarfs follow within the cluster. On ground based images, a tight, distant group of galaxies can often appear similar to a low surface brightness galaxy at 15 Mpc. Imaging with HST would obviously settle the matter, and perhaps provide a bonus of giving an accurate distance to the galaxies via the magnitudes of the red giant branch stars (RGB), if they can be resolved. A color-magnitude diagram (cmd) would further allow an estimate of the giant branch color, which is determined by metal-abundance. The abundance for an extremely low surface brightness galaxy in turn can be compared with similarly determined abundances for dE and dSph galaxies in the Local Group and other nearby groups. A well-defined relation between the luminosity and the mean abundance has been established for dE and dSph galaxies. Does this also hold true for the extreme surface brightness galaxies, which reside in the densest regions of the Virgo cluster?
2. Observations
The advent of ACS on HST offers another magnitude of depth from the work done with WFPC2 resolving stars and forming color-magnitude diagrams for old populations in galaxies of the Local Group, the M81 group other nearby environs (e.g.,Da Costa et al. (1996) ). With moderate exposure times on WFPC2, depths of I=26 mag were achieved. Virgo cluster galaxies are thought not to be closer than about 15 Mpc, thus typical red giant tip stars with absolute magnitude of M could appear at apparent I=26.9, plus an extinction of around 0.05 mag. Using WFPC2 exposures totaling 32.2 ksec, Harris et al. (1998) detected stars down to I 28 in IC3338, a relatively bright Virgo dE. Therefore, it seemed likely that ACS could resolve red giant stars in Virgo early type galaxies, with fairly long exposure times. A further item to consider is that at 15 Mpc, the surface number density of stars would lead to confusion for normal high surface brightness galaxies, except in the outermost parts. The extremely low surface brightness galaxies identified in the CCD survey then provide an excellent target for a project to resolve Virgo red giant stars.
2.1. Selection of Targets
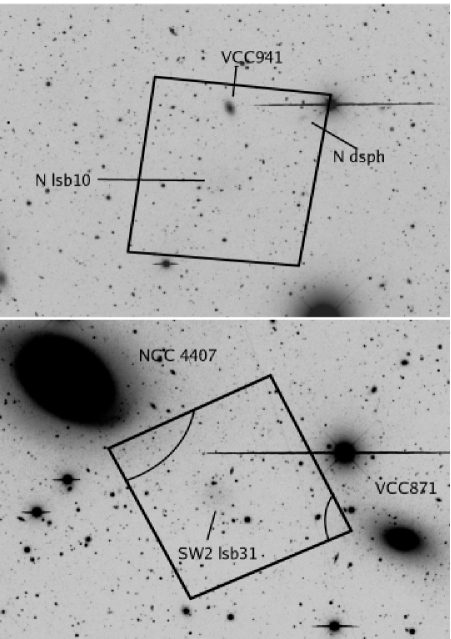
From the more than one hundred low surface brightness Virgo dwarfs newly cataloged in Caldwell et al. (2006), two were selected for ACS imaging, lying in the fields designated “N” and “SW2”. The dwarf galaxy SW2 lsb31 was chosen because its surface brightness is low enough so that it was missed in the Binggeli et al. (1985) photographic survey, yet not so low that its existence was in doubt. That dwarf lies between two larger galaxies, one an SB spiral (NGC4407) and the other a much brighter, nucleated dE (VCC871). While the centers of those two do not fall on the small ACS field, their extended stellar halos do show up in the images. N lsb10 is one of the most extreme cases found in the CCD survey, with a central B surface brightness of about 27.3 mag arcsec-2. It is also large, with a limiting radius (at 30 mag arcsec-2) of 30˝, or 2 kpc if it is indeed in the Virgo cluster. The question remained however of its true nature - while the object was definitely real, showing up on multiple exposures and in both colors, the possibility that it was a background object, as mentioned above, remained. This field also contained two other objects: a low luminosity, but higher surface brightness dE, cataloged in Binggeli et al. (1985) (VCC941), and a small galaxy that was not identified by eye in the CCD survey as a dE member, because its appearance in the ground based images is too similar to distant background galaxies. And while it was cataloged in the automatic survey as a possible dE, its appearance on the ACS images as a resolved dSph galaxy in the Virgo cluster with a total luminosity of V=-9.6 was entirely due to good fortune. As an indication of the range of structures in dwarf ellipticals, Table 1 contains the effective radii of the galaxies (). Note that while N lsb10 is nearly a magnitude fainter than VCC941, the former is five times larger in effective radius. Table 1 also lists the total R magnitude, B–R color, and central B surface brightness derived from the CCD images.
In terms of location within the cluster, the two fields are both close to the center defined by M87. The “N” field is 1.4° north (or 360 kpc for a distance of 15 Mpc), and the “SW2” field is 1.1° west (or 290 kpc distant). Both are well within the average core radius of the Virgo galaxy distribution (Binggeli et al., 1987).
2.2. ACS Exposures
F555W was selected for the V band exposures, primarily because of our use of that filter in the M81 study, and its small color term when transforming to standard V magnitude system. However, it proved to have substantially lower throughput than the wider and somewhat redder F606W filter, and the results of the photometry below leave no doubt that the latter filter would be have been a better choice for this study. However, the V-I colors provided by the F555W images, along with those in F814W do allow significant conclusions to be drawn for the brighter member stars.
Each target was exposed on the WFC for a total of 33,280s in F555W, and 14,400s in F814W, using 19 orbits per target. The exposure details are in Table 1. A small dither consisting of two pointings was used between successive exposures. This allowed bad pixels to be eliminated in the image combination, but did not fill in the gap between the two ACS CCDs, nor did it allow subpixel sampling. The galaxies are large enough so that the loss of sky coverage in the gap is not important.
2.3. Image Combination
The images were taken in the first few months of operation for the ACS camera, but image combination software was not optimum for some time, and various unsuccessful reduction attempts were made following the observations. Eventually, the multidrizzle package (Koekemoer et al., 2002) which is now a standard part of the ACS data reduction became available, and was used to combine the individual exposures. The package rebins the data from the native trapezoidal, and spatially variable pixels to square, equal-sized pixels, and as part of the combination process can detect and eliminate cosmic rays. A spatially variable PSF remains, which the model psf used in the photometry below takes into account. The long exposures involved here, particularly for the F555W images, meant that large numbers of cosmic rays hits were recorded on the images. These were effectively removed in the combination process.
Possibly because there were only two pointings, there was a fair amount of pattern noise left in the F555W images. This caused some problems with the automatic star detection algorithms, which would find false-positives at higher levels than expected. As well, in one combined F814W image, there was a small gradient in the background noise level, which similarly caused more false-positive stars to be found in the higher noise areas. These problems were dealt with by increasing the cutoff signal-to-noise slightly, and are of course also taken into account by the artificial star tests discussed below.
The charge-transfer efficiency of the ACS CCDs is reported to decline with time (Reiss and Mack,, 2004). The exposures reported here were taken early in the life of the camera, and thus there is no correction to be applied for that problem.
2.4. General Characteristics of the Images: Red Giant Stars Resolved in Virgo
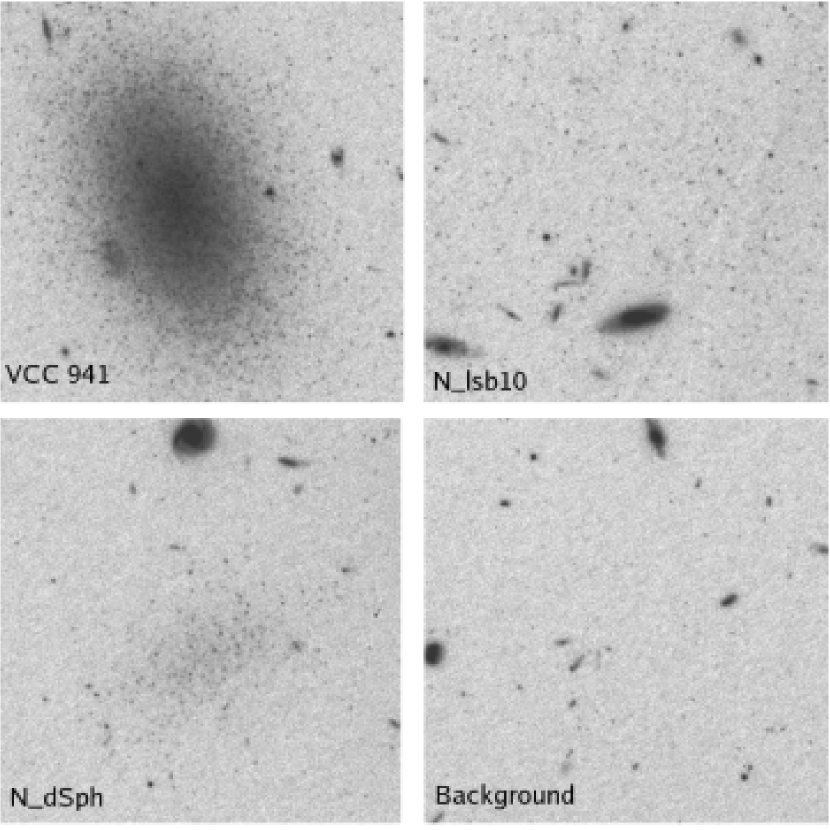
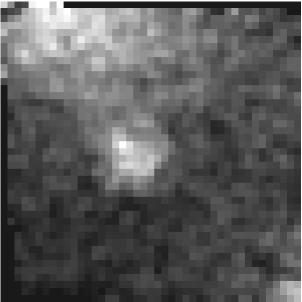
Figure 1 shows the ACS footprint on KPNO 4m R band images. As mentioned above, the outer halos of two galaxies, NGC4407 and VCC871 are within the ACS footprint for the SW2 field. Figures 2 and 3 show expanded portions of the F814W ACS images of each of the 6 individual galaxies in the two fields. We now discuss these in general terms. The image of VCC941 will certainly come across best in the reproduction here, and demonstrates dramatically that the images do indeed resolve the red giant stars in this Virgo cluster galaxy. Showing no strong nucleation, VCC941 appears in this image as well-resolved as is the Local Group galaxy Leo I, seen from the ground. A possible globular cluster is seen directly west of the center. Anticipating the photometric calibrations presented below, this object has M, and (V–I)0= 1.0, values consistent with a globular cluster. The diffuse component to the SE of the center of VCC941 is probably a background object.
One of the principle targets, N lsb10, has a central intensity 4.5 magnitudes fainter than VCC941, so it is not surprising that the figure requires more scrutiny to find its resolved stars. As a visual confirmation of the increased star density here, an area near the edge of the ACS frame is also shown. Stars in this galaxy in fact extend well beyond the 22.5˝ diameter of the figure, going out to a radius of 40˝. The automatic star finding work discussed below resulted in the detection of nearly as many stars in N lsb10 as in VCC941.
The third galaxy in the N field was fortuitous, as mentioned already. It does appear on the 4m CCD images, and was cataloged automatically, from which we derive its magnitude of R=21.3. It also clearly resolves into stars, and combined with N lsb10 reveals the large range of structures and densities apparent in dwarf ellipticals.
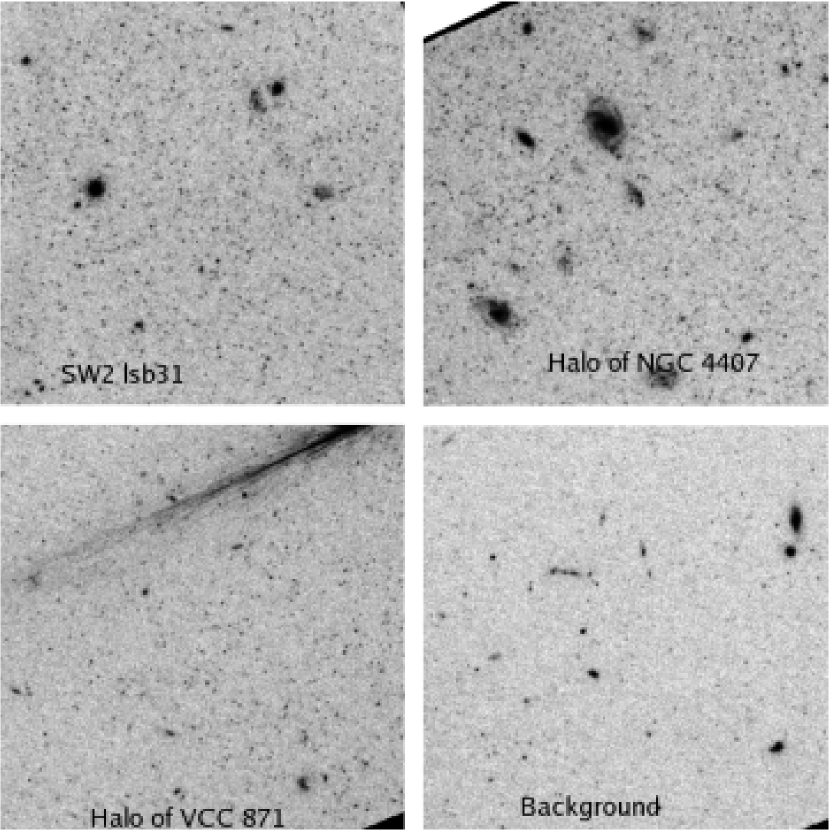
Moving to the SW2 field, the target galaxy SW2 lsb31 also has an extremely low central surface brightness, yet stars are clearly resolved here. Stars in the halo of the spiral galaxy NGC 4407 are quite dense in one corner of the frame, where the distance to the center of the galaxy is 120˝, or 8.7 kpc in projection. The stars extend well towards the center. There is some overlap with SW2 lsb31, thus a local background subtraction will be necessary. In the other corner are found stars from the dE VCC871, 70˝ from its center, or 5 kpc in projection. It’s interesting to note that the velocity of NGC4407 is 102 km s-1 , while that of VCC871 is 1427. Clearly these two are not associated, so a determination of their distances would be valuable in understanding a kinematic detail of the Virgo cluster. Finally, the density of stars throughout this image which are not apparently associated with any of those three galaxies is three times higher than is found in the N field. Whether these are intracluster stars or rather stars tenuously affiliated with the three galaxies may be addressed by comparing all of the color-magnitude diagrams, as done below.
While the F555W images are not nearly as abundant in resolved stars, due to the colors of the red giant stars, there are sufficient numbers present to allow colors to be measured for the brighter giants.
In summary, the objective to resolve red giant stars in Virgo cluster dwarf galaxies was achieved, and we now describe the quantitative measurement of the individual stars, and the cmds which were formed that allowed distances, and stellar population characteristics to be estimated.
2.5. PSF Fitting Photometry
Stellar photometry was obtained using the DAOPHOT package of Stetson (1987), modeling the spatially variable PSFs for each of the 4 combined images separately, using only stars on those images. Multidrizzle supplies an image that has been background subtracted and scaled to a 1s exposure time, so the first step was to rescale by the exposure time of a single exposure, and add back in the average background level for each set of co-averaged exposures.
PSFs were constructed using 15-20 bright stars which had no pixels above a level of 20,000 counts, the point at which an ostensible non-linearity set in and the PSF no longer matched those of fainter stars. The PSF model had a quadratic dependence on location. Given the 0.05˝ pixels and the resultant under-resolution of point sources, the PSFs created do not perform as well for the ACS data as do PSFs for better-resolved data, but such errors should be taken care of in the aperture correction step. The PSF was defined over 25 pixels (there is a large halo in the F814W PSF, due to scattering, see Sirianni et al. (2005)), but was fit within a radius of 2 pixels. It was normalized to aperture photometry within 10 pixels (0.5˝). Aperture corrections were also measured using these stars, to determine any photometric offset between the psf photometry and the aperture magnitude within 0.5 ˝. Sirianni et al. (2005) have provided aperture corrections from that aperture size to infinity, in all ACS filters.
The DAOPHOT automatic star detection algorithm was used to collect star centers for the PSF photometry. Since we attempted to measure stars at the detection limit, any such method will be sensitive to the noise characteristics. After some testing, a threshold of 3.3 sigma was used for detection of stars in the F814W images. This avoided creating too many false-positives over areas of the detector which had higher noise than average, but still cataloged nearly all the stars in the target galaxies, as determined visually. Since the F555W images are not as deep, and have a remnant pattern noise, the star catalogs from the F814W frames were used as input for the F555W work, rather than creating a separate F555W catalog and matching stars at a later step. This technique meant that there are stars with valid photometry that are significantly detected in the F814W data, but which are well below the F555W limit. For those stars, we have in effect measured the I band magnitude, but only a blue limit on its V–I color. The uncertainties for the photometry as well as the artificial star tests were then used to guide the analysis so that such stars are treated properly in the color-magnitude diagrams.
Generally, two passes of photometry were run. First, a star list was made and entered into ALLSTAR, which aside of the photometry, produces a star-subtracted image. Stars missed in the first round were located in the subtracted image and added to the original list. The original frame was then measured again by ALLSTAR.
The star catalogs with the F814W and F555W photometry were then cleaned of several kinds of bad measurements due to misidentifications: bright star halos, bleed columns, diffraction spikes and parts of bright background galaxies. SExtractor (Bertin & Arnouts, 1996) was run on the F814W images to provide classifications of objects down to about 1 mag above the limit. Those classes were then used to clean fainter galaxies out of the catalogs, as well as close stellar pairs. Remaining stars with a chi squared fit to the PSF function greater than 1.0 were also deleted. The photometry was then placed on the standard Johnson/Kron-Cousins VI system using the aperture corrections and synthetic transformations provided in Sirianni et al. (2005), Appendix D, tables 5 and 18. Some care has to be taken as the transformation equations used depend on instrumental color. Coefficients and aperture corrections were taken from Tables 22 and 5 of Sirianni et al. (2005). The transformation uncertainties comprise those from: the aperture correction from the DAOPHOT aperture to 0.5˝ , the correction from 0.5˝ to infinity, and the the transformation to the standard system. In the I system, these uncertainties are 0.007, 0.002 and 0.024 mag, respectively for a total of 0.025; for V, they are 0.014, 0.001, and 0.01 for a total of 0.017. These are small compared to the uncertainties in the average tip magnitudes and colors used below.
Radial limits were defined for each of the 6 galaxies, following their average elliptical isophotes, thereby allowing stars from the full image catalogs to be associated with particular galaxies, or a local background. The limits were chosen to be approximately at the radius where the star density was about twice that of the “background,” where the latter is estimated from areas on the frames most remote from the 6 galaxies. The center of VCC941 was sufficiently crowded to affect the photometry, so stars within the elliptical area with geometric mean radius of 3.5˝ were also excluded. For the two large galaxy halos that appear in the corners of SW2 field, the areas are of course wedges, since the galaxy centers are far off of the CCD images (outlined in figure 1).
The background area on the N field is the southwest corner of the image. For the SW2 field, several background areas were chosen - one surrounding lsb31 itself, used in correcting the luminosity function and cmd for contamination from NGC4407, another in the southeast corner, and a third north of VCC871. The latter two were used to investigate the question of the extent of NGC 4407.
2.6. Artificial Star Tests
DAOPHOT calculated and listed photometric uncertainties for each star, using photon statistics in the apertures, the uncertainties in sky determination, and the readout noise of the CCD detectors. Mean values of the uncertainties in I and V–I were then computed for 0.5 mag bins in I magnitude along the apparent giant branches. At I=27.0, the apparent location of the giant branches, the mean uncertainty in color is about 0.19 mag. At I=28.25 mag, the uncertainty has increased to 0.3 magnitude. The cmds below show all the calculated uncertainties in graphical form.
It is typical in color-magnitude diagram work to compare such internal estimates of the uncertainties with those derived from separate observations of the same field. The present data set doesn’t lend itself to such analysis because most of the stars are near the detection limit, and producing two separate images instead of one from the total frames available would render many stars difficult to measure. However, artificial star tests may be performed, which give an additional estimate of the uncertainties. An artificial giant branch was created, using the mean colors and magnitudes estimated from the SW2 lsb31 cmd. Stars with those I and V magnitudes were randomly placed in the SW2 F814W and F555W images (after converting the photometry back to instrumental values), and the images were processed as before. Each pass in the process consisted of adding 700 stars to the images; passes were run until the statistics no longer improved. Differences in input and derived magnitudes and colors were collected, and means formed. These mean uncertainties are also shown in figure 5 and are essentially the same at each magnitude bin as those found from the method using the calculated photometric uncertainties on the real stars.
Artificial star tests were also performed to assess the limiting I magnitude, and limiting V–I color as a function of I magnitude, important quantities in the analysis of the color magnitude diagrams in that the reddest giant stars will likely be fainter than the detection limit in the F555W images. At each 0.25 magnitude bin between magnitudes 27 and 29.5 for both filters, 100 stars were added at random to the images. The photometric reductions were run again as above, to determine what fraction of the added stars were recovered. This was done 5 times at each magnitude bin, to average out the results. The result was that 50% of the stars are lost at I=28.2, and at V=28.95.
3. Color-Magnitude Diagrams
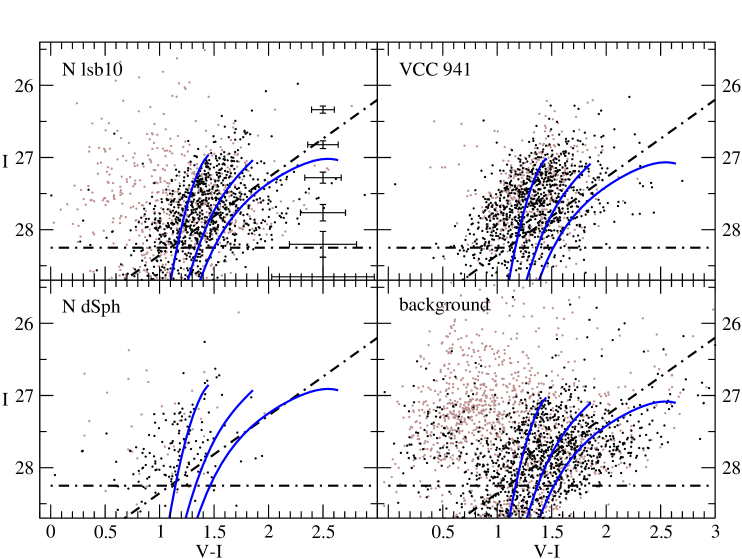
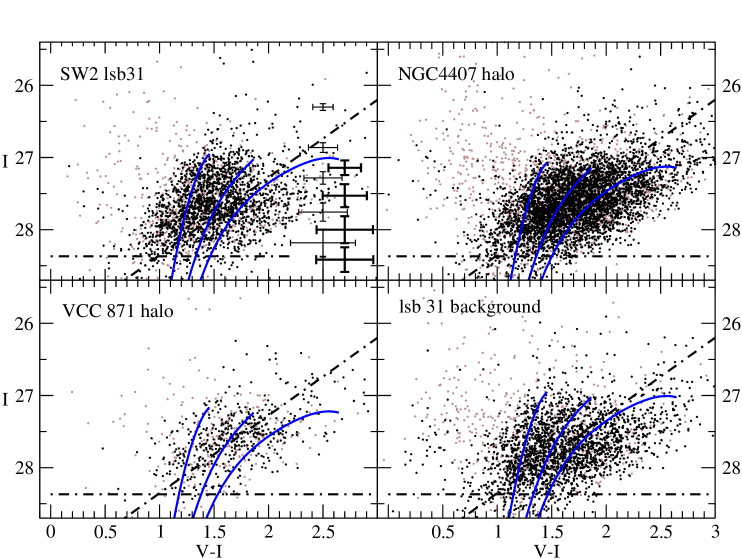
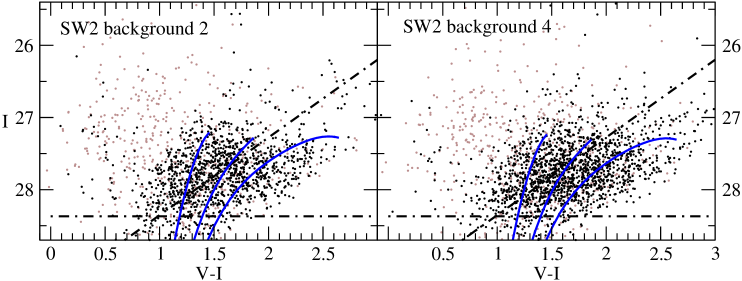
Figure 4 shows the color-magnitude diagrams for the N field, while figures 5 and 6 show the cmds for the SW2 field The average uncertainties in color and magnitude described above are shown only in the N lsb31 and SW2 lsb31 cmds, though they apply to all the graphs in each figure. The error bars with heavy lines represent the uncertainties determined by artificial star tests. The limit for 50% recovery in I is shown as a dot-dashed line at I=28.2, and the diagonal line incorporates that limit with the one in V to arrive at the color limit. Faint dots are objects classified as non-stellar by SExtractor, though many of these are in fact crowded stars which DAOPHOT was able to obtain satisfactory photometry, but which SExtractor did not separate into individual stars. Nonetheless, these are excluded from the derivation of metallicity and distance.
There are two obvious results from these diagrams. First, giant branch stars have been successfully detected, down to perhaps 1.2 magnitudes below the tip. Second, there are strong incompleteness factors for stars on the red side of the giant branches, stemming from the insufficient depth of the F555W exposures. The fiducial giant branches of galactic globular clusters are shown in this figure (see below), which indicate that at least % of stars in a 47 Tuc population would be missed in the F555W filter (though such stars would show up in the F814W images). An even larger fraction of stars in a more metal rich population would be lost. Such an incompleteness would thus artificially lower estimates of the metal abundance in metal rich populations. For the four faint galaxies though, N lsb10, VCC941, N dSph, and SW2 lsb31, the cmds show a distinct gap between the distribution of detected stars and the 50% loss line, and so we expect the systematic effects in the metal abundance determinations to be small. To verify this assertion, we studied the stars found on the F814W frames but not on the F555W frames. If a large number of red stars had been missed in the cmds, the brighter ones should still have appeared in the F814W frames and been cataloged. For the apparently reddest population, that of NGC4407, indeed about 6% of the stars detected in the F814W frame brighter than I=27.5 had no F555W measurement, and are missing from the cmd. However, for SW2 lsb31 for instance, only 2% of the brighter stars are missing from the cmd.
In comparing the cmds for the different objects and backgrounds, it seems clear that all these have tip magnitudes close to I=27, meaning they are all at about the same distance. N dSph appears to be more distant by about 0.2 mag, though the paucity of stars (not surprising given its luminosity of V=–9.6) makes the tip determination especially uncertain. Its giant branch is distinctly the bluest one of those presented here. A test confirming that was performed by selecting stars randomly from the cmd of VCC941 in numbers equal to the number of stars in the N dSph cmd. Out of 100 tests, no sample from VCC941 had the same color distribution as the stars in N dSph.
While the mean uncertainty in color at the TRGB is around 0.19 mag, the rms scatter in observed V–I colors is around 0.22 for N lsb10 and VCC941, and 0.24 for SW2 lsb31. This may mean that a spread in metal abundance has been detected, though for SW2 lsb31, the spread is at least in part due to the presence of RGB stars from NGC4407. The 0.3 mag uncertainty in V–I at I=28.25 explains the large spread in color at the fainter magnitudes. The redder giant branches of VCC871, NGC4407 and the two background fields will naturally mean that only lower limits to their metallicities could be estimated with the current data.
Upper AGB stars indicative of an intermediate age population are occasionally present in metal-poor populations, such as the dwarf elliptical F8D1 in the M81 group (Caldwell et al., 1998). If present in these Virgo galaxies, they would extend over a magnitude brighter in I, and range in color from that of the blue edge of the giant branch tip to several magnitudes redder (e.g., ). There is some evidence for these in the cmds of each of the four low luminosity galaxies, though the numbers are small, and a quantitative analysis of the fraction of light contributed by an Gyr population isn’t warranted by the data. A qualitative comparison with the two M81 dwarf galaxies studied in Caldwell et al. (1998), concludes that no more than 30% of the light in the Virgo dwarfs could be from an intermediate age population. The RGB tip of NGC 4407 may be confused by the presence of stars more luminous than M, such as are found in populations as metal rich as 47Tuc. The halo cmds of the nearby spirals observed with WFPC2 by Mouhcine et al. (2005) also show a number of stars above the RGB tip.
A small number of blue stars appear in these cmds, with V–I colors bluer than 0.7. About half of these are clearly non-stellar on inspection, objects which the SExtractor classifications indicated an uncertainty. A few are clearly stellar though, and we point out one star in particular in VCC941, seen at I=27.3 and V–I=0.06 in figure 4. The numbers of the apparently real blue stars are too low to indicate recent star formation; rather they may be examples of post-horizontal branch stars (“UV-bright stars” Zinn (1974) ), though the M for the VCC941 stars is brighter than any known UV bright star in galactic globulars. Other photometric colors would be helpful in sorting these stars out, though the V–I colors already rule out planetary nebulae.
4. Distances and Metal Abundances
The tip of the red giant branch represents the luminosity at which the helium core flash begins, a value that varies slowly with age and metal abundance for old, metal-poor populations (Da Costa and Armandroff 1990). The technique of deriving distance modulii by measuring the I band magnitude of the tip, converting to a bolometric luminosity, and then using a calibration of tip luminosity with abundance has become a common tool (Lee et al., 1993; Caldwell et al., 1998; Karachentsev et al., 2003). We also estimated the metal abundances using the color of the giant branch, using the quadratic calibration provided in Armandroff et al. (1993) and Caldwell et al. (1998) . The process of deriving distances and metal abundances was thus iterative in nature. Reddenings were taken from the catalog of Schlegel et al. (1998), and are listed in Table 2.
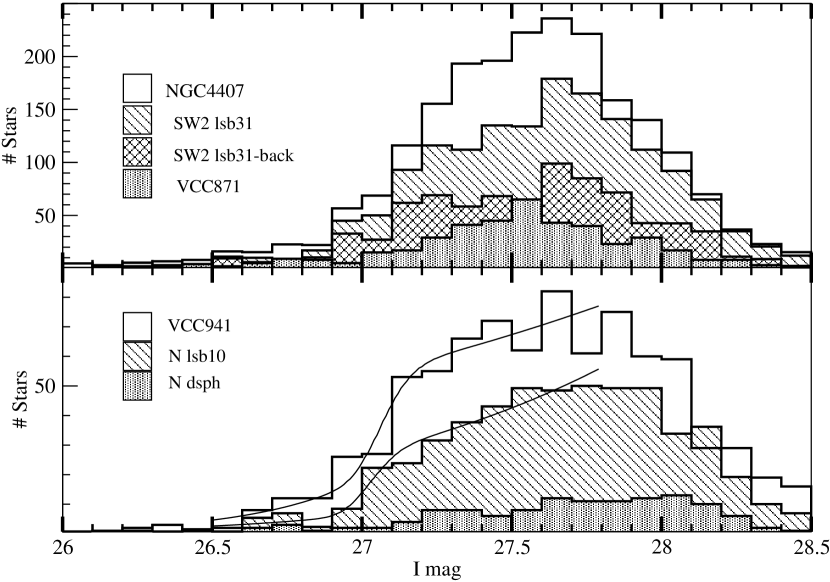
We began by forming I band luminosity functions from the stellar photometry catalogs. The background star density in the N field is low enough to ignore for the three galaxies in that field, N lsb10, VCC941, and N dSph, but such is not true for the SW2 field. An annular region around SW2 lsb31 was chosen to correct the function for that galaxy, though in the end, the correction did not affect either the tip magnitude or the derived distance and metallicity. Stars with colors 0.3 mag redder than the color cutoff line were excluded, as were very blue stars. Magnitudes were put into 0.1 mag bins, and those are shown in Figure 7. Only the histogram for SW2 lsb31 has been background subtracted. The histograms do not represent the same area on the sky, so the relative scales among galaxies in the figure are unimportant.
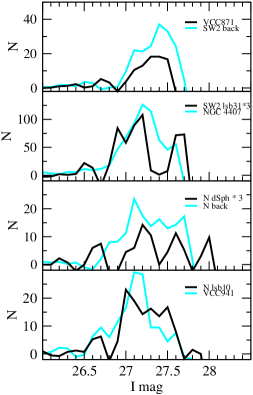
All of these histograms show a clear slope change near I=27, with varying degrees of significance. N dSph is probably the weakest case, but the cmd shows pretty convincingly that the tip is near I=27 as well. The apparent tip magnitudes were estimated using two techniques. First the binned luminosity functions were passed through a Sobel filter (-1,0,+1) (Lee et al., 1993) , with uncertainties set by choosing different binning parameters, which are found to be 0.1 mag for all but N dSph and VCC871, which are 0.15 mag. The filtered luminosity functions are shown in figure 8. While these do indicate that the gb tips are clearly within 0.2 mag of I=27, the functions for several objects are noisy, and the slopes are not very steep, due to the small numbers of stars.
A maximum likelihood method was used as a second estimator of the apparent tip magnitudes, and was patterned after that described in Méndez et al. (2002). In brief, the luminosity distributions were represented with a broken-power-law function, with the break between the powers occurring at the RGB tip. The observed errors at each magnitude were used as a smoothing function for the power-law. A grid of likelihoods was formed by varying the 4 parameters of the function: the two powers, the magnitude difference between the powers, and the tip magnitude. The parameter set giving the maximum likelihood was identified, which gave the most probable value for the tip magnitude. Uncertainties in the tip were calculated by a bootstrap monte carlo method, whereby the star sample for each galaxy is randomly sampled, with replacement, many times. The standard deviation of the tip magnitude values from the all the runs is then taken as the uncertainty in the measurement of the tip. Several of the derived analytic luminosity functions (including the error smoothing) are shown along with the binned luminosity functions in figure 7.
Both of these estimators have drawbacks - the edge detection method is sensitive to the binning, while the results from the maximum likelihood method depend on the parent analytic function being correct. However, the two estimators generally gave tip magnitudes within the associated errors, with the maximum likelihood method tending to average the noisy peaks seen in 8. The maximum likelihood values are listed in table 2.
To derive a distance then, we used an iterative process that incorporates the dependence of bolometric correction on the color of the giant branch tip (BC), the dependence of bolometric luminosity of such stars on [Fe/H] ( , both from Da Costa & Armandroff (1990)), and the observed relation between [Fe/H] and mean giant branch color at M (about I=27.5 here, [Fe/H]= from Armandroff et al. (1993) ). With this method, we derived the distances and [Fe/H] estimates for the six galaxies as well as three different background areas in the images, which are listed in Table 2. One can also avoid the dependence of on metallicity, and simply use , which is nearly constant at -4.05 over the metallicity range likely for the dwarfs. The resultant modulii are not significantly different from the values in the table.
The uncertainties in distance modulii were derived from the photometric calibration uncertainties (mag), the uncertainty in extinction (0.02 in E(B-V)), the uncertainty in determining the RGB tip (0.10-0.15mag), and the uncertainty in induced by the uncertainty in [Fe/H] (mag). Likewise, the uncertainties in [Fe/H] were derived by propagating the uncertainties in tip magnitude determination, uncertainty in the measured V–I color of the stars, and the photometry uncertainties, and then all combined with the calibration uncertainty of 0.08dex.
These distance modulii along with the reddenings were used to place fiducial galactic globular cluster giant branches in figures 4, 5 and 6. The location of observed stars with respect to the globular sequences supports the tabulated distance modulii and abundances (and demonstrates the limitations on the [Fe/H] results for the more metal rich halo fields and the background fields).
5. Distance to Virgo Using the RGB Tip Stars
While there are strong biases in the [Fe/H] determinations for the two halo fields and the backgrounds, the distance modulii values should be relatively unaffected by the redder giant branches. The color term in the conversion of the ACS F814W magnitude to standard I for the red giant stars is . and thus systematic errors of only 0.03 mag would exist for stars with estimated (V–I) , but which have true (V–I) , in the sense that the estimated magnitudes are too bright. This potential error appears small enough to ignore. Thus we calculated a distance for the Virgo cluster using intracluster stars as well as distinct galaxies. The mean of the distance moduli for the 6 galaxies observed here is , for a distance of Mpc. The distance modulii for the intracluster stars in both fields is ( Mpc).
These distances compare favorably with the value of Mpc of Harris et al. (1998), and also with the distance Mpc found by the HST key project group (Kelson et al., 2000), using Cepheids found in 5 Virgo spirals, and calibrated with LMC P-L relation, where the LMC distance modulus was taken to be 18.50. The distance scale used here (from Da Costa & Armandroff (1990), but originating in Zinn & West (1984) ) is tied to galactic globular cluster distances which use an RR Lyrae scale with MV=0.82 + 0.17[Fe/H] (Lee et al., 1990). Given the long history of discrepant distances to Virgo, it is gratifying that the distance here, taken from a method using old populations, agrees well with the method that uses young populations.
Sandage et al. (2006) reported a Virgo distance of Mpc (m–M=), from the combination of Cepheid distances to 4 galaxies, SN Ia luminosity distances to three galaxies, and the Tully-Fisher relation for 49 spirals. Such a large distance estimate is clearly incompatible with the magnitudes of the red giant tip stars found in any of the galaxies or for the intracluster stars presented here. However, five of the seven individual galaxies in that study have distances in accord with the new RGB tip distance to the cluster.
5.1. Virgo Cluster Depth
The exceedingly small areas imaged here with ACS preclude any meaningful measurement of the cluster depth, but a few items are worth discussing. There is indeed a significant detection of differences in distances among the galaxies, at the level of 0.2 mag, or 1.5 Mpc. This corresponds well with the depth estimate of 1.2 Mpc found by Jacoby et al. (1990) from Virgo PN, and within the upper limit of 3.4 Mpc found by Jordán et al. (2005) from the globular cluster luminosity functions of Virgo early type galaxies.
Second, the intracluster stars appear to rule out a distance (at least for those areas of the cluster) smaller than 15 Mpc (m–M=30.9). A large depth of the cluster would diminish the slope of the field star luminosity function at the red giant tip. The general effect was simulated using an observed I band luminosity function derived from ACS/HST data of an M81 dE galaxy (Caldwell & Da Costa, 2006), shifted to the distance modulus of Virgo. The luminosity function was then distributed along the line of sight using a gaussian Mpc (0.23 mag), and inspected. Such a depth would have washed out the observed I band rise for the N field, and thus the Virgo depth must be smaller than 2Mpc. A depth corresponding to Mpc (0.13 mag) is more in accord with the observations here, though clearly this is a topic for which more deep ACS fields at different positions in the cluster are needed to provide a definitive result.
5.2. Intracluster Stars
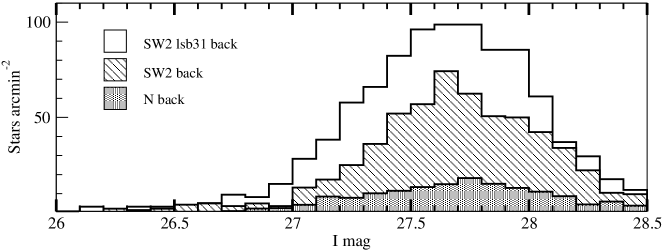
The luminosity functions for the background fields are shown in Figure 9. Here the histograms represent stars arcmin-2 , and one can see the large difference in star densities between the N and SW2 field. Remarkable is the fact that even in the N field, where there are no large galaxies nearby, and the three target dwarfs have well defined limiting radii, a clear break in the function for the background is seen also at I=27, meaning that free-floating red giant branch stars have been detected in the Virgo cluster.
Some information may be obtained about the metal abundances of the N field intracluster population by comparison with the other cmds, bearing in mind the limitations of the present data and assuming that the color limits are the same for all the objects. For N intracluster stars 0.5 mag fainter than the tip, the mean V–I color is 1.45, with an rms of 0.26 mag. That is somewhat bluer than the mean color of 1.67 for the halo of NGC4407, meaning the N field stars are more metal poor. The rms is larger than that found in the three well observed dwarfs (N lsb10, SW2 lsb31, and VCC941), thus we can also conclude that there is a larger spread in abundances than found in the dwarf galaxies.
The SW2 field stars are possibly related to the spiral NGC4407, though the distribution is not continuous. Figure 10 shows the distribution of resolved stars in SW2 with I ; the image has been binned substantially to increase the contrast. The SW2 background field was taken from the lower left of this image, which is around 23 kpc radially distant from the center of NGC4407. The halo of NGC4407 clearly extends to the center of the image, where lsb31 lies, but not obviously beyond that. Yet, the distance moduli of the spiral and that of the background are similar, and distinct from lsb31. A case can be made that the SW back2 stars are in the mean more metal-poor than those of the spiral halo, though that may be expected given the galactocentric distance.
A rough conversion to surface brightness for the Virgo stellar background can be made by using I band surface photometry and the ACS resolved star photometry in the F814W image for VCC941 collected into the same radial bins. A mean V–I was measured for the galaxy (0.9), given a conversion from star counts in F814W to V surface brightness. Applying this to the background star counts, we derived a surface brightness for the N background stars of mag arcsec-2, in V, and 27.0 for the SW2 field. (The conversion can also be used to calculate central surface brightnesses of the two extremely low surface brightness galaxies, N lsb10 and SW2 lsb31, which can’t be measured with surface photometry of the ACS images. These are compared with the KPNO 4m data in table 2.)
Both ACS fields are hundreds of kpc from from M87, which reaches V=29 mag arcsec-2 at about 0.4 degree radius, or 130 kpc (Oemler, 1976), thus the N background population is likely not part of the extended halo of that cD galaxy. It is comprised of true intracluster stars. The background surface brightness for the N field is lower than estimates made from PN surface densities (Feldmeier et al., 2004), which range from V=26.5 to 28.4. The PN estimates require a number of assumptions to be made about the PN parent populations, which are probably more uncertain than the corrections made here (a constant V-I was assumed here, as well as a constant detection bias between the calibrating galaxy VCC941 and the background fields). In any case, the surface brightness reported here of V=29.0 refers to a single location in the cluster, that of the N field.
6. Comparing Extremely Low Surface Brightness Galaxy Populations
The mean metal abundance for dwarf elliptical galaxies has been known to correlate well with the luminosity of the galaxy, a fact attributed to the onset of mass loss in galaxies where the potential well is not deep enough to retain the mass lost from evolving stars (Caldwell et al., 1998; Dekel & Silk, 1986). The Local Group dwarf spheroidals define a fairly tight relation, when the abundances are all determined via the same method (RGB tip color), though there is some scatter at the faint end, and only a few galaxies define the bright end. Dwarf ellipticals in the M81 group also exhibit this relation, and furthermore show that surface brightness is not as well-correlated with abundance as is luminosity. A luminous (for a dwarf) galaxy that has very low surface brightness in the group (M81-F8D1) has an [Fe/H] value that is in agreement with Local Group dwarfs of similar luminosity, but in disagreement with those of similar surface brightness. The two extremely low surface brightness galaxies observed provide a further test of the relative importance of total luminosity over surface brightness in determining mean abundance, and the N dSph galaxy provides another datum at the low luminosity end, where there is some real scatter, as well as disagreement about abundances for certain galaxies (e.g. Davidge et al. (2002) find [Fe/H]=-2.2 for And V, while McConnachie et al. (2005) find -1.5).
Figure 11 is a plot showing the relation between the three parameters of MV, Vo, and [Fe/H] for nearby dwarf ellipticals, drawn from the literature. Plotted as well, and identified by larger symbols are the 5 dwarf galaxies in this study. Clearly, the N lsb10 and SW2 lsb31 dwarfs, the two extremely low surface brightness galaxies, have abundances typical for their luminosities, which are brighter than the Sculptor dSph, but fainter than the Fornax dwarf, even though those two Virgo galaxies have surface brightnesses nearly 3 magnitudes fainter than those Local Group galaxies.
The N dSph galaxy, with its luminosity close to that of Draco and Uminor, appears to have a metal abundance lower than any previously known dwarf, though of course the uncertainties are high on its abundance. VCC941, the relatively high surface brightness galaxy has an abundance within the spread of more nearby galaxies of its luminosity, though its metallicity is much lower than some other galaxies of similar surface brightness. In that way, it is like Leo I, another relatively high surface brightness galaxy whose abundance tracks luminosity rather than surface brightness.
The photometric bias that resulted in a loss of very red, hence metal rich stars, shows up particularly in the case of VCC871. Only a a lower estimate was found for [Fe/H], and that is from a location 6 kpc or 4.5 from the center, which may be more metal poor than the galaxy mean. So the location of the datum for VCC871 serves only to indicate a lower bound of the true mean abundance.
7. Summary
The resolving power of the ACS on the Hubble telescope allows individual red giant stars in galaxies as distant as the Virgo cluster to be imaged. Although only two fields were studied here, and the depth of the F555W images leaves much to be desired, a number of interesting results have come out.
Regarding dwarf galaxies, we can say for certain that extremely low surface brightness galaxies do exist, and can inhabit the central regions of clusters. That such apparently tenuous galaxies are found in densely packed volumes of space is somewhat of a curiosity, considering the possibilities for disruption due to tidal forces. The reason for survival may have to do with the dominance of dark matter in dwarfs, or the orbits of the dwarfs within the cluster. Orbits which confine the dwarfs to the cluster core would result in small tidal stresses due to the mean cluster field, though tides from interactions with individual galaxies could still be destructive.
The five dwarf ellipticals studied here are similar in luminosity and metal abundance to those of the Local Group and other nearby groups, in that metallicity closely follows galaxy luminosity, but is nearly independent of surface brightness. However, the two principal target galaxies, N lsb10 and SW2 lsb31, are examples of extremely low surface brightness galaxies with limiting radii greater than 2 kpc, and are not currently known in the Local Group. The lack of a surface brightness-metallicity correlation could mean that the large, extremely low surface brightness galaxies were more compact during their episodes of star formation, and expanded greatly as a result of either mass loss during those episodes or external tidal forces. Why some dwarf galaxies expanded much more than others is an unresolved question.
The tip of the red giant branch is currently a favored method of deriving distances for old stellar populations in more nearby galaxies, and thus the resolved galaxies here are particularly valuable in that they can give a distance to the Virgo cluster that is independent of previous measurements. Doing so, a mean distance of 16.1 Mpc is found for the six galaxies observed here, in accord with the distance of 17.4 Mpc for the Virgo intracluster stars. The depth of the cluster is not likely to be more than 1 Mpc, as a gaussian standard deviation.
Assuming an extended lifetime for HST, other projects to study the stellar populations in a variety of galaxy types appear possible in Virgo, perhaps providing clues to the galaxy morphology transformations that occur in cluster environments.
References
- Armandroff et al. (1993) Armandroff, T. E., Da Costa, G. S., Caldwell, N., & Seitzer, P. 1993, AJ, 106, 986
- Bertin & Arnouts (1996) Bertin, E., & Arnouts, S. 1996, A&AS, 117, 393
- Binggeli et al. (1985) Binggeli, B., Sandage, A., & Tammann, G. A. 1985, AJ, 90, 1681
- Binggeli et al. (1987) Binggeli, B., Tammann, G. A., & Sandage, A. 1987, AJ, 94, 251
- Caldwell & Da Costa (2006) Caldwell, N., & Da Costa, G. S. 2006, in preparation
- Caldwell et al. (1998) Caldwell, N., Armandroff, T. E., Da Costa, G. S., & Seitzer, P. 1998, AJ, 115, 535
- Caldwell et al. (2006) Caldwell, N., Armandroff, T. E., & McIntosh, D. , in preparation
- Conselice et al. (2003) Conselice, C. J., Gallagher, J. S., & Wyse, R. F. G. 2003, AJ, 125, 66
- Da Costa (2004) Da Costa, G. S. 2004, Publications of the Astronomical Society of Australia, 21, 366
- Da Costa & Armandroff (1990) Da Costa, G. S., & Armandroff, T. E. 1990, AJ, 100, 162
- Da Costa et al. (1996) Da Costa, G. S., Armandroff, T. E., Caldwell, N., & Seitzer, P. 1996, AJ, 112, 2576
- Davidge et al. (2002) Davidge, T. J., Da Costa, G. S., Jørgensen, I., & Allington-Smith, J. R. 2002, AJ, 124, 886
- Dekel & Silk (1986) Dekel, A., & Silk, J. 1986, ApJ, 303, 39
- Feldmeier et al. (2004) Feldmeier, J. J., Ciardullo, R., Jacoby, G. H., & Durrell, P. R. 2004, ApJ, 615, 196
- Geha et al. (2003) Geha, M., Guhathakurta, P., & van der Marel, R. P. 2003, AJ, 126, 1794
- Geisler et al. (1999) Geisler, D., Armandroff, T., da Costa, G., Lee, M. G., & Sarajedini, A. 1999, IAU Symposium, 192, 231
- Han et al. (1997) Han, M., Hoessel, J. G., Gallagher, J. S., Holtsman, J., & Stetson, P. B. 1997, AJ, 113, 1001
- Jacoby et al. (1990) Jacoby, G. H., Ciardullo, R., & Ford, H. C. 1990, ApJ, 356, 332
- Harris et al. (1998) Harris, W. E., Durrell, P. R., Pierce, M. J., & Secker, J. 1998, Nature, 395, 45
- Jerjen & Rejkuba (2001) Jerjen, H., & Rejkuba, M. 2001, A&A, 371, 487
- Jordán et al. (2005) Jordán, A., et al. 2005, ApJ, 634, 1002
- Karachentsev et al. (2001) Karachentsev, I. D., et al. 2001, A&A, 375, 359
- Karachentsev et al. (2002) Karachentsev, I. D., et al. 2002, A&A, 383, 125
- Karachentsev et al. (2003) Karachentsev, I. D., et al. 2003, A&A, 404, 93
- Kelson et al. (2000) Kelson, D. D., et al. 2000, ApJ, 529, 768
- Koekemoer et al. (2002) Koekemoer, A. M., Fruchter, A. S., Hook, R. N., & Hack, W. 2002, The 2002 HST Calibration Workshop : Hubble after the Installation of the ACS and the NICMOS Cooling System, Proceedings of a Workshop held at the Space Telescope Science Institute, Baltimore, Maryland, October 17 and 18, 2002. Edited by Santiago Arribas, Anton Koekemoer, and Brad Whitmore. Baltimore, MD: Space Telescope Science Institute, 2002., p.337, 337
- Lee et al. (1993) Lee, M. G., Freedman, W. L., & Madore, B. F. 1993, ApJ, 417, 553
- Lee et al. (1990) Lee, Y.-W., Demarque, P., & Zinn, R. 1990, ApJ, 350, 155
- McConnachie et al. (2005) McConnachie, A. W., Irwin, M. J., Ferguson, A. M. N., Ibata, R. A., Lewis, G. F., & Tanvir, N. 2005, MNRAS, 356, 979
- Méndez et al. (2002) Méndez, B., Davis, M., Moustakas, J., Newman, J., Madore, B. F., & Freedman, W. L. 2002, AJ, 124, 213
- Mobasher et al. (2003) Mobasher, B., et al. 2003, ApJ, 587, 605
- Mouhcine et al. (2005) Mouhcine, M., Ferguson, H. C., Rich, R. M., Brown, T. M., & Smith, T. E. 2005, ApJ, 633, 810
- Oemler (1976) Oemler, A. 1976, ApJ, 209, 693
- Reiss and Mack, (2004) Reiss, A. & Mack, J. 2004, Instrument Science Report ACS 2004-006, Space Telescope Science Institute.
- Rejkuba et al. (2006) Rejkuba, M., da Costa, G. S., Jerjen, H., Zoccali, M., & Binggeli, B. 2006, A&A, 448, 983
- Sandage et al. (2006) Sandage, A., Tammann, G. A., Saha, A., Reindl, B., Macchetto, F. D., & Panagia, N. 2006, ArXiv Astrophysics e-prints, arXiv:astro-ph/0603647
- Schlegel et al. (1998) Schlegel, D. J., Finkbeiner, D. P., & Davis, M. 1998, ApJ, 500, 525
- Sharina et al. (2005) Sharina, M. E., Puzia, T. H., & Makarov, D. I. 2005, A&A, 442, 85
- Sirianni et al. (2005) Sirianni, M., et al. 2005, PASP, 117, 1049
- Stetson (1987) Stetson, P. B. 1987, PASP, 99, 191
- Trentham & Hodgkin (2002) Trentham, N., & Hodgkin, S. 2002, MNRAS, 333, 423
- Zinn (1974) Zinn, R. 1974, ApJ, 193, 593
- Zinn & West (1984) Zinn, R., & West, M. J. 1984, ApJS, 55, 45
| Field | Name | RA | Dec | R | B–R | Bo | F555W | F814W | |||
|---|---|---|---|---|---|---|---|---|---|---|---|
| 2000 | arcsec | exp (s) | # | exp (s) | # | ||||||
| North | N lsb10 | 12:26:48.1 | 13:21:17.5 | 19.7 | 2560 | 13 | 1200 | 12 | |||
| VCC941 | 12:26:47.9 | 13:22:45.8 | 4.0 | ||||||||
| N dSph | 12:26:42.1 | 13:22:33.0 | 5.0aaDerived from ACS image | ||||||||
| SW2 | SW2 lsb31 | 12:26:20.1 | 12:34:25.3 | 21.0 | 2560 | 13 | 1200 | 12 | |||
| VCC871 | 12:26:05.6 | 12:33:35.0 | 19.6 | ||||||||
| NGC4407 | 12:26:32.2 | 12:36:40 | |||||||||
| Name | E(B-V) | TRGBaaObserved I magnitude | (m-M)0 | [Fe/H] | MVbbderived from Bo and extinction from table 1, and assuming B-V=0.7 | MV,acsccDerived from ACS images, either via surface photometry, or star counts calibrated to surface photometry (see text). | Vobbderived from Bo and extinction from table 1, and assuming B-V=0.7 | Vo,acsccDerived from ACS images, either via surface photometry, or star counts calibrated to surface photometry (see text). |
|---|---|---|---|---|---|---|---|---|
| N lsb10 | 0.03 | 27.0 | 31.0 | -1.6 | -11.6 | 26.8 | 26.2 | |
| VCC941 | 0.03 | 27.1 | 31.1 | -1.7 | -12.9 | -12.8 | 22.4 | 22.4 |
| N dsph | 0.03 | 27.0 | 30.9 | -2.2 | -8.9 | -9.4 | 26.4 | 25.5 |
| N back | 0.03 | 27.0 | 31.1 | -1.1 | 29.0 | |||
| SW2 lsb31 | 0.03 | 27.0 | 30.9 | -1.5 | -12.9 | 26.1 | 26.2 | |
| NGC4407 | 0.03 | 27.1 | 31.1 | -1.0 | ||||
| VCC871 | 0.03 | 27.3 | 31.2 | -1.3 | -16.4 | 21.0 | ||
| SW2 back2 | 0.03 | 27.2 | 31.2 | -1.2 | ||||
| SW2 back4 | 0.03 | 27.3 | 31.3 | -1.1 | 27.5 |