A search for optical bursts from the rotating radio transient J1819–1458 with ULTRACAM
Abstract
We report on the search for optical bursts from J1819–1458, a member of the recently discovered Rotating Radio Transients (RRATs). J1819–1458 exhibits 3 millisecond bursts with a peak flux of = 3.6 Jy every minutes, implying that it is visible for only second per day at radio wavelengths. Assuming that the optical light behaves in a similar manner, the most sensitive way of detecting RRATs is hence not to take long exposures of the field, but instead to capture individual bursts using a high-speed camera mounted on a large aperture telescope. Using ULTRACAM on the 4.2-m William Herschel Telescope (WHT) we obtained 97 100 images of the field of J1819–1458, each of 18.1 milliseconds exposure time and with essentially no dead-time between the frames. We find no evidence for bursts in , and at magnitudes brighter than 15.1, 17.4 and 16.6 (5), corresponding to fluxes of less than 3.3, 0.4 and 0.8 mJy at 3560Å, 4820Å and 7610Å, respectively.
keywords:
stars: neutron – pulsars: individual: J1819–1458.1 Introduction
The RRATs are a remarkable new class of variable star characterized by their radio bursts of duration 2–30 milliseconds which recur every 4–180 minutes (McLaughlin et al., 2006). The RRATs, of which 11 are currently known, exhibit periodicities of 0.4–7 seconds, inferred by dividing the intervals between bursts by the largest common denominator. Such periods are long in comparison with most radio pulsars and are instead reminiscent of the periods found in the radio-quiet Anomalous X-ray Pulsars (AXPs), Soft Gamma Repeaters (SGRs) and X-ray Dim Isolated Neutron Stars (see Woods & Thompson 2006 and Haberl 2004). The distances to the RRATs can be estimated from their dispersion measures and it is found that they lie 2–7 kpc away in the Galactic plane. In the three RRATs with the most frequent bursts it has also been possible to measure a period derivative, showing no evidence for binarity but instead that these objects spin down like other pulsars. In the case of J1819–1458, the inferred magnetic field strength is high ( G), providing another link between the RRATs and the magnetars (i.e. the AXPs and SGRs).
The sporadic nature of the bursts in RRATs makes localization to better than the 14 arcminute beam of the Parkes Telescope difficult. Fortunately, the positions of the three RRATs with period derivatives can be refined through radio timing and were quoted to an accuracy of arcseconds by McLaughlin et al. (2006). This enabled Reynolds et al. (2006) to identify the Chandra source CXOU J181934.1–145804, lying within 2 arcseconds111It should be noted that this assumes updated radio coordinates which differ from the radio position listed in McLaughlin et al. 2006 (Steve Reynolds, private communication). of the radio source, as the X-ray counterpart to J1819–1458. The X-ray properties of the source, which is point-like and shows no variability, are consistent with thermal emission from a cooling neutron star (Reynolds et al., 2006), lending further weight to the hypothesis that RRATs are rotating neutron stars.
To further constrain the nature of RRATs, it is desirable to observe them at different wavelengths. Reynolds et al. (2006) made a first attempt at this by searching optical and infrared archives for counterparts to CXOU J181934.1–145804. They found none, but their limits are not particularly deep (). Taking longer exposures to go deeper is not necessarily the best solution, however, as the RRATs may have very faint persistent optical/IR emission and only emit strongly at these wavelengths during bursts222Reynolds et al. (2006) found no evidence for X-ray bursts in CXOU J181934.1–145804, but this does not mean optical bursts will be undetectable – the AXP 4U 0142+61, for example, exhibits a pulsed fraction 5–7 times greater in the optical than the X-ray (Dhillon et al., 2005). In addition, by analogy with the Crab pulsar, searching for optical bursts (as opposed to any persistent emission) may also be the most sensitive method of detecting RRATs – the main optical pulse of the Crab is 5 magnitudes brighter in the B and V-bands compared to its persistent light level and is coincident (to within 100 s) with the radio peak (Golden et al., 2000).. Given that the duration of the bursts in J1819–1458, for example, only total second a day, the best strategy would then be to reduce the contribution of the sky and take a continuous sequence of extremely short exposures on a large-aperture telescope covering a number of burst cycles in order to catch a burst in one or two of the frames.
With the high-speed, triple-beam CCD camera ULTRACAM at our disposal (Dhillon & Marsh, 2001), we have the ideal tool with which to search for optical bursts from RRATs. In this paper, we report on an attempt to detect such bursts from the RRAT J1819–1458. We selected this RRAT as it exhibits both the most frequent and most powerful radio bursts – a 3 millisecond burst of 3.6 Jy (at 1400 MHz) occurring every minutes, with the burst intervals showing a periodicity of 4.26 seconds. Thanks to the X-ray identification by Reynolds et al. (2006), J1819–1458 is also the RRAT with the best-determined position, accurate to 0.5 arcseconds, and is one of the closer RRATs to the Earth (at a distance of 3.6 kpc).
2 Observations and data reduction
The observations of J1819–1458 presented in this paper were obtained with ULTRACAM (Dhillon & Marsh 2001, Beard et al. 2002) at the Cassegrain focus of the 4.2-m William Herschel Telescope (WHT) on La Palma. ULTRACAM is a CCD camera designed to provide imaging photometry at high temporal resolution in three different colours simultaneously. The instrument provides a 5 arcminute field on its three E2V 47-20 CCDs (i.e. 0.3 arcseconds/pixel). Incident light is first collimated and then split into three different beams using a pair of dichroic beamsplitters. For the observations presented here, one beam was dedicated to the SDSS filter, another to the SDSS filter and the third to the SDSS filter. Because ULTRACAM employs frame-transfer chips, the dead-time between exposures is negligible: we used ULTRACAM in its highest-speed drift mode, with 2 windows each of pixels and binning, resulting in an exposure time of 18.1 milliseconds and a dead-time of 1.4 milliseconds. A total of 97 100 consecutive frames of J1819–1458 were obtained from 06:07–06:38 UTC on 2006 March 11, with each frame time-stamped to a relative accuracy of better than 50 s using a dedicated GPS system. The data were obtained in photometric conditions, with no moon and -band seeing of arcseconds.
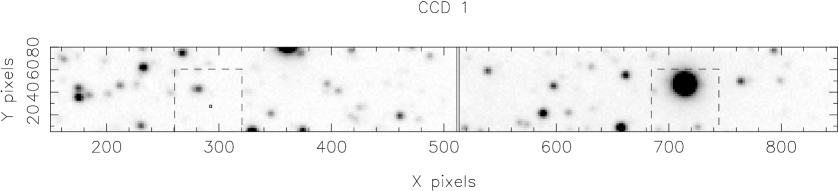

Figure 1 shows part of an ULTRACAM -band acquisition image of the field of J1819–1458 with the 2 drift-mode windows and X-ray position marked. The data were reduced using the ULTRACAM pipeline data reduction system. In order to perform aperture photometry, we had to determine the pixel position of J1819–1458 on the ULTRACAM detectors. This was achieved by offsetting from the star at pixel position (282, 44) in figure 1, which we identified as 2MASS 18193423–1457589 (: 18 19 34.23, : –14 57 59.0), to the X-ray position of J1819–1458 given by Reynolds et al. (2006). Given the uncertainty in the 2MASS position (0.1 arcseconds), the Chandra position (0.5 arcseconds) and the plate scale (0.01 arcseconds/pixel), we estimate that the resulting error in the location of J1819–1458 on the ULTRACAM detectors is arcseconds. Due to this uncertainty, we extracted light curves using a series of software apertures centred on the X-ray position of J1819–1458, with radii ranging from 0.9 to 5.4 arcseconds and with the sky level determined from an annulus surrounding the largest aperture.
3 Results
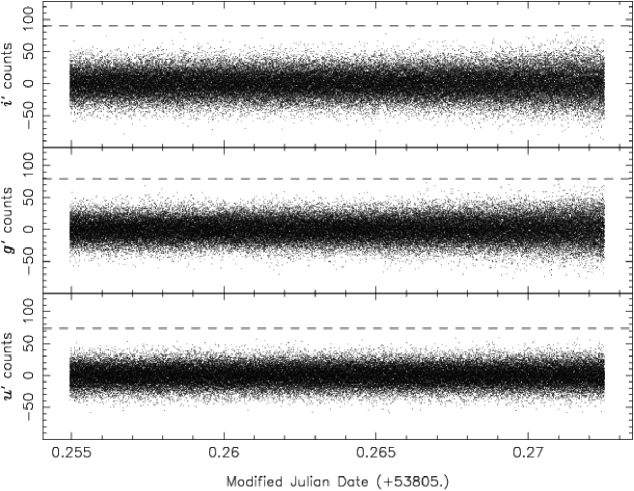
Figure 2 shows the , and light curves of the field around J1819–1458 for an aperture radius of 1.8 arcseconds. The signature of an optical counterpart to the radio bursts detected by McLaughlin et al. (2006) would be a series of deviant points lying greater than, say333We have chosen 5 as we have data points and only one point in would be expected to be greater than 5 from the mean in a Gaussian distribution., 5 from the mean. Given that the exposure time is significantly longer than the radio burst duration, one would expect only one or two points per burst. Furthermore, given the mean interval between radio bursts and the length of the ULTRACAM dataset, one would expect there to be approximately 9 such deviant points in the light curve, each separated by minutes.
The dashed line in figure 2 shows the +5 deviation level. It can be seen that there are no points lying above this line. The light curves derived from larger aperture radii do show 1–2 points lying well above the +5 line, but a visual inspection of the corresponding images revealed that the events were all due to cosmic rays (as shown by their non-stellar profiles and the fact that they were only visible in one of the three CCD chips). The implication is that we have not detected any evidence for optical counterparts to the radio bursts from J1819–1458.
| Aperture radius | Limiting magnitude (5) | ||
|---|---|---|---|
| (arcseconds) | |||
| 0.9 | 16.0 | 18.3 | 17.5 |
| 1.8 | 15.1 | 17.4 | 16.6 |
| 2.7 | 14.6 | 16.8 | 16.0 |
| 3.6 | 14.1 | 16.4 | 15.6 |
| 4.5 | 13.7 | 16.0 | 15.2 |
| 5.4 | 13.4 | 15.6 | 14.8 |
Although a negative result, it is useful to place a magnitude limit on the optical bursts from J1819–1458 in order to inform future optical studies of RRATs. The magnitude limits are shown in table 1 and can be seen to depend on the aperture radius used for the extraction, as a burst has to be brighter to be visible at the 5 level in a larger aperture due to the larger number of pixels in the aperture and hence the increased noise from the sky and detector. A reasonable choice of aperture would be 1.8 arcseconds, as this corresponds to 3 from the expected position of J1819–1458 (see section 2). In this case, we are able to say that J1819–1458 shows no evidence for optical bursts brighter than 15.1, 17.4 and 16.6 in , and , respectively. This corresponds to , and magnitudes of 15.4, 17.9 and 16.1, respectively, where we have used the conversion equations of Smith et al. (2002) and assumed .
The corresponding flux limits are , 0.4 and 0.8 mJy in , and , respectively, calculated using equation 2 of Fukugita et al. (1996). It is not straightforward to assign a wavelength to each of these fluxes, as the effective wavelengths of the SDSS filters can be defined in a number of ways (see Fukugita et al. 1996) and depend on a number of parameters, including the throughput of the optics, the detector quantum efficiencies, the atmospheric extinction and the spectrum of the star. Moreover, there is a systematic uncertainty in the conversion of SDSS magnitude to flux of 5–10% (Smith et al., 2002). We calculate effective wavelengths for the , and fluxes quoted above of 3560Å, 4820Å and 7610Å, respectively, assuming a flat spectral source.
Taking our most sensitive flux limit of mJy at ( Hz), we can compare this to the radio flux of 3600 mJy at Hz measured by McLaughlin et al. (2006) to deduce that the spectral slope must be steeper than . For comparison, the radio-to-optical slope of the Crab pulsar is (Lyne & Graham-Smith, 2005), but it is not straightforward to interpret such coarse spectral energy distributions because the optical and radio photons have very different origins (the optical is incoherent emission from the outer gap, the radio is coherent emission from both the polar cap and the outer gap – see Lyne & Graham-Smith (2005) and references therein).
It should be noted that the dead-time of ULTRACAM during our J1819–1458 observations was less than half the duration of the radio bursts observed by McLaughlin et al. (2006). This makes it unlikely we missed a single optical burst whilst ULTRACAM was reading out, let alone the expected 9 bursts. Moreover, if the emission mechanisms in J1819–1458 are similar to those of the Crab pulsar, in which the optical pulse is known to be approximately 5 times wider than the radio pulse (Shearer et al., 2003), it makes it even more unlikely that our non-detection of optical pulses is due to the dead-time of ULTRACAM.
4 Discussion
We find no evidence for optical analogues to the radio bursts seen in the Rotating Radio Transient J1819–1458. Using a frame rate of Hz, ULTRACAM has enabled us to place 5 limits on the burst magnitudes of 15.1, 17.4 and 16.6 in , and , respectively. In comparison with the AXP 4U 0142+61, for example, which has magnitudes of , and (Dhillon et al., 2005), our limits on J1819–1458 do not appear to be particularly deep. To place our limits in some context, therefore, it should be noted that if we had taken a single 1 hour exposure of the field with the WHT under identical conditions, and assuming the object emitted 18 bursts, each of and 18.1 milliseconds duration, we would have detected the object at only . Using the high-speed photometry technique described in this paper, on the other hand, we would have detected the source at 5. The difference in sensitivity between the two techniques is due to the fact that the long exposures would be sky limited, whereas the data presented in this paper are readout-noise limited.
Due to the nature of the bursts in RRATs, therefore, the only way we can significantly improve on the magnitude limits is to observe at higher frame rates (in order to reduce the small contribution of sky noise still further) and/or use a larger aperture telescope (in order to increase the number of counts detected from each burst). The discussion above assumes, of course, that the optical and radio light behave in a similar manner. If, however, the optical light has only a low (or no) pulsed fraction, then deep, long-exposure imaging might prove fruitful, as might searches for pulsed light on the proposed spin period of the neutron star (e.g. Dhillon et al. 2005).
Acknowledgments
TRM acknowledges the support of a PPARC Senior Research Fellowship. SPL is supported by PPARC grant PPA/G/S/2003/00058. ULTRACAM is supported by PPARC grant PP/D002370/1. The William Herschel Telescope is operated on the island of La Palma by the Isaac Newton Group in the Spanish Observatorio del Roque de los Muchachos of the Instituto de Astrofísica de Canarias. We thank the anonymous referee for comments which significantly improved the presentation of the results.
References
- Beard et al. (2002) Beard S. M., Vick A. J. A., Atkinson D., Dhillon V. S., Marsh T. R., McLay S., Stevenson M. J., Tierney C., 2002, in Lewis H., ed., Advanced Telescope and Instrumentation Control Software II. SPIE, 4848, p. 218
- Dhillon & Marsh (2001) Dhillon V. S., Marsh T. R., 2001, New Astronomy Review, 45, 91
- Dhillon et al. (2005) Dhillon V. S., Marsh T. R., Hulleman F., van Kerkwijk M. H., Shearer A., Littlefair S. P., Gavriil F. P., Kaspi V. M., 2005, MNRAS, 363, 609
- Fukugita et al. (1996) Fukugita M., Ichikawa T., Gunn J. E., Doi M., Shimasaku K., Schneider D. P., 1996, AJ, 111, 1748
- Golden et al. (2000) Golden A., Shearer A., Redfern R. M., Beskin G. M., Neizvestny S. I., Neustroev V. V., Plokhotnichenko V. L., Cullum M., 2000, A&A, 363, 617
- Haberl (2004) Haberl F., 2004, Mem. Soc. Astron. Ital., 75, 454
- Lyne & Graham-Smith (2005) Lyne A. G., Graham-Smith F., 2005, Pulsar Astronomy. Cambridge University Press, Cambridge
- McLaughlin et al. (2006) McLaughlin M. A., Lyne A. G., Lorimer D. R., Kramer M., Faulkner A. J., Manchester R. N., Cordes J. M., Camilo F., Possenti A., Stairs I. H., Hobbs G., D’Amico N., Burgay M., O’Brien J. T., 2006, Nat, 439, 817
- Press & Rybicki (1989) Press W. H., Rybicki G. B., 1989, ApJ, 338, 277
- Reynolds et al. (2006) Reynolds S. P., Borkowski K. J., Gaensler B. M., Rea N., McLaughlin M., Possenti A., Israel G., Burgay M., Camilo F., Chatterjee S., Kramer M., Lyne A., Stairs I., 2006, ApJ, 639, L71
- Shearer et al. (2003) Shearer A., Stappers B., O’Connor P., Golden A., Strom R., Redfern M., Ryan O., 2003, Sci, 301, 493
- Smith et al. (2002) Smith J. A., Tucker D. L., Kent S., Richmond M. W., Fukugita M., Ichikawa T., Ichikawa S., Jorgensen A. M., Uomoto A., Gunn J. E., Hamabe M., Watanabe M., Tolea A., Henden A., Annis J., Pier J. R., McKay T. A., Brinkmann J., Chen B., Holtzman J., Shimasaku K., York D. G., 2002, AJ, 123, 2121
- Woods & Thompson (2006) Woods P. M., Thompson C., 2006, in Lewin W. H. G., van der Klis M., eds, Compact Stellar X-ray Sources. CUP, Cambridge, in press (astro-ph/0406133)