On the maximum amplitude and coherence of the kilohertz quasi-periodic oscillations in low-mass X-ray binaries
Abstract
I study the behaviour of the maximum rms fractional amplitude, and the maximum coherence, , of the kilohertz quasi-periodic oscillations (kHz QPOs) in a dozen low-mass X-ray binaries. I find that: (i) The maximum rms amplitudes of the lower and the upper kHz QPO, and , respectively, decrease more or less exponentially with increasing luminosity of the source; (ii) the maximum coherence of the lower kHz QPO, , first increases and then decreases exponentially with luminosity, at a faster rate than both and ; (iii) the maximum coherence of the upper kHz QPO, , is more or less independent of luminosity; and (iv) and show the opposite behaviour with hardness of the source, consistent with the fact that there is a general anticorrelation between luminosity and spectral hardness in these sources. Both and in the sample of sources, and the rms amplitude and coherence of the kHz QPOs in individual sources show a similar behaviour with hardness. This similarity argues against the interpretation that the drop of coherence and rms amplitude of the lower kHz QPO at high QPO frequencies in individual sources is a signature of the innermost stable circular orbit around a neutron star. I discuss possible interpretations of these results in terms of the modulation mechanisms that may be responsible for the observed variability.
keywords:
stars: neutron — X-rays: binaries — X-rays: individual: 4U 0614+09 — X-rays: individual: 4U 1608–52 — X-rays: individual: 4U 1636–53 — X-rays: individual: 4U 1728–341 Introduction
Kilohertz quasi-periodic oscillations (kHz QPOs) in the X-ray flux of low-mass X-ray binaries have drawn much attention since their discovery, about ten years ago. The reason for this continued interest is that since they most likely reflect the motion of matter very close to the neutron star (or black hole) primary in these systems, these QPOs may provide one of the few direct ways of measuring effects that are unique to the strong gravitational-field regime in these systems. In general two simultaneous kHz QPOs are seen in the power density spectra of low-mass X-ray binaries, the lower and the upper kHz QPO according to how they appear sorted in frequency.
Most (but not all) of the work on QPOs in these years (see van der Klis, 2006, for a review) has focused on the frequencies of these QPOs, because those frequencies provide insights into the dynamics of the system. Several models have been proposed to explain the observed relation between both kHz QPO frequencies (Miller, Lamb, & Psaltis, 1998; Lamb & Miller, 2001; Stella & Vietri, 1998, 1999; Osherovich & Titarchuk, 1999; Titarchuk & Osherovich, 1999; Abramowicz et al., 2003; Rebusco, 2003), their relation with the spin of the neutron star (e.g., Miller et al., 1998; Kluźniak et al., 2004) as well as with other low-frequency variability (e.g., Stella & Vietri, 1998; Osherovich & Titarchuk, 1999; Titarchuk & Osherovich, 1999; Titarchuk et al., 2001; Titarchuk & Wood, 2001), both low-frequency QPOs and broad-band variability.
From the beginning there has been interest on the other two properties of the kHz QPOs, their amplitude and coherence (e.g., van der Klis et al., 1997; Wijnands et al., 1998a); but systematic studies of those other QPO properties started to take off slightly later on (Jonker et al., 2000, 2002; Di Salvo et al., 2001; Di Salvo, Méndez, & van der Klis, 2003; van Straaten et al., 2000, 2002; Méndez, van der Klis, & Ford, 2001; van Straaten, van der Klis, & Méndez, 2003; Homan et al., 2002; Kuznetsov, 2002; Barret et al., 2005a, b, c; Altamirano et al., 2006).
Recently, Barret et al. (2005a, b, c) carried out a systematic study of the kHz QPO coherence and rms amplitude in three X-ray binaries, 4U 1636–53, 4U 1608–52, and 4U 1735–44. They find that in all three sources the coherence and rms amplitude of the lower kHz QPO increase slowly with frequency, and after they reach their maximum values they decrease abruptly as the QPO frequency keeps on increasing. (The sudden drop is most noticeable in the coherence of the lower kHz QPO; in the case of the rms amplitude the drop is less abrupt.) They propose that this behaviour is due to effects related to the innermost stable circular orbit, ISCO, around the neutron star in these systems.
Triggered by these results, in this paper I investigate the dependence of the maximum coherence and rms amplitude of both kHz QPOs in a large sample of low-mass X-ray binaries. In §2 I describe the data I use in the rest of the paper. Since I collected most of the data from the literature, I spend some time describing how those data were obtained and the selection criteria. In §3 I present the results, and I discuss them in §4.
2 Data selection and analysis
2.1 Data selection
All the data that I use in this paper were obtained over the last 10 years with the Proportional Counting Array, (PCA; Jahoda et al., 1996), on board the Rossi X-ray Timing Explorer (RXTE; Bradt, Rothschild, & Swank, 1993).
I collected most of these data from the literature. For this I searched, for as many sources as possible, all published values of the rms fractional amplitude and the coherence of the kHz QPOs. The coherence of a QPO is defined as , where and are the frequency and the full-width at half-maximum of the QPO. Some authors report and instead of ; in those cases I calculate using the previous formula. The rms amplitude, , is calculated from , the integral from to of the Fourier power under the QPO, and the source intensity, , as (van der Klis, 1995); from this definition, is expressed as a percent of the total intensity of the source.
From now on I will use the naming convention of the kHz QPOs introduced by Belloni, Psaltis, & van der Klis (2002), in which the lower kHz QPO is called , and the upper kHz QPO is called . The frequency, coherence and amplitude of each QPO carry a subscript or superscript or , respectively. A clarification is needed about what I call kHz QPO in this paper. Some authors (e.g., Psaltis et al., 1999) identify low-frequency features as possibly being on the basis of an extension of the QPO frequency-frequency correlation, , to low frequencies (below Hz). It remains still uncertain whether these identifications are correct (cf van Straaten et al., 2003, 2005). In this paper I use the expression “kilohertz QPO” to refer to features in the power spectra of neutron star systems that have frequencies Hz, and that have not been identified as hectohertz QPO (e.g., van Straaten et al., 2000).
Since the goal is to compare the maximum values of and of each kHz QPO in different sources, one of the requirements in collecting the data is that there are sufficient measurements of both parameters to have confidence that the maximum values have been measured. This is in part facilitated by the fact that we know the general dependence of and on QPO frequency for both QPOs. For instance, van Straaten et al. (2000, 2002); van Straaten et al. (2003), Di Salvo et al. (2001); Di Salvo et al. (2003), Méndez et al. (2001), Barret et al. (2005a, b), and Altamirano et al. (2006) show that both and increase with , they peak at intermediate to high values of , and then they decrease as increases (see e.g., Figure 3 in Di Salvo et al., 2001, and Figure 3 in Barret et al. 2005b). On the other hand, is more or less flat at low values of where it peaks, and then decreases as increases, while is more or less constant with , although it increases towards higher values (see e.g., Figure 3 in Di Salvo et al., 2001, and Figure 10 in Altamirano et al. 2006). For this reason, here I compile data from papers that present systematic studies of the QPO properties, or that have enough measurements to deduce the systematic trends of those properties. I do not use result from papers reporting the discovery of kHz QPOs in a source, in which only one or two measurements of the QPO properties are available.
| Source | Ref | ||||||
|---|---|---|---|---|---|---|---|
| (Hz) | (%) | (Hz) | |||||
| 4U 0614+09 | 730 | 610 | 1,2,3,4 | ||||
| 4U 1608–52 | 830 | 670 | 4,5,6,7,8 | ||||
| 4U 1636–53 | 840 | 780 | 4,9,10,11 | ||||
| 4U 1728–34 | 900 | 760 | 4,5,7,12 | ||||
| 4U 1735–44 | 770 | 740 | 4,13,14 | ||||
| 4U 1820–30 | 700 | 600 | 4,5 | ||||
| Aql X-1 | 850 | 760 | 4,5,7 | ||||
| GX 5-1 | 620 | 160 | 4,15 | ||||
| GX 17+2 | 750 | 650 | 4,16 | ||||
| GX 340+0 | 500 | 350 | 4,17 | ||||
| Cyg X-2 | … | … | … | 520 | 4,18 | ||
| Sco X-1 | 780 | 590 | 4,19 |
NOTES — The - errors are given. An aribtrary 25% error is used for the luminosity (see text)
for 4U 0614+09 has been measured in the keV energy range.
The parameters for GX 340+0 and Cyg X-2 have been measured in the keV energy range.
The parameters for GX 17+2 have been measured in the keV energy range.
The parameters for Sco X-1 have been measured over a variable energy range (see text).
All the other parameters have been measured in the full PCA band.
REFERENCES — (1) van Straaten et al. (2000); (2) van Straaten et al. (2002); (3) Ford et al. (1997); (4) Ford et al. (2000); (5) This paper; (6) Barret et al. (2005a); (7) Méndez et al. (2001); (8) van Straaten et al. (2003); (9) Di Salvo et al. (2003); (10) Barret et al. (2005b); (11) Barret et al. (2005c); (12) Di Salvo et al. (2001); (13) Barret et al. (2005c); (14) Ford et al. (1998); (15) Jonker et al. (2002); (16) Homan et al. (2002); (17) Jonker et al. (2000); (18) Wijnands et al. (1998a); (19) van der Klis et al. (1997)
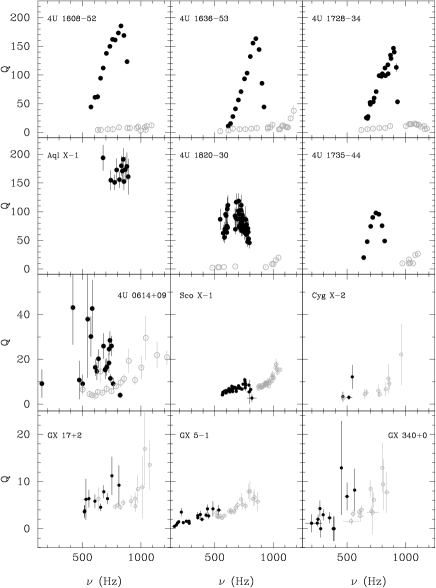
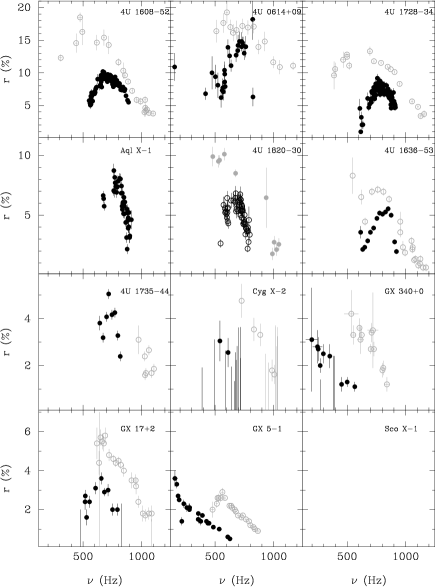
In Figure 1 and Figure 2 I present the plots of and vs. QPO frequency for all the sources described in this paper: 4U 1608–52 (Barret et al., 2005a), 4U 1636–52 (Barret et al., 2005b), 4U 1728–34 (Barret et al., 2006), Aql X-1 (Méndez et al., 2001) 4U 1820–30 (Barret et al., 2006), 4U 1735–34 (Barret et al., 2006), 4U 0614+09 (van Straaten et al., 2000), Sco X-1 (van der Klis et al., 1997), Cyg X-2 (Wijnands et al., 1998a; Kuznetsov, 2002), GX 17+2 (Homan et al., 2002), GX 5-1 (Jonker et al., 2002), and GX 340+0 (Jonker et al., 2000). As it is apparent from this figure, in most cases , , and have well-defined maxima that occur at QPO frequencies in between the minimum and maximum frequency observed for each QPO in each source. For three sources (GX 17+2, GX 5-1, and GX 340+0), however, the maximum value of occurs at the edge of the frequency range. Similarly, for two sources (GX 5-1 and GX 340+0), the maximum value of , and for three sources (4U 1820–30, Cyg X-2, and GX 340+0) the maximum value of occurs at the edge of the frequency range. For , it is more often the case that the maximum observed value occurs at the edge of the frequency range (five out of eleven sources). While it may still be possible that in these cases the maximum value of or has not yet been observed, on the basis of the slopes of the relations of and with in Figure 1 and 2, it seems very unlikely that the (unseen) maxima are too different from the largest values so far measured. Except the case of in GX 5-1, for which the maximum value might still be somewhat larger than the largest value so far observed, for the other sources and appear to level off at the edge of the frequency range. Based on this, I estimate that in those cases the maximum value can be at most % higher than the value I use in this paper; this potential difference has no effect on the conclusions of the paper. Notice also that since the significance at which a QPO is detected is proportional to (van der Klis, 1989), if or were significantly larger than so far observed, QPOs would have most likely been detected above (below) the current maximum (minimum) frequencies.
| Source | Ref | ||||||
| (Hz) | (%) | (Hz) | |||||
| 4U 0614+09 | 1270 | 510 | 1,2,3,4 | ||||
| 4U 1608–52 | 1060 | 475 | 4,5,6,7,8,9 | ||||
| 4U 1636–53 | 1230 | 530 | 4,5,10,11,12 | ||||
| 4U 1728–34 | 1140 | 600 | 2,4,6,13 | ||||
| 4U 1735–44 | … | … | … | … | … | … | … |
| 4U 1820–30 | 1050 | 580 | 4,5,14,15 | ||||
| Aql X-1 | … | … | … | … | … | … | … |
| GX 5-1 | 850 | 560 | 4,16 | ||||
| GX 17+2 | 1010 | 590 | 4,17 | ||||
| GX 340+0 | 850 | 530 | 4,18 | ||||
| Cyg X-2 | 960 | 860 | 4,19,20 | ||||
| Sco X-1 | 1040 | 875 | 4,21 |
NOTES — The - errors are given. An aribtrary 25% error is used for the luminosity (see text)
The parameters for GX 340+0 and Cyg X-2 have been measured in the keV energy range.
The parameters for GX 17+2 have been measured in the keV energy range.
The parameters for Sco X-1 have been measured over a variable energy range (see text).
All the other parameters have been measured in the full PCA band.
REFERENCES — (1) van Straaten et al. (2000); (2) van Straaten et al. (2002); (3) Ford et al. (1997); (4) Ford et al. (2000); (5) This paper; (6) Méndez et al. (2001); (7) Barret et al. (2005a); (8) van Straaten et al. (2003); (9) Gierliński & Done (2002); (10) Di Salvo et al. (2003); (11) Barret et al. (2005b); (12) Altamirano et al. (2006); (13) Di Salvo et al. (2001); (14) Altamirano et al. (2005); (15) Bloser et al. (2000); (16) Jonker et al. (2002); (17) Homan et al. (2002); (18) Jonker et al. (2000); (19) Kuznetsov (2002); (20) Wijnands et al. (1998a); (21) van der Klis et al. (1997)
A word must be said about the different ways in which and are measured in these sources, and how these different ways of measuring them can affect their values:
-
1.
The first QPO measurements were obtained over continuous RXTE observations, usually stretches of up to -s exposure time interrupted by the occultation of the source below the Earth’s horizon, or by the passage of the satellite by the South Atlantic Anomaly, when many instruments were switched off for safety reasons. Because the QPO frequency typically changes by a few tens of Hz within a thousand seconds (Berger et al., 1996), the QPOs appear broader than they actually are in the average power spectra of those observations. Since the width measured in the average power spectrum, , when a QPO of intrinsic width drifts by an amount is roughly , clearly intrinsically narrower peaks are more affected by the QPO frequency drift than intrinsically broader peaks. Because in general is narrower than , the width of is the most affected. On the other hand, since the total power in the QPO is conserved in the averaging process, the rms amplitudes of the QPOs are less affected by the QPO frequency drift. (Actually, the drift changes the shape of the QPO in the average power spectrum, and because the function used to fit them, usually a Lorentzian, no longer represents them properly, also the rms amplitudes are affected, although to a lesser degree).
-
2.
When more data per source were collected, and it was realised that the QPO frequencies depended on other source parameters, it became clear that a much better way of studying the QPO properties was to average data taken at different epochs but having similar range of values of those other source parameters. The typical examples are data selection based on the colours of the source, or more specifically the position along the track traced out by the source in a colour-colour or colour-intensity diagram (e.g., Jonker et al., 2000; Homan et al., 2002; van Straaten et al., 2000, 2002; Di Salvo et al., 2001; Di Salvo et al., 2003; Altamirano et al., 2005, 2006), or the frequency of one of the kHz QPO, usually (e.g., Méndez et al., 2001; Barret et al., 2005b), but sometimes also (Méndez & van der Klis, 2000), or the frequency of a low-frequency QPO (e.g., Jonker et al., 2000). While these selections tend to reduce the spurious broadening of the QPOs due to the QPO frequency drift, this effect may still be present in the results, especially when the parameter used in selection spans a large interval.
In this paper I try to use as much as possible data collected according to the second method just described, especially for the values of , and in particular for , which would be the quantity that is most affected by the averaging.
In a few cases one or more of the QPO parameters of a source are not available in the literature; in some of those cases I myself have systematically analysed an published other QPO parameters (e.g., QPO frequency) of those sources, and since I still have the data available, I analyse them myself for this paper to obtain those missing QPO parameters. I describe those cases individually, including a summary of the analysis procedures, below.
In Tables 1 and 2 I provide all the measurements of the maximum coherence, , and maximum rms amplitude, , for each QPO for each source, including the frequency of the corresponding QPO at which and occur; in those Tables I also provide references to the papers from which these values were collected.
2.2 Measurements over different energy bands
In most cases in the literature, the QPO properties reported are those measured over the full energy band of the PCA; nominally, this range is keV. In any case, the PCA instrument is not very sensitive above keV because of the lower effective area at those energies, and because the background dominates the signal. In a few cases (see Tables 1 and 2) measurements were done over a different energy band to increase the sensitivity to kHz QPOs; since the rms spectrum of the QPOs increases steeply with energy (see e.g., Berger et al., 1996), in those other cases the authors analysed the high-energy part of the data, above keV. On the other hand, the ageing of the PCA units (PCU), and changes applied to the gain voltage over the years to preserve the detectors affected the energy scale of the PCA as well as its effective area as a function of energy. The largest impact occurred at the low-energy end, since the low-energy cut-off of the detectors is a strong function of the instrument’s high-voltage; from 1996 until present the lower energy boundary of the PCA increased by due to the ageing of the instrument and the gain changes applied to it111see http://heasarc.gsfc.nasa.gov/docs/xte/e-c_table.html.
Because of the strong dependence of the rms spectrum of the QPOs on energy, it is not straightforward to compare measurements over different energy bands: The higher the low-energy boundary of the band over which one measures , the higher the value of . On the other hand, measures the number of cycles of the oscillation which, at least to first order, does not depend on energy. Therefore, one expects that the values of would not be much affected by the choice of the energy band over which they are measured.
To confirm the above, and to assess the effect of the change of the energy band on the parameters, I proceed as follows: I use the data for 4U 0614+09 from van Straaten et al. (2002) who measured and of both kHz QPOs over the full PCA band ( keV, nominally), and van Straaten et al. (2000) who measured the same properties in the keV range. In both cases they report and as a function of QPO frequency, therefore I compare and in both papers at the same QPO frequency. I find that is consistent with being the same in both energy bands. On the other hand, the rms fractional amplitudes in the keV band are (- error) times higher than the rms fractional amplitudes in the full PCA band.
However, the energy spectrum of 4U 0614+09 is rather hard, and it may be that in other sources that have softer spectra, the rms amplitudes in different energy bands behave differently. To check this, I compiled rms amplitudes in the band for 5 sources: 4U 1608–52 (Méndez et al., 2001; van Straaten et al., 2003), 4U 1728–34 (Méndez & van der Klis, 1999; van Straaten et al., 2002), 4U 1636–53 (Barret et al., 2005b), 4U 0614+09 (van Straaten et al., 2000), and 4U 1820–30 (Altamirano et al., 2005; Belloni et al., 2005), and the corresponding rms amplitudes in the keV range (Jonker et al., 2001). I find that the rms fractional amplitude in both bands are very well correlated (the correlation coefficient is 0.97), and that the rms amplitude in the keV band in these sources is times larger than the rms amplitude in the keV. This number is slightly higher, but still consistent (within -) with the value obtained above for 4U 0614+09.
In summary, the above results show that: (i) One can compare directly -values in different energy bands, at least as long as the bands are not too different from each other. Because of this, in the rest of the paper I will compare values even if they come from different bands; (ii) changes of the low-end of the energy band affect the rms amplitudes by of its value or less (in the case of instrument gain changes and ageing, since changes of the low-energy boundary are smaller than those in the case of 4U 0614+09 previously discussed, the effect is probably much less important). In the next section, when I plot the QPO parameters against luminosity and against each other, I divide the rms amplitudes in the band going from to keV by to make them compatible with the rms amplitude values obtained in the full PCA band. The values quoted in Tables 1 and 2, however, are the ones actually measured and presented in the original papers, in the energy band indicated there.
2.3 Luminosity measurements
Once I have collected all and values for each QPO for each source, and the frequencies and at which those maximum values occur, I use Figure 1 in Ford et al. (2000) to get the corresponding source luminosity: Using the QPO frequency as input, I read off the luminosity of the source at that frequency from that Figure. For three sources, 4U 1608–52, 4U 1636–53, and 4U 1820–30 (see below), the maximum rms amplitudes of occur in states of the source in which the QPO frequencies are outside the range of frequencies in Figure 1 of Ford et al. (2000). In those three cases I either search the literature for flux measurements of the source in that state, or I extract spectra from the corresponding RXTE observations, and calculate the luminosities myself, or both. Below I explain those three cases in more detail.
The luminosities that I report here are uncertain for a number of reasons: First, there is a statistical error in the fluxes derived from model fitting. Given that these sources are quite bright when kHz QPOs are detected, and that RXTE has a large effective area, these errors are small, usually less than . The second source of error is the accuracy with which one can determine the luminosity using the results of Ford et al. (2000) for a given QPO frequency. This is not so much how accurately one can read from their plot, but the fact that for each source there is not a single X-ray intensity or X-ray flux value that corresponds to a given QPO frequency. This is the so-called parallel-track phenomenon (e.g., Méndez et al., 1999). In the extreme cases, the X-ray intensity of the source at a given QPO frequency may by as much as a factor of 3 different (e.g. 4U 1608–52, Méndez et al., 1999). On average, however, the range of intensities at fixed QPO frequency is smaller, of the order of (Méndez et al., 2001). The third source of error is the use of the keV flux as a measure of the bolometric flux of the source. This is discussed in detail by Ford et al. (2000), and I therefore refer the reader to that paper. This effect contributes uncertainties of the order of of the reported luminosity values. The fourth source of error, if and depended not on the luminosity of the source, , but on the luminosity of the source normalized to its own Eddington luminosity, , would be the use of a single Eddington luminosity to normalise the observed luminosities of all the sources in the sample, as done by Ford et al. (2000). Of course, if and depended on , and not on , this would be of no concern. The value used by Ford et al. (2000) is , which is the Eddington luminosity for a neutron star accreting matter with cosmic abundance. Since all these systems are thought to have had a common evolutionary path, and to have accreted between and , the use of a single Eddington luminosity introduces an uncertainty that is of the order of or less. (Notice that changes of the chemical composition of the accreting material may introduce a difference of up to a factor of 1.7 in the value of the Eddington luminosity; in the unlikely case that the neutron stars in this sample had different equations of state, the different redshifts at the surface of the neutron star may add an extra factor 1.5.) Finally, the largest uncertainty in the luminosity comes from the error in the estimate of the distance to these sources (see Ford et al., 2000, for a discussion in the context of these sources); this uncertainty can introduce errors of up to 60% in the luminosity (see, e.g., Christian & Swank, 1997). It should be mentioned that for GX340+0 and GX 5-1, Christian & Swank (1997) only give upper limits to their distances, hence for those two sources the luminosities in Ford et al. (2000) should be taken as upper limits.
2.4 Individual sources
I now add a few remarks about special situations of some of the data for sources I include in this paper:
-


Figure 3: Left panel: The maximum coherence (upper panel) and maximum rms amplitude (lower panel) of the lower kHz QPO for the sources listed in Table 1, as a function of the source luminosity at the time at which those maximum values were reached. The luminosity is in units of the Eddington luminosity for a neutron star. Filled circles indicate measurements over the full energy band covered by the PCA on board RXTE. Open circles indicate measurements over a limited energy band (see Table 1 for details); in these cases (except for Sco X-1), the rms amplitudes have been divided by 1.25 (see text for details). The rms amplitude in the case of Sco X-1 is not corrected for dead-time, and hence is only a lower limit (indicated with an arrow pointing upwards in the lower panel). Right panel: The maximum coherence (upper panel) and maximum rms amplitude (lower panel) of the upper kHz QPO for the sources listed in Table 2, as a function of the source luminosity at the time at which those maximum values were reached. The luminosity is in units of the Eddington luminosity for a neutron star. Symbols are the same as in the left panel. -
4U 1608–52
: To measure , I use the same data in Méndez et al. (2001). I accumulate power density spectra every 64 seconds of data up to a Nyquist frequency of 2048 Hz; I average a variable number of consecutive power spectra, in all cases less than 15, in order to obtain significant QPO detections, and I search for high-frequency ( 250 Hz) peaks. If I detect two QPO peaks, the one with the lowest frequency is ; if I only detect one peak, I decide whether it is or on the basis of the the rms-frequency relation (e.g., Méndez et al., 2001). If it is I discard it, if it is I measure .
Individual measurements have relatively large errors. Since is a function , I then sort the results on the basis of , and I calculate average values over a narrow range of . As usual, this procedure reduces the errors in at the expense of slightly underestimating its maximum value.
I do not use the results of Barret et al. (2005a) because in that case they calculate using whole observations; although they shift the individual power spectra of each observation (Méndez et al., 1998a, see below), still in many of those observations the frequency of the QPO drifts by several tens of Hz, which has a negative effect in the determination of . Nevertheless, I find a value that is larger than, but still consistent with, the value in Barret et al. (2005a).
For this source, comes from van Straaten et al. (2003); they find this rms amplitude at a QPO frequency (see Table 2) that is outside the frequency range in Ford et al. (2000), and hence no simultaneous luminosity measurement is available in Ford et al. (2000). Van Straaten (2003) measured this rms amplitude during their interval C; this corresponds to regions 1 and 2 in Gierliński & Done (2002), who find that the bolometric flux of the source in those regions is . Interval C of van Straaten et al. (2003) corresponds to the RXTE ObsId 30062-01-01-05. I therefore downloaded those data from the RXTE archive, I produce a light curve of this observation and find that there are no X-ray bursts or any anomaly in the data; I then extract an X-ray spectrum using the Standard2 data following the procedures described on the RXTE web pages222http://heasarc.gsfc.nasa.gov/docs/xte. I fit this spectrum with a model consisting of a blackbody and a power law plus a Gaussian emission line at around 6.5 keV, all affected by interstellar absorption. The model fits the data well, with a per degree of freedom of about 1. The keV unabsorbed flux of the source in this observation is , consistent with the flux of Gierliński & Done (2002). Using the same distance to this source as in Ford et al. (2000), Kpc, this flux corresponds to a luminosity , or using the Eddington luminosity used by Ford et al. (2000), .
-
4U 1636–53:
To measure , I use the same data presented in Di Salvo et al. (2003). The procedure to produce power spectra, identify the QPOs, and measure is the same as the one described for 4U 1608–52. The value of that I find is slightly higher than, but still consistent with, the one found by Barret et al. (2005b).
For this source, comes from Altamirano et al. (2006); they find this rms amplitude at a QPO frequency (see Table 2) that, as in the case of 4U 1608–52, is outside the frequency range in Ford et al. (2000), and hence no simultaneous luminosity measurement is available in Ford et al. (2000). Altamirano et al. (2006) find this rms amplitude value during their interval C, which corresponds to the RXTE ObsId 60032-05-10-000 and 90409-01-01-02. I produce a light curve of these observations and find that there is an X-ray burst in the first one, and no X-ray bursts or any anomaly in the data of the second one; I then follow the procedures described on the RXTE web pages to extract an X-ray spectrum from the Standard2 data of the second observation. I fit this spectrum with a model consisting of a blackbody and a power law plus a Gaussian emission line at around 6.5 keV, all affected by interstellar absorption. The model fits the data well, with a per degree of freedom of about 1. The keV unabsorbed flux of the source in this observation is . Using the same distance to this source as in Ford et al. (2000), Kpc, this flux corresponds to a luminosity , or using the Eddington luminosity used by Ford et al. (2000), .
-
4U 1820–30:
To measure and , I use the same data as in Méndez (2002) and Belloni et al. (2005). The procedure to produce power spectra, isolate , and measure is the same as the one described for 4U 1608–52 and 4U 1636–53. To detect and measure , I proceed as follows: I group the power spectra on the basis of the frequency of , , such that within each group does not change by more than 50 Hz. I then shift the power spectra such that in each group the frequency of is the same in all power spectra, and then I calculate an average power spectrum per group. This procedure eliminates the effect of the drift in , and since the frequency difference in this source is more or less constant when changes (Zhang et al., 1998a), it also corrects the effect of the drift in . I then fit the power spectra with two Lorentzians that represent the QPOs, and a constant that represents the Poisson counting noise. The fit yields, among other parameters, .
For this source, the value is from Altamirano et al. (2005); they find this rms amplitude at a QPO frequency (see Table 2) that, as in the case of 4U 1608–52 and 4U 1636–53, is outside the frequency range in Ford et al. (2000), and hence no simultaneous luminosity measurement is available in Ford et al. (2000). Altamirano et al. (2005) report this rms amplitude at a position in the colour-colour diagram of 4U 1820–30 that is consistent with the interval of Bloser et al. (2000). ( is a parameter that measures the position along the C-shaped track traced out by the source in a colour-colour diagram.) During their observation, Altamirano et al. (2005) find that the intensity of the source is 297 counts s-1 PCU-1, while in their observation, Bloser et al. (2000) find the source at 312 counts s-1 PCU-1. For their observation, Bloser et al. (2000) find a keV luminosity of for an assumed distance Kpc. Ford et al. (2000) use a distance to NGC 6624, the globular cluster that contains 4U 1820–30, Kpc. To be consistent with the other luminosities for this source, which were taken from Ford et al. (2000), I convert the luminosity in Bloser et al. (2000) to the one corresponding to the distance to 4U 1820–30 in Ford et al. (2000). This corresponds to , or using the Eddington luminosity used by Ford et al. (2000), .


Figure 4: The maximum coherence (upper panels) and maximum rms amplitude (lower panels) of the lower kHz QPO (left) and the upper kHz QPO (right) for the sources listed in Tables 1 and 2, as a function of the average source hardness, H1, defined as the ratio of the keV to the keV count rate, measured with HEAO-1 (Levine et al., 1984; van Paradijs & van der Klis, 1994). For an explanation of the symbols see the caption of Figure 3. The rms amplitudes in the case of Sco X-1 are not corrected for dead-time, and hence are lower limits (indicated with a vertical arrow in the lower panels). Upper limits to the hardness are indicated with horizontal arrows pointing to the left. I do not include GX 5-1 in this Figure because the HEAO-1 measurements of this source suffer contamination from a previously unknown hard X-ray source in the field (see explanation in Levine et al., 1984), most likely GRS 1758–258 (Gilfanov et al., 1993). - 4U 1728–34:
-
4U 1735–44:
For this source, Barret et al. (2005c) recently reported a systematic study of and as a function of ; I therefore use and that are reported there. There are, however, very few reports of the properties of in the literature (Wijnands et al., 1998b; Ford et al., 1998); no reliable value of or are available (see also Fig. 1). I therefore do not discuss of this source in this paper.
- Aql X-1:
-
Cyg X-2:
Since there are only three measurements of for Cyg X-2 (Fig. 1), I do not consider for this source in the rest of this paper. Also, there are only two measurements of for this source, but the upper limits (Wijnands et al., 1998a) seem to indicate that the maximum -value has been measured, and hence here I use in the analysis.
-
Sco X-1:
To avoid detector safety triggers, telemetry saturation, and to reduce the dead-time effects produced by the high count rate of Sco X-1, some observations of this source were carried out with the source slightly off-axis, with some of the five proportional counter units of the PCA switched off, recording only photons detected by the upper anode chain of the PCA, recording only photons from a limited energy range, or using a combination of these constraints (van der Klis et al., 1997; Méndez & van der Klis, 2000). Despite all these efforts, the source count rate during these observations remained high, at a level in which the dead-time of the PCA is still unknown. This means that the rms values (taken from van der Klis et al., 1997) are very uncertain, and in fact could be larger than reported. For that reason, for Sco X-1 in this paper I report the maximum rms amplitude as a lower limit.
3 Results:
Figure 3 shows the dependence of the maximum coherence and maximum rms amplitude of both kHz QPOs as a function of source luminosity in units of the Eddington luminosity for a neutron star. From this Figure it is apparent that and both decrease more or less exponentially with . For the e-folding scale is , while decreases significantly faster with than , with an e-folding scale . Using roughly the same sample of sources, Jonker et al. (2001) had already noticed that the rms amplitude of the upper kHz QPO decreases as the luminosity of the source increases.
From the same Figure, it is also apparent that at low luminosity, first increases with up to , and then it decreases exponentially, at a faster rate than , with an e-folding scale . On the other hand, does not show any significant trend with luminosity; although there is a hint that it stays constant up to , then it increases up to , and after that it decreases for increasing luminosity, statistically a fit with a function that represents that behavior is not significantly better than a fit of just a constant.
The gap in Figure 3 at separates the Atoll sources at low , and the Z sources at high (see Hasinger & van der Klis, 1989, for a definition of Atoll and Z sources). That gap would be occupied by the four intermediate-type sources, GX 9+1, GX 9+9, GX 3+1, and GX 13+1, which so far have not shown any kHz QPOs (Strohmayer, 1998; Wijnands, van der Klis & van Paradijs, Wijnands et al.1998c; Homan et al., 1998; Schnerr et al., 2003; Oosterbroek et al., 2001). The upper limit to the rms amplitude of the QPO in these sources ranges from 1.6% to 2.6%. Since the range of luminosities spanned by these sources (Christian & Swank, 1997) is , these upper limits are much lower than would be expected from the interpolation of the trends of and with in Figure 3.
From Figure 3 it is apparent that the maximum rms amplitude of both kHz QPOs and the maximum coherence of the lower kHz QPO are consistently lower in the Z sources than in the Atoll sources. A valid question would then be whether this difference could be due to a bias in the way in which the QPOs of Z and Atoll sources are measured, combined with the frequency drift of the QPOs (see §2.1). A comparison, however, of the width of the lower kHz QPO over a short time interval in a Z and an Atoll source shows that this is not the case (as I describe in §2, the rms amplitudes are less affected by the frequency drift). To see this, I compare an RXTE observation of the Z source Sco X-1 from May 25 1996 (see van der Klis et al., 1997; Méndez & van der Klis, 2000), and another RXTE observation of the atoll source 4U 1608–52 from March 26 1998 (see Méndez et al., 1999). In the Sco X-1 observation the power spectrum shows two simultaneous kHz QPOs that move in frequency; moves from Hz to Hz, and moves from Hz to Hz. In the observation of 4U 1608–52 the power spectrum also shows two simultaneous kHz QPOs that move in frequency. In this case moves from Hz to Hz, and moves from Hz to Hz. To compare the QPOs in both observations over the same frequency range, I calculate an average power spectrum of the Sco X-1 data using only intervals in which Hz; this corresponds to 24 individual power spectra each of them 16-s long. In the case of 4U 1608–52 I calculate an average power spectrum of the whole observation, corresponding to 41 individual power spectra each of them 64-s long. To correct for any residual drift in the QPO frequency, I apply the shift-and-add procedure described in Méndez et al. (1998a). The results, however, do not change significantly if I average the individual power spectra without first applying this method, most likely because the frequency drift is small in both cases. From the above power spectra I find that for Sco X-1 , whereas for 4U 1608–52 , which shows that in the Z source Sco X-1, even over very short time intervals (in this case 384 s), the lower kHz QPO is significantly broader than in the Atoll source 4U 1608–52. This in turn shows that the drop of the maximum QPO coherence of the lower kHz QPOs at high luminosities in Figure 3 is real.
Table 1 shows that in all sources the maximum coherence factor of the lower kHz QPO, , occurs more or less at the same frequency (the spread is ); Table 2 shows that the same is true for the maximum coherence factor of the upper kHz QPO, (the spread in this case is ). Since the lifetime of an oscillation of frequency and coherence factor is roughly , the results described above also indicate that the maximum lifetime of , , first increases and then decreases with , whereas the maximum lifetime of , , is independent of .

Van Paradijs & van der Klis (1994) have shown that there is a general correlation between the average source luminosity and the average source hardness, H1, defined as the ratio of the count rate in the keV band to the count rate in the keV band, measured with HEAO-1 (see Levine et al., 1984). In that respect, as expected, the plots of and vs. hardness in Figure 4 show that and both increase with the hardness ratio H1, increases with H1 and then it decreases for 4U 0614+09, the hardest source in this sample, and as in the plots as a function of luminosity, is consistent with being constant with H1. At the risk of pointing out something obvious, the opposite behaviour of the coherence and amplitude of the QPOs to that in Figure 3 is due to the anticorrelation between H1 and . I caution the reader that contrary to the values that I present in Tables 1 and 2 and I plot in Figure 3, for this Figure I use average values of the spectral hardness measured several years before the kHz QPOs were discovered. Notice that GX 340+0, for which the distance, and hence the luminosity, is uncertain (see § 2.3), appears in Figure 4 close to the other Z sources (open symbols; GX 340+0 is the point at H1 , just to the left of GX 17+2 at H1 ); since H1 is a distance-independent parameter, this suggests that the distance to GX 340+0 is not too much in error.

It is interesting to notice in this Figure that there is no gap in the distribution of sources as a function of hardness between the Z and Atoll sources. This is opposite to what is apparent in the plot of QPO parameters vs. luminosity, where there is a gap corresponding to the intermediate-type, the GX-sources (see above). The H1 values of the GX-sources range from 0.03 to 0.14. However, both in Figure 3 and 4 there appears to be a gap in the values of , and perhaps also and between the two types of sources (see also below).
Figure 5 shows the relation between and for the same QPO. To produce this Figure (and the next one), I plot the vs. the values for the same source, even if they occur at slightly different luminosities. I also produced plots of vs. combining values for sources that are closest in luminosity, even if this means combining values from different sources, but the trends described below remain the same as with the previous choice.
Except for the case of 4U 0614+09, and are positively correlated with each other. Concerning 4U 0614+09, the hardest source in the sample and the one at the lowest luminosity, it is as if in this case were too low for , or conversely, as if were too high for . This is already apparent in Figure 3, where of 4U 0614+09 (low luminosity part of the plots) looses coherence without a similar decrease of its rms amplitude. Figure 5 also shows that is independent of .
Let us examine the case of the low value in 4U 0614+09 to check whether it is real: The measurements of in this source come from van Straaten et al. (2000), and are made over a different energy band than those of the other sources. For 4U 0614+09 van Straaten et al. (2000) use a band that starts at keV, whereas for other sources at slightly higher luminosity the values are measured using the whole PCA band, nominally starting at keV (see Table 1). In §2.2 I compare measurements of as a function of (and also as a function of ) for this source over the full PCA band ( keV; van Straaten et al., 2002) and over the keV band (van Straaten et al., 2000), and I find that both sets of values are compatible with each other. This indicates that most likely the difference in between 4U 0614+09 and other sources at slightly higher luminosity is real. Recently, Barret (private communication) did a similar analysis on the data of 4U 0614+09 as he did for instance for 4U 1636–53 (Barret et al., 2005b), and he finds that in 4U 0614+09 is times smaller than in 4U 1636–53, consistent with the results in Table 1. This confirms that in 4U 0614+09 is in fact smaller than in the other sources at similar but slightly higher luminosity, and hence that the decrease of at low luminosity is real.
As I already mentioned, there appears to be a gap between the and values of the Z and Atoll sources, with the coherence showing the largest gap (Figure 3, lower panel). 4U 0614+09 appears to be the only source to (partially) break this rule, since it has a value that is intermediate between those of Z and Atoll sources. Similarly, the upper panel of Figure 3 shows a gap between the values, but not for the values, of the Z and Atoll sources. While this can indicate a dependence on luminosity (see Fig. 3) or on spectral hardness (see Fig. 4), this could also point to a difference between Z and atoll sources. It is worth noting, however, that there is still a trend of and both rms amplitudes within the atoll sources in Figure 3. Furthermore, there is a significant trend in the relations between and within the atoll sources; e.g., the relation between and (lower panel of Figure 5) is different from a constant. All this suggests that the distinction between Z and Atoll sources cannot be the (only) explanation for this difference.
The plots of and of one QPO vs. the same parameters of the other QPO are shown in Figure 6. From this Figure there are three things apparent: (i) is independent both of and (upper panels); (ii) as in the case of the plot of vs. , except for 4U 0614+09, is positively correlated with . As in the case of , it appears as in 4U 0614+09, the source with the lowest luminosity in the sample, the amplitude of , , were too high for the coherence of , , or alternatively, the coherence of , , were too low for the amplitude of , (lower left panel). Finally, (iii) the amplitudes of both kHz QPOs are positively correlated with each other, including in this case the low-luminosity source 4U 0614+09 (lower right panel).
From the lower panels of this Figure, it is also apparent that there is a gap between the values of the Z and Atoll sources, similar to the ones described above
4 Discussion

I study the maximum amplitude, , and maximum coherence, , of the kHz QPOs as a function of luminosity and hardness for a large sample of low-mass X-ray binaries. I show, for the first time, that the maximum coherence of the lower kHz QPO, , first increases up to and then decreases with luminosity, whereas the maximum coherence of the upper kHz QPO, , is independent of luminosity. I also find that the maximum rms amplitudes of both the lower and the upper kHz QPOs, and , respectively, decrease monotonically with luminosity and increase monotonically with the hardness of the source. (The dependence of on luminosity and hardness was first reported by Jonker et al., 2001).
From the above results it follows that for all sources, and are positively correlated with each other. Also, for all sources with , that is all sources in this paper except 4U 0614+09, the hardest source in the sample and the one at the lowest luminosity, is positively correlated both with and . is independent of or the maximum rms amplitude of the kHz QPOs.
Since the frequencies at which the values occur are more or less the same in all sources, and the same is true for , although the frequencies in this case are higher, the dependence of and on luminosity also reflects the dependence of the maximum lifetime of the QPOs on luminosity (and spectral hardness). Therefore, for the lower kHz QPO, the maximum QPO lifetime first increases and then decreases with luminosity. For the upper kHz QPO, the maximum QPO lifetime is independent of luminosity.
4.1 The relation between the ISCO and the drop of QPO coherence and rms amplitude
In individual sources, both and increase with and then drop rather abruptly at the high end of the range; also increases and then drops at high values, and is more or less constant or increases slightly with (e.g., Di Salvo et al., 2001; Di Salvo et al., 2003; Méndez et al., 2001; van Straaten et al., 2002; van Straaten et al., 2003; Barret et al., 2005a, b, c; Altamirano et al., 2005, 2006). In the case of 4U 1636–53, Barret et al. (2005b) interpret the sudden drop of the coherence and rms amplitude of , together with the existence of a frequency above which is not detected, as evidence of the innermost stable circular orbit, ISCO, around the neutron star in this system. In general relativity, different from the Newtonian theory of gravitation, the effective potential as a function of radial distance to the central source has a maximum. A particle in a circular orbit at that radius would be in unstable equilibrium; if perturbed, the particle would fall onto the central object. No stable orbit around the central object is possible inside the radius of the ISCO, which in the Schwarzschild case (non-rotating central object) is (Bardeen, Press, & Teukolsky, 1972).
From the results of individual sources (see references above) and those of the sample of sources that I present in this paper, it is apparent that the behaviour of the coherence and rms amplitude of the kHz QPOs as a function of the QPO frequency in individual sources is similar to the behaviour of the maximum coherence and maximum rms amplitude of the kHz QPOs as a function of luminosity in the sample of sources. Since in individual sources there is a general relation between QPO frequencies and source intensity, in the sense that at higher intensity the QPOs generally appear at higher frequencies (but remember the parallel-track effect), this raises the question of whether the same mechanism may be behind both behaviours.
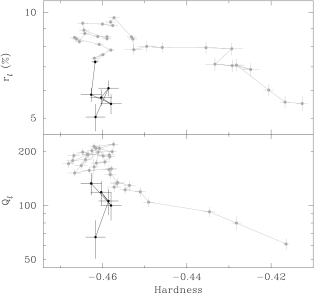
At first sight, this may appear problematic because it is known that the relation between QPO frequency and intensity in individual sources is more complex than the general frequency-luminosity trend described above, and detailed QPO frequency vs. intensity plots show the so-called parallel-track phenomenon (see e.g., Méndez et al., 1999). However, the link between these two behaviours need not be luminosity, but could be the high-energy emission (or hardness) in these systems. On one hand, in the sample of sources the maximum coherence and maximum rms amplitude of the kHz QPO, except the maximum rms amplitude of , appear to correlate fairly well with spectral hardness (see Figure 4), while on the other hand in individual sources the QPO frequencies are well correlated with the spectral hardness of the source (Méndez et al., 1999), the index of the power law that fits the high-energy part of the X-ray spectrum (Kaaret et al., 1998), or , a parameter that measures the position along the track traced out by the source in a colour-colour or colour-intensity diagram (called and in the Z and Atoll sources, respectively; see e.g., Hertz et al., 1992; Jonker et al., 2000; Méndez & van der Klis, 1999). From this, it follows that in individual sources there should be a relation between QPO rms amplitude and coherence on one hand and spectral hardness on the other. To my knowledge, a plot like that has never been published, but can be easily constructed using published results. For instance, in the case of 4U 1608–52, this can be done by combining the plots of QPO frequency vs. hardness of Figure 3 in Méndez et al. (1999) and the plots of QPO coherence and QPO rms amplitude vs. QPO frequency of Figure 2 in Barret et al. (2005c) and Figure 3 in Méndez et al. (2001), respectively. In Figure 7 I show the rms amplitude (upper panel) and coherence (lower panel) of the lower kHz QPO (left panel) and the upper kHz QPO (right panel) in 4U 1608–52 as a function of hardness. In this case the hardness is defined (see Méndez et al., 1999) as the logarithm of the ratio of the PCA count rate in the keV band to the PCA count rates in the band. (Notice that the hardness in this plot is defined over a different energy band than in the case shown in Figure 4.) The lines connecting the data points indicate the evolution of QPO frequency, which generally increases from right to left. This Figure shows the drop of the rms amplitude and coherence of the lower kHz QPO and of the rms amplitude of the upper kHz QPO at the very high end of the QPO frequency range (cf Di Salvo et al., 2001; Di Salvo et al., 2003; Méndez et al., 2001; Barret et al., 2005a, b, c)
The trend seen in Figure 7 for the coherence of the lower kHz QPO in 4U 1608–52 is rather similar to the behaviour of the maximum coherence of the lower kHz QPO for the sample of sources in Figure 4 (left panel; notice again that the hardness is defined over a different energy band in each Figure): When 4U 1608–52 is hard, to the right of Figure 7, the coherence is low, while for the hardest source in the sample, to the right of the left panel of Figure 4, the maximum coherence is also low. When 4U 1608–52 becomes softer, to the left of Figure 7, the coherence first increases, and then drops abruptly (see black points in Figure 7, lower panel), while in the sample of sources the maximum coherence behaves in a similar way. The behaviour of the rms amplitude in 4U 1608–52 and the maximum rms amplitude in the sample of sources is more or less similar, except that in the case of 4U 1608–52 when the source is hard the rms amplitude is low, increases as the source gets softer and then drops abruptly (see black points in Figure 7, upper panel), whereas in the sample of sources moving from hard to soft sources the maximum rms amplitude remains more or less constant and at the end drops. To summarize, the relevant conclusion from this comparison is this: Both the rms amplitude and coherence of the lower kHz QPO in 4U 1608–52 and the maximum rms amplitude and maximum coherence of the lower kHz QPO in the sample of sources drop abruptly when the hardness decreases.
The comparison between individual sources and the sample of sources suggests that the same mechanism is responsible for the drop of coherence and rms amplitude of the lower kHz QPO with QPO frequency in individual sources as well as for the drop of maximum QPO coherence and maximum QPO rms amplitude with luminosity in the sample of sources. The comparison between 4U 1608–52 and the sample of sources in the previous paragraph suggests that most likely the mechanism is related to the high-energy emission in these systems. This does not necessarily mean that the fractional emission at high energies (represented by the hardness or X-ray colors) is the root mechanism that drives all QPO parameters (QPO frequency, coherence, and rms amplitude). For instance, one possibility (there could be many others) is that the (instantaneous) mass accretion rate sets the size of the inner radius of the disc (van der Klis, 2001), which in turn determines the QPO frequency, as well as the relative contribution of the high-energy part of the spectrum to the total luminosity. If the efficiency of the modulation mechanism and the lifetime of the oscillations that produce the QPO depended upon the emission from the high-energy part of the source spectrum (see § 4.2 for a discussion of possible ways in which this could happen), observationally it would appear as if the coherence and rms amplitude of the QPO depended upon the QPO frequency, and hence upon the radius in the disc at which the QPO is produced. The sudden drop of the coherence and rms amplitude of the QPO at some QPO frequency would then be associated to a dynamical peculiarity in the accretion disc, for instance the ISCO. Observing the same source repeatedly would not allow to distinguish the above scenario from one in which QPO coherence and rms amplitude were actually set by QPO frequency or the dynamics in the accretion disc.
To distinguish between these two options, one would need to observe a sample of sources of kHz QPOs for which the mass-accretion rate, and hence the relative contribution of the high-energy part of the spectrum to the total emission, was different from source to source. In that case, QPO coherence and rms amplitude would drop for sources accreting mass at higher rates, even if the frequency of the QPO was more or less the same from source to source. Since, as I have shown in this paper, this is the general behaviour observed in sources of kHz QPOs, it is reasonable to infer that a mechanism similar to the one I described in the previous paragraph is effective in setting the coherence and rms amplitude of the kHz QPOs. If this is correct, this also implies that the drop of QPO coherence and rms amplitude as a function of QPO frequency in individual sources cannot be due to effects of the ISCO.
Note also that in individual sources not just the rms amplitude of the kHz QPOs, but also the rms amplitude of other lower-frequency QPOs decrease with increasing QPO frequency. For instance, in four Atoll sources, 4U 1728–34, 4U 1608–52, 4U 0614+09, and 4U 1636–53, the rms amplitudes of the “bump”, a QPO at Hz, the “hump”, a QPO at , and the hectohertz QPO at Hz, all drop as the frequencies of the kHz QPOs increase, in a similar fashion as the amplitude of the upper and lower kHz QPOs (e.g., Altamirano et al., 2006, and references therein; see also there a description of these other QPOs). This also argues against the interpretation of the ISCO as the cause of the drop of the rms of the kHz QPOs, and indicates that the amplitudes of all variability components are set by the same mechanism which, as I suggested, could be the same one that governs the high-energy spectral component.
The idea that the rms amplitude and coherence of the QPOs depend on the high-energy emission, and not on QPO frequency, can in principle be tested; for instance, if one of the kHz QPO sources showed a sudden change in the high-energy part of the spectrum, but the change of QPO frequency was less sudden. This could for example occur if the component that sets the high-energy emission in the spectrum of these sources and the one that sets the QPO frequency had different responses to changes of the mass accretion rate. This scenario is similar to the one proposed by van der Klis (2001) to explain the parallel tracks in the frequency vs. intensity plots of these sources. If this was the case, one would observe a kHz QPO that had a coherence and rms amplitude that would not match those expected on the basis of the and relations in, e.g., Barret et al. (2005a, b, c). I would like to point out that Figure 1 in Barret et al. (2006) appears to show an effect like this: Individual measurements of the coherence of the lower kHz QPO at the same QPO frequency differ significantly from one another. E.g., in 4U 1636–53 at Hz, ranges from to . This difference, however, may still be due to uncorrected drifts of the QPO frequency during the intervals in which Barret et al. (2006) measured the coherence of the QPO, although according to their description they had taken this into account in producing their Figure.
4.2 The modulation mechanism and the lifetime of the kHz QPOs
How can the mechanism that produces the high-energy emission in these systems change the coherence and rms amplitude of the kHz QPOs? There is general agreement that the oscillation mechanism that produces the quasi-periodic variability must be in the disk (see the references to theoretical models in §1); it is very easy to come up with characteristic dynamical frequencies in the disk that match the observed frequencies of the kHz QPOs, whereas it appears more difficult to have a “clock” somewhere else in the accretion flow. Nevertheless, from the early observations it became clear that emission from the disk alone cannot explain the rms amplitudes of the kHz QPOs, since in some cases the modulated luminosity in the QPOs is of the total emission, whereas at the same time the emission of the disk is or less. Furthermore, the steep increase of the rms amplitude with energy imply a large modulation of the emitted flux, up to at keV (see e.g., Berger et al., 1996), at energies where the contribution of the disk is negligible. Hence, while the oscillation mechanism probably takes place in the disk, most likely the modulation mechanism is associated to the high-energy spectral component in these sources.
The high-energy part of the X-ray spectrum of low-mass X-ray binaries can be described in terms of thermal Comptonization (Sunyaev & Titarchuk, 1980; White, Stella & Parmar, 1988). In low-luminosity Atoll sources (Hasinger & van der Klis, 1989), the hard spectral changes are explained as due to changes of the properties of this component as the average mass-accretion rate, , changes. For instance, for 4U 1608–52, Gierliński & Done (2002) find that at low inferred , the Comptonizing component has a relatively high temperature, keV, and is optically thin, . The high-energy part of the spectrum resembles a rather flat power law (power-law index ), with a high-energy cut-off above keV (Zhang et al., 1996). At high inferred , Gierliński & Done (2002) find that the Comptonizing component becomes cooler, with keV and the optical depth increases, . The high-energy part of the spectrum resembles a power law that is steeper (power-law index ) with a high-energy cut-off that is at lower energies than in the low case. In the case of high-luminosity Z-sources (Hasinger & van der Klis, 1989), the Comptonizing component is relatively cool and optically thick as in the case of the low-luminosity Atoll sources at high (Christian & Swank, 1997).
Using a simple time-dependent Comptonization model, Lee & Miller (1998) calculated the spectrum of variability that would be produced by oscillations in the (i) injection rate of seed photons, (ii) density, and (iii) temperature of the Comptonizing medium (see also Stollman et al., 1987). They find that to reproduce the rms spectrum of the lower kHz QPO in 4U 1608–52, the variability must be mostly driven by an oscillation of the density of the Comptonizing medium. They also find that in the case of variations of the density of the Comptonizing medium, the largest rms variability in the keV range occurs as the optical depth of the medium is smallest (see their Figure 4, panel b).
If the high-energy emission is due to Comptonization, the results of Lee & Miller (1998), together with the global correlation between luminosity and spectral hardness (van Paradijs & van der Klis, 1994), provide a possible explanation, at least qualitative, of the dependence of the rms amplitude of the kHz QPOs on luminosity and hardness. At low luminosity, corresponding to low mass accretion rate and hard spectra, the Comptonizing plasma is optically thin, and hence the amplitude of the variability is high. When mass accretion rate increases, the luminosity increases and the source becomes softer, and since the optical depth of the Comptonizing plasma increases, the amplitude of the variability decreases. This would explain both the drop in rms amplitude of the kHz QPOs at high QPO frequency in individual sources, and that of the maximum rms amplitude in the sample of sources at high luminosity (low hardness). In individual sources, the rms amplitude of the kHz QPOs also decreases at low frequencies, which is more difficult to explain in this simplified scenario. Also, in this scenario there is no straightforward explanation of the drop of the coherence of the lower kHz QPO at high frequencies in individual sources, and at high luminosities in the sample of sources.
Gilfanov, Revnivtsev, & Molkov (2003) have analyzed the rms energy spectra as a function of frequency of two low-mass X-ray binaries, the Z source GX 340+0 and the Atoll source 4U 1608–52. They find that the variability, including that in the frequency range of the kHz QPOs, is primarily due to variations of the luminosity of the boundary layer, with the emission of the accretion disk being much less variable. They also find (see also Gilfanov & Revnivtsev, 2005) that in GX 340+0, the contribution of the boundary layer to the observed emission decreases as mass accretion rate increases, as the source moves along the Z-shaped track in the color-color diagram from the Horizontal Branch to the Normal Branch (see Hasinger & van der Klis, 1989, for an explanation of the branches in the color-color diagram of Z sources). Gilfanov et al. (2003) speculate that this decrease could be due either to obscuration of the boundary layer by a thickened accretion disk, a quantitative change in the structure of the boundary layer, or a complete disappearance of the boundary layer, when . In this scenario, the decrease of the rms variability of the kHz QPOs at high luminosities (high mass accretion rate) would be related to the lower relative contribution of the boundary layer, which produces the bulk of the QPO variability, to the total emission. The obscuration mechanism cannot explain, however, the decrease of the coherence of the QPO at high luminosity. One way to explain the loss of coherence would be if the modulation mechanism in the boundary layer would damp out the oscillations. For instance, the flow of mass onto the boundary layer could be modulated more or less periodically by the disc, and emission would proceed as a series of shots when mass reaches the boundary layer. Changes in the configuration of the boundary layer, as those proposed by Gilfanov et al. (2003), could increase the damping and reduce the lifetime of the QPO. This is of course just speculation; it remains to be seen whether it is possible to explain the decrease of QPO coherence by significant changes in the properties of the boundary layer.
Barret & Verdenne (1994) suggested that there is a critical luminosity for low-mass X-ray binaries with a neutron-star primary, erg s-1; sources below that level show a hard power-law component, whereas sources above that that level do not. Figure 3 shows a sort of dichotomy between the maximum rms amplitude and maximum coherence of the kHz QPOs in the Z sources, for which and the Atoll sources, for which . The separation, however, occurs at a luminosity that is times larger than suggested by Barret & Verdenne (1994). Nevertheless, at least for the lower kHz QPO, the maximum coherence and maximum rms amplitude change significantly and rather smoothly within the Atoll class; this may indicate that, if the QPO properties depend upon the emission of the power-law component, the relative importance of this component may change in a less abrupt manner than suggested by Barret & Verdenne (1994).
The correlation (Fig. 6) suggests that the same mechanism sets the amplitude of both QPOs. But in each source and occur at different luminosities (see Tables 1 and 2), and hence at different times, therefore the mechanism cannot be acting simultaneously on both kHz QPOs. (In fact, in each source occurs at a higher frequency of the upper kHz QPO, than ; see, e.g., van Straaten et al., 2002; van Straaten et al., 2003). If one ignores the case of 4U 0614+09, the source with the lowest luminosity in the sample, also is correlated with as well as with . From this it is tempting to infer that the mechanism that sets the rms amplitude of the kHz QPOs sets the coherence of the lower kHz QPO as well, at least for . At low luminosities either this mechanism is not effective in setting , or another mechanism comes into play that counteracts the effect. The lack of a correlation between and , , or indicates that the mechanism that sets the latter three quantities does not have a significant effect on the coherence of the upper kHz QPO.
As I showed in §3, for 4U 0614+09 either is too low for , or is too high for . But since the maximum coherence for in 4U 0614+09 lies away from the as well as from the correlations, it appears more likely that in this case is too low both for the and , and not the other way around. This hypothesis is reinforced by the fact that a larger would bring 4U 0614+09 closer to the other Atoll sources in Figures 5 and 6, whereas lower and values would put 4U 0614+09 in the gap of the correlations in those two Figures. If this is the case, it is unclear what mechanism could be responsible for the drop of coherence without a simultaneous drop of rms amplitude.
Comparison of the upper right panels of Figures 4 and 7 suggests that the behaviors of in individual sources (in this case 4U 1608–52) and in the sample of sources as a function of hardness are also similar, in that both the coherence of the upper kHz QPO in individual sources, and the maximum coherence of the upper kHz QPO in the sample of sources are more or less independent of the hardness of the source. However, the lack of correlation between and QPO frequency in 4U 1608–52 appears to be exceptional, and in other sources, both Atoll (see, e.g., van Straaten et al., 2002; Altamirano et al., 2006) as well as Z-sources (see, e.g., van der Klis et al., 1997; Homan et al., 2002; Jonker et al., 2000, 2002), increases with QPO frequency, and hence decreases with hardness. From the data in Figure 4 it is not possible to discard a similar slow decrease of vs. hardness.
In black-hole systems, high-frequency QPOs have been observed in the range of tens up to Hz with typical rms amplitude and coherence values % and , respectively (Morgan, Remillard, & Greiner, 1997; Remillard et al., 1999a, b, 2002; Cui et al., 2000; Belloni, Méndez, & Sánchez Fernández, 2001; Strohmayer, 2001a, b; Homan et al., 2001, 2003, 2005; Miller et al., 2001; Klein-Wolt, Homan & van der Klis, 2004; Belloni et al., 2006). The luminosities of these systems when high-frequency QPOs are observed are erg s-1 (e.g., in XTE J1550–564; Homan et al., 2001; Sobczak et al., 2001) or, for the typical mass of the black holes, , . Compared to the neutron-star systems in Figure 3, in black-hole systems the rms amplitude and coherence of the high-frequency QPOs are too low for of the source, but they would be consistent with the values for the Z sources at the same luminosity, i.e., the luminosities not being normalized to the source own Eddington luminosity (of course, to plot the black-hole sources in Figure 3 one would have to divide their luminosities by , the Eddington luminosity for a neutron star, as was done for the other sources in that plot). It remains to be seen whether in black-hole systems the modulation mechanism of the high-frequency QPOs would be similar to that of the kHz QPOs in neutron-star systems.
5 Conclusion
I study the maximum amplitude, , and maximum coherence, , of the kHz QPOs as a function of luminosity and hardness for a dozen low-mass X-ray binaries. I find that:
-
1.
The maximum coherence of the lower kHz QPO, , first increases up to and then decreases with luminosity.
-
2.
The maximum coherence of the upper kHz QPO, , is independent of luminosity.
-
3.
The maximum rms amplitudes of both the lower and the upper kHz QPOs, and , respectively, decrease monotonically with luminosity
-
4.
Both and increase with the source hardness, first increases with hardness and then drops for the hardest source in the sample, and is independent of hardness.
-
5.
The relation between and with luminosity in the sample of sources is similar to the relation between and with QPO frequency in individual sources. The similarity extends also to hardness in the sample of sources and in at least one individual source, 4U 1608–52.
-
6.
The above argues against the interpretation that the drop of QPO coherence and QPO rms amplitude at high QPO frequency in individual sources is due to effects related to the innermost stable orbit around the neutron star in these systems.
-
7.
The drop of coherence and rms amplitude of the kHz QPOs, both in individual sources and in the sample could be produce by changes in the properties of the region in the accretion flow where the flux that produces the QPO is modulated.
Acknowledgments
I thank Didier Barret and Cole Miller for valuable discussions on the ideas that I present in this paper. I thank Diego Altamirano for comments on an earlier version of this manuscript. I also thank Michiel van der Klis for insightful comments that helped improve the paper. This research has made use of data obtained through the High Energy Astrophysics Science Archive Research Center Online Service, provided by the NASA/Goddard Space Flight Center. The Netherlands Institute for Space Research (SRON) is supported financially by NWO, the Netherlands Organisation for Scientific Research.
References
- Abramowicz et al. (2003) Abramowicz, M. A., Karas, V., Kluźniak, W., Lee, W. H., Rebusco, P. 2003, PASJ 55, 467
- Altamirano et al. (2005) Altamirano, D., van der Klis, M., Méndez M., Migliari, S., Jonker, P. G., Tiengo, A., & Zhang, W. 2005, ApJ, 633, 358
- Altamirano et al. (2006) Altamirano, D., et al. 2006, ApJ, submitted
- Bardeen et al. (1972) Bardeen, J. M., Press, W. H., & Teukolsky, S. A. 1972, ApJ, 178, 347.
- Barret et al. (2005a) Barret, D., Kluźniak, W., Olive, J. F., Paltani, S., & Skinner, G. K. 2005a, MNRAS, 357, 1288
- Barret et al. (2005b) Barret, D., Olive, J. F., & Miller, M. C. 2005b, MNRAS, 361, 855
- Barret et al. (2005c) Barret, D., Olive, J. F., & Miller, M. C. 2005c, AN, 326, 808
- Barret et al. (2006) Barret, D., Olive, J. F., & Miller, M. C. 2006, MNRAS, in press
- Barret & Verdenne (1994) Barret, D., & Verdenne, G. 1994, ApJS, 92, 505
- Belloni et al. (2005) Belloni, T., Méndez, & M., Homan, J. 2005, A&A, 440, 207
- Belloni et al. (2001) Belloni, T., Méndez, M., & Sánchez-Fernández, C. 2001, A&A, 372, 551
- Belloni et al. (2002) Belloni, T., Psaltis, D., & van der Klis, M. 2002, ApJ, 572, 392
- Belloni et al. (2006) Belloni, T., Soleri, P., Casella, P., Méndez, M., Migliari, S. 2006, MNRAS, submitted
- Berger et al. (1996) Berger M., et al. 1996, ApJ, 469, L13
- Bloser et al. (2000) Bloser, P. F., Grindlay, J. E., Kaaret, P., Zhang, W., Smale, A., & Barret, D. 2000, ApJ, 542, 1000
- Bradt et al. (1993) Bradt, H. V., Rothschild, R. E., & Swank, J. H. 1993, A&AS, 97, 355
- Christian & Swank (1997) Christian, D. J. & Swank, J. H. 1997, ApJS, 109, 177
- Cui et al. (1998) Cui, W., Barret, D., Zhang, S. N., Chen, W., Boirin, L., & Swank, J. H. 1998, ApJ, 502, L49
- Cui et al. (2000) Cui, W., Shrader, C. R., Haswell, C. A., & Hynes, R. L. 2000, ApJ, 535, L123
- Di Salvo et al. (2003) Di Salvo, T., Méndez, M., & van der Klis, M. 2003, A&A, 406, 177
- Di Salvo et al. (2001) Di Salvo, T., Méndez M., van der Klis, M., Ford, E. C., & Robba, N. R. 2001, ApJ, 546, 1107
- Ford et al. (1997) Ford, E. C., et al. 1997, ApJ, 475, L123
- Ford et al. (1998) Ford, E. C., van der Klis, M., & Kaaret, P. 1998, ApJ, 498, L41
- Ford et al. (2000) Ford, E. C., van der Klis, M., Méndez, M., Wijnands, R., Homan, J., Jonker, P. G., & van Paradijs, J. 2000, ApJ, 537, 368
- Ford et al. (1998) Ford, E. C., van der Klis, M., van Paradijs, J., Méndez M., Wijnands, R., & Kaaret, P. 1998, ApJ, 508, L155
- Gierliński & Done (2002) Gierliński, M., & Done, C. 2002, MNRAS, 337, 1373
- Gilfanov et al. (1993) Gilfanov, M., et al. 1993, ApJ, 418, 844
- Gilfanov & Revnivtsev (2005) Gilfanov, M., & Revnivtsev, M. 2005, AN, 326, 812
- Gilfanov et al. (2003) Gilfanov, M., Revnivtsev, M., & Molkov, S. 2003, A&A, 410, 217
- Hasinger & van der Klis (1989) Hasinger, G., & van der Klis, M. 1989, A&A, 225, 79
- Hertz et al. (1992) Hertz P., Vaughan B., Wood K. S., Norris J. P., Mitsuda K., Michelson P. F., Dotani T., 1992, ApJ, 396, 201
- Homan et al. (2003) Homan, J., et al. 2003, ApJ, 586, 1262
- Homan et al. (2005) Homan, J., Miller, J. M., Wijnands, R., van der Klis, M., Belloni, T., Steeghs, D., Lewin, W. H. G. 2005, ApJ, 623, 383
- Homan et al. (2001) Homan, J., et al. 2001, ApJS, 132, 377
- Homan et al. (2002) Homan, J., van der Klis, M., Jonker, P. G., Wijnands, R., Kuulkers, E., Méndez, M., & Lewin, W. H. G. 2002, ApJ, 568, 878
- Homan et al. (1998) Homan, J., van der Klis, M., Wijnands, R., Vaughan, B., & Kuulkers, E. 1998, ApJ, 499, L41
- Jahoda et al. (1996) Jahoda, K., Swank, J. H., Giles, A. B., Stark, M. J., Strohmayer, T., Zhang, W., & Morgan, E. H. 1996, Proc. SPIE 2808: EUV, X-ray, and Gamma-ray Instrumentation for Astronomy VII, p. 59.
- Jonker et al. (2001) Jonker, P. G., et al. 2001, ApJ, 553, 335
- Jonker et al. (2002) Jonker, P. G., van der Klis, M., Homan, J., Méndez, M., Lewin, W. H. G., Wijnands, R., & Zhang, W. 2002, MNRAS, 333, 665
- Jonker et al. (2000) Jonker, P. G., et al. 2000, ApJ, 537, 374
- Kaaret et al. (1998) Kaaret, P., Yu, W., Ford, E. C., & Zhang, N. S. 1998, ApJ, 497, L93
- Klein-Wolt et al. (2004) Klein-Wolt, M., Homan, J., & van der Klis, M. 2004, Nucl. Phys. Proc. Suppl., 132, 381
- Kluźniak et al. (2004) Kluźniak, W., Abramowicz, M. A., Kato, S., Lee, W. H., & Stergioulas, N. 2004, ApJ 603, L89
- Kuznetsov (2002) Kuznetsov, S. I. 2002, Astron. Lett, 28, 73
- Lamb & Miller (2001) Lamb, F. K., & Miller, M. C. 2001, ApJ, 554, 1210
- Lee & Miller (1998) Lee, H. C., & Miller, G. S. 1998, MNRAS, 299, 479
- Levine et al. (1984) Levine, A. M., et al. 1984, ApJS, 54, 581
- Méndez (2002) Méndez, M., Proc. of the IX Marcel Grossmann Meeting on General Relativity, ed. V. G. Gurzadyan, R. T. Jantzen, & R. Ruffini, (World Scientific Singapore), 2333.
- Méndez & van der Klis (1999) Méndez, M., & van der Klis, M. 1999, ApJ, 517, L51
- Méndez & van der Klis (2000) Méndez, M., & van der Klis, M. 2000, MNRAS, 318, 938
- Méndez et al. (1999) Méndez, M., van der Klis, M., Ford, E. C., Wijnands, R., & van Paradijs, J. 1999, ApJ, 511, L49
- Méndez et al. (1998a) Méndez, M., et al. 1998a, ApJ, 494, L65
- Méndez et al. (2001) Méndez, M., van der Klis, M., & Ford, E.C. 2001, ApJ, 561, 1016
- Miller et al. (2001) Miller, J. M., et al. 2001, ApJ, 563, 928
- Miller et al. (1998) Miller, M. C., Lamb, F. K., & Psaltis, D. 1998, ApJ, 508, 791
- Morgan et al. (1997) Morgan, E. H., Remillard, R. A., & Greiner, J. 1997, ApJ, 482, 993
- Oosterbroek et al. (2001) Oosterbroek, T., Barret, D., Guainazzi, M., & Ford, E. C. 2001, A&A, 366, 138
- Osherovich & Titarchuk (1999) Osherovich, V., & Titarchuk, L. 1999, ApJ, 522, L113
- Psaltis et al. (1999) Psaltis, D., Belloni, T., & van der Klis, M. 1999, ApJ, 520, 262
- Rebusco (2003) Rebusco, P., 2003, PASJ, 55, 467
- Remillard et al. (1999a) Remillard, R. A., McClintock, J. E., Sobczak, G. J., Bailyn, C. D., Orosz, J. A., Morgan, E. H., & Levine, A. M. 1999a, ApJ, 517, L127
- Remillard et al. (1999b) Remillard, R. A., McClintock, J. E., Sobczak, G. J., Bailyn, C. D., Orosz, J. A., Morgan, E. H., & Levine, A. M. 1999b, ApJ, 517, L127
- Remillard et al. (2002) Remillard, R. A., Muno, M., McClintock, J. E., & Orosz, J. A. 2002, in “New Views on Microquasars”, eds. Ph. Durouchoux, Y. Fuchs, J. Rodriguez, Center for Space Physics, Kolkata, India, p.49
- Schnerr et al. (2003) Schnerr, R. S., Reerink, T., van der Klis, M., Homan, J., Méndez, M. Fender, R. P., & Kuulkers, E. 2001, A&A, 406, 221
- Stella & Vietri (1998) Stella, L., & Vietri, M. 1998, ApJ, 492, L59
- Stella & Vietri (1999) Stella, L., & Vietri, M. 1999, Phys. Rev. Lett, 82, 17
- Strohmayer (1998) Strohmayer, T. E. 1998, in AIP Conf. Proc. 431, Accretion Processes in Astrophysical Systems: Some Like it Hot!, ed. Stephen S. Holt & Timothy R. Kallman (New York: AIP), 397
- Strohmayer (2001a) Strohmayer, T. E., 2001a, ApJ, 552, L49
- Strohmayer (2001b) Strohmayer, T. E., 2001b, ApJ, 554, L169
- Sobczak et al. (2001) Sobczak, G. J., et al. 2000, ApJ, 544, 993
- Stollman et al. (1987) Stollman, G.M., van Paradijs, J., Hasinger, G., Lewin, W. H. G., van der Klis, M. 1987, MNRAS, 227, 7
- Sunyaev & Titarchuk (1980) Sunyaev, R., & Titarchuk, L. 1980, A&A, 86, 121
- Titarchuk et al. (2001) Titarchuk, L., Bradshaw, C. F., & Wood, K. 2001, ApJ, 560, L55
- Titarchuk & Wood (2001) Titarchuk, L., & Wood, K. 2002, ApJ, 577, L23
- Titarchuk & Osherovich (1999) Titarchuk, L., & Osherovich, V. 1999, ApJ, 518, L95
- van der Klis (1989) van der Klis, M. 1989, ARA&A, 27, 517
- van der Klis (1995) van der Klis, M. 1995, in X-Ray Binaries, ed. W. H. G. Lewin, J. van Paradijs, & E. P. J. van den Heuvel (Cambridge: Cambridge Univ. Press), 252
- van der Klis (2001) van der Klis, M. 2001, ApJ, 561, 943
- van der Klis (2006) van der Klis, M. 2006, in Compact stellar X-ray sources, ed. W. H. G. Lewin, & M. van der Klis (Cambridge: Cambridge Univ. Press), in press (astro-ph/0410551)
- van der Klis et al. (1997) van der Klis, M., Wijnands, R., Horne, K., & Chen, W. 1997, ApJ, 481, L97
- van Paradijs & van der Klis (1994) van Paradijs, J., & van der Klis, M. 1994, A&A, 281, L17
- van Straaten et al. (2000) van Straaten, S., Ford, E. C., van der Klis, M., Méndez M., & Kaaret, P. 2000, ApJ, 540, 1049
- van Straaten et al. (2002) van Straaten, S., van der Klis M., Di Salvo, T., & Belloni, T. 2002, ApJ, 568, 912
- van Straaten et al. (2003) van Straaten, S., van der Klis, M., & Méndez M. 2003, ApJ, 596, 1155
- van Straaten et al. (2005) van Straaten S., van der Klis M., Wijnands R., 2005, ApJ, 619, 455
- Wijnands & van der Klis (1997) Wijnands, R., & van der Klis, M. 1997, ApJ, 482, L65
- White et al. (1988) White, N. E., Stella, L. & Parmar, A. N. 1988, ApJ, 324, 363
- Wijnands et al. (1998a) Wijnands, R., et al. 1998a, ApJ, 493, L87
- Wijnands et al. (1998b) Wijnands, R., et al. 1998b, ApJ, 495, L39
- (90) Wijnands, R., van der Klis, M., & van Paradijs, J. 1998c, IAU Symp. 188, The Hot Universe, K. Koyama et al. (eds.), 370
- Wijnands et al. (1997) Wijnands, R., van der Klis, M., van Paradijs, J., Lewin, W. H. G., Lamb, F. K., Vaughan, B. A., & Kuulkers, E. 1997 ApJ, 479, L141
- Zhang et al. (1998b) Zhang, W., Jahoda, K., Kelley, R. L., Strohmayer, T. E., Swank, J. H., & Zhang, S. N. 1998b, ApJ, 495, L9
- Zhang et al. (1998a) Zhang, W., Smale, A. P., Strohmayer, T. E., & Swank, J. H. 1998a, ApJ, 500, L171
- Zhang et al. (1996) Zhang, S. N., et al. 1996, A&AS, 120, 2791