The Submillimeter Polarization of Sgr A*
Abstract
We report on the submillimeter properties of Sgr A* derived from observations with the Submillimeter Array and its polarimeter. We find that the spectrum of Sgr A* between 230 and 690 GHz is slightly decreasing when measured simultaneously, indicating a transition to optically thin emission around GHz. We also present very sensitive and well calibrated measurements of the polarization of Sgr A* at 230 and 345 GHz. With these data we are able to show for the first time that the polarization of Sgr A* varies on hour timescales, as has been observed for the total intensity. On one night we find variability that may arise from a polarized “blob” orbiting the black hole. Finally, we use the ensemble of observations to determine the rotation measure. This represents the first statistically significant rotation measure determination and the only one made without resorting to comparing position angles measured at separate epochs. We find a rotation measure of rad m-2, with no evidence for variability on inter-day timescales at the level of the measurement error. The stability constrains interday fluctuations in the accretion rate to 8%. The mean intrinsic polarization position angle is 167∘7∘ and we detect variations of degrees. This separation of intrinsic polarization changes and possible rotation measure fluctuations is now possible because of the frequency coverage and sensitivity of our data. The observable rotation measure restricts the accretion rate to the range yr-1 to yr-1, if the magnetic field is near equipartition and ordered.
1 Introduction
The linear polarization of Sgr A* was first detected by Aitken et al. [1] above 100 GHz, after unsuccessful searches at lower frequencies [2, 3]. Through subsequent observations it has been established that the polarization varies in position angle [4, 5] and fraction [6], with variability occurring on timescales comparable to those of the previously observed total intensity variations (see § 3). The variability may be intrinsic to the source or due to propagation effects, but the short timescales suggest processes at work very close to the black hole and thus polarization should be a useful tool for the study of Sgr A*.
The ability to exploit polarization information is significantly sensitivity-limited for this faint source. Until very recently polarimetric observations have required full nights to obtain reliable measurements, obscuring changes on shorter intervals that might be expected based on total intensity variations. Perhaps more important has been the limited instantaneous frequency coverage. Multiple frequencies must be observed in order to separate the local changes in the emission region from the external changes in the propagation medium (such as rotation measure changes). In the absence of spectral information, these changes can at best be separated statistically through comparisons of observations from different frequencies and different times. As a result of the poor frequency coverage available to date, Faraday rotation has yet to be convincingly detected in this source. Because of its potential to constrain the accretion rate close to the black hole, measurement of Faraday rotation has been a chief goal of polarimetric observations.
Here we present several results obtained with the Submillimeter Array (SMA). The SMA is a sensitive new instrument at a good submillimeter site and favorable latitude for observing the Galactic center. Its has large instantaneous frequency coverage; single-receiver observations provide data in two sidebands 10 GHz apart and in dual-receiver observations the frequency span can be a factor of three (230 to 690 GHz). All of these advantages make the SMA a powerful instrument for the study of the Galactic center, and Sgr A* in particular. We report on observations of the instantaneous spectrum of Sgr A* and the peak in its spectral energy distribution (§ 2), the polarization variability on short timescales (§ 3), and the first measurement of Faraday rotation in this source (§ 4). Other SMA Galactic center observations are presented by Montero-Castaño, Qin, and Winnberg in this volume.
2 Submillimeter Spectrum
Sgr A* is known to have a rising spectrum across three decades in frequency from 300 MHz to 300 GHz. A few detections have been made at frequencies up to 900 GHz [1, 7, 8, 9, 10], but the flux densities are scattered and Sgr A* is occasionally undetectable at the same telescope and frequency [8, 11]. This suggests variability in the source and may also indicate the difficulty of extracting a flux density for Sgr A* from observations with ′′ angular resolution in the presence of contaminating dust and free-free emission. There are only upper limits on the flux density in the far and mid-infrared, while (transient) counterparts in the near-infrared and X-ray show quiescent flux densities that are several orders of magnitude below that at 300 GHz [12, 13, 14]. These data suggest an unobserved peak in the spectral energy distribution (SED) between 300 GHz and the mid-infrared.
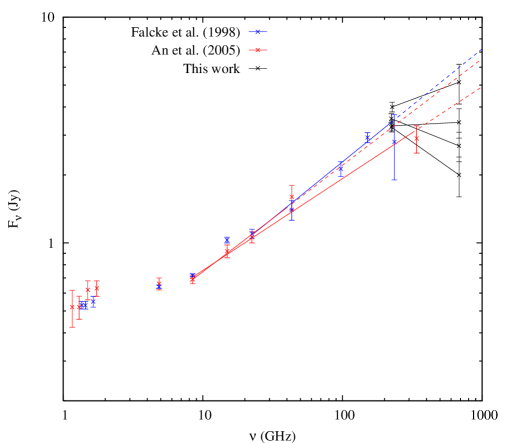
Using the unprecedented submillimeter angular resolution afforded by the SMA, as well as its ability to observe simultaneously at 230 and 690 GHz, we have made several observations of the submillimeter emission of Sgr A*. The radio spectrum is shown in Figure 1, including four epochs of SMA 230/690 GHz observations. The SMA data were obtained on three nights in 2005, with one night split into two intervals due to noticeable variability. The data were obtained in excellent weather, 225 GHz zenith opacities of and corresponding 690 GHz opacities of . Through careful calibration against quasars and multiple primary flux standards (planets), we were able to determine the flux density scale to 15% precision at 690 GHz on the best nights. We find that the spectral index (, for ) between the two frequencies is flat, ranging between and , with a variance-weighted average value of .
We contrast these observations to the spectral index measured at lower frequencies. Below approximately 10 GHz, Sgr A* shows a slowly rising spectrum [15, 16, 17] typical of an inhomogeneous optically thick synchrotron source. Closer to our frequencies, observations have found a steeper spectrum in a “submillimeter bump” [18] extending to at least 200 GHz. Spectral measurements at the highest frequencies must be undertaken with care because interday variations of % are observed above 100 GHz [19], with larger variations observed on few hour timescales [6, 20, 21]. Two multi-facility campaigns to measure the simultaneous spectrum of Sgr A* to GHz are available to provide calibration for our results. In the 1996 observations of Falcke et al. [15] the average spectral index from 22 to 236 GHz is 0.50, while the 2003 campaign of An et al. [16] shows an average spectral index of 0.41 from 8.4 to 340 GHz, or 0.47 if the 340 GHz point is excluded. Yusef-Zadeh et al. [10] also have extensive wavelength coverage but unfortunately their flux densities are contaminated by emission from a radio transient [22] and by flaring. The fits to the simultaneous spectra are plotted in Figure 1 and demonstrate that most of our 230 GHz points correspond well to the extrapolated lower-frequency spectra. The exceptional epoch has a high flux density in both bands and is unusual for other reasons, as shown in Section 3. We clearly observe a deviation from these extrapolations at 690 GHz, with flux density decrements of up to 4 Jy, indicating that we are straddling the peak in the SED. In models of the spectrum of this source the turnover originates from the transition to optically thin emission, typically in a compact component of synchrotron emission corresponding to the inner regions of an accretion flow or the base of a jet [23, 24]. We therefore infer that at frequencies above approximately 300 GHz we have reached this transition and are observing the emission closest to the black hole. This result is particularly important for planned 345 GHz VLBI observations of the relativistically warped image of the black hole. In the case of emission from an accretion flow, VLBI images near the transition frequency should show more structure than would be expected from observations at very optically thin or optically thick frequencies [25]. Something similar might be expected for a jet model since the compact jet nozzle should be the dominant emission source at high frequencies [24], rather than larger scale jet emission that would not appear warped by strong gravity.
3 Polarization Light Curves
The SMA observations are the first to allow short time interval sampling of the millimeter/submillimeter linear polarization of Sgr A* (see Eckart et al. in this volume for polarimetric data in the near infrared). Our 2005 data sample the 230 GHz polarization of Sgr A* in 4 minute integration periods, yielding a typical precision of %, while the 345 GHz polarization is measured over 5.5 minute periods at a precision of %. For calibration details see Marrone [26]. This temporal resolution is at least a factor of thirty better than the only previous time-resolved data [6]. As shown by Broderick and Loeb [27] (see also, these proceedings), the polarization changes during flares should be an essential signature of strong gravity. With a favorable flare, our temporal resolution may allow us to measure the black hole spin and properties of the flaring plasma.
A sample polarized light curve from the SMA is shown in Figure 2. The data are from the same night as the highest 230/690 GHz points in Figure 1. Although the total intensity (Stokes I) does vary during these observations, the changes visible in the polarization are much more dramatic. The light curve shows a 50∘ swing in polarization position angle over a period of just two hours and a decrease in polarization fraction from nearly 8% to 2% over just one hour. Maintaining relative flux calibration at the level of a few percent is difficult in the submillimeter, making the % variability observed in Stokes I difficult to measure to high significance. However, the polarization information is much easier to measure reliably because the observations can be self-calibrated on the relatively strong point source emission from Sgr A* [26]. This makes polarimetry particularly useful for monitoring observations.
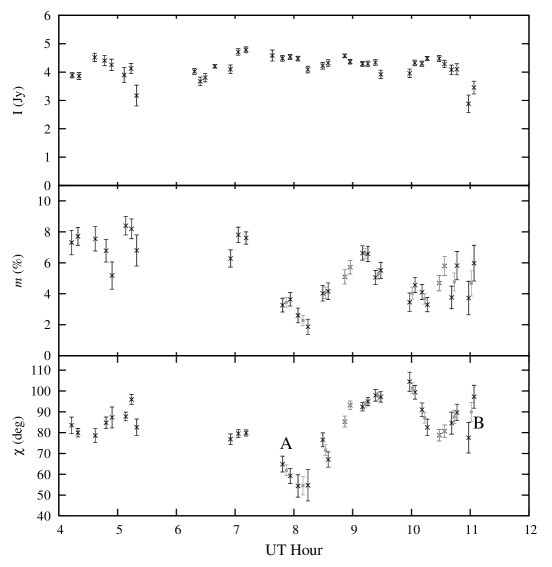
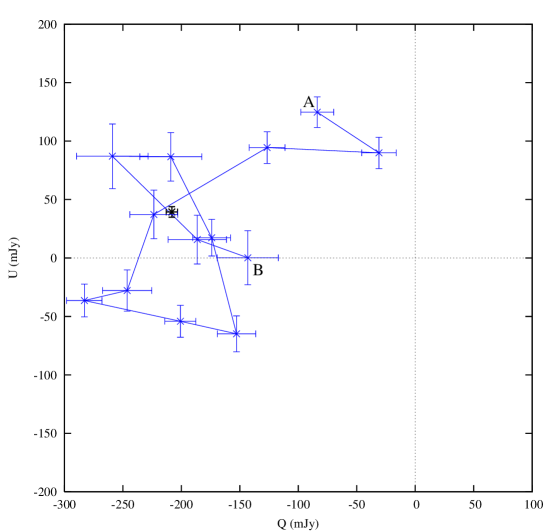
The polarization variability near the end of the observations in Figure 2 looks vaguely periodic when plotted in and coordinates. Examination of more natural coordinates, Stokes Q and U, confirms that we do observe a polarization orbit. The grey points from Figure 2 are plotted in the QU plane in Figure 3, with time proceeding from point A to point B. The polarization appears to circle the mean polarization (marked by the black point) multiple times over the last hours of the light curve. We can understand this track with a simple picture of a submillimeter flare in Sgr A*. We attribute the flaring emission to a newly excited blob of synchrotron-emitting plasma orbiting the black hole in the inner regions of an accretion flow. As the blob orbits the black hole its apparent linear polarization direction will rotate, so when this is added vectorially to the polarization of the surrounding quiescent emission it appears to orbit the mean polarization. The roughly four hour period (twice the period in the QU plane) would correspond to an orbital radius of around 13 Schwarzschild radii (), well outside the marginally stable orbit for a black hole of any spin parameter. Although other mechanisms for variability in Sgr A* are certainly possible, this simple picture matches well with our observations. More complicated effects such as synchrotron losses, general relativistic light paths, and radial motion of the blob can also be considered to allow better fits of the observed polarization track, as discussed by Broderick and Loeb in this volume. Nevertheless, the correspondence between this picture and our observations gives us hope for both the utility of short-timescale polarimetry in understanding Sgr A* flares and the potential for modeling polarized flares.
4 Rotation Measure and Intrinsic Polarization
Despite great interest, a detection of the Faraday rotation measure (RM) has remained elusive since the discovery of linear polarization in 1999 [1]. The presence of linear polarization was used immediately after its detection to argue that the infalling plasma must be tenuous and the mass accretion rate low (less than yr-1), as larger accretion rates would depolarize the emission through extreme Faraday rotation angles [28, 29]. Further progress on determining the accretion rate and its variability has awaited an RM measurement, which is made difficult by the polarization variability and the diminished effect of Faraday rotation at high frequencies. To date there have been three claims of a RM determination through non-simultaneous observations, although none of them is robust. Bower et al. [4] used the few available measurements to determine an RM of rad m-2, but the discovery of polarization variability rendered the result uncertain [5]. Marrone et al. [6] compared average 230 and 345 GHz position angles to find rad m-2. Most recently, Macquart et al. [30] found an RM of rad m-2 from their 83 GHz polarization and the average of all previous data. However, their analysis allows a much lower RM at a probability of 10% or more due to the 180∘ degeneracy of the polarization position angle.
Simultaneous measurements are a much more secure way to determine the RM, but the instantaneous frequency coverage of available instruments has not been adequate to show Faraday rotation. The lowest instantaneous RM upper limit is presently rad m-2 from early SMA 345 GHz polarimetric observations [6], comparable to the RM expected from non-simultaneous measurements. Multi-frequency data allow for the determination of both the RM and intrinsic polarization direction, allowing separation of their fluctuations. Isolating these changes is crucial to understanding the conditions in the inner accretion flow. The RM can be used to determine upper and lower limits on the accretion rate, while variations with frequency and time can be used to examine the structure of the flow. In this section we use SMA measurements to obtain a highly significant RM detection and strong evidence that the intrinsic polarization is variable.
4.1 Observations and Calibration
The results in this section depend crucially on careful calibration and thorough examination of possible systematic effects. Measurements of the RM in Sgr A* with the SMA require convincing detections of inter-sideband position angle differences of 1.5∘ at 345 GHz and 5∘ at 230 GHz. Here we present a summary of the calibration, with details reserved for a paper (Marrone et al., submitted to ApJL).
The data presented here were obtained on ten nights in the summer of 2005 during polarimeter commissioning and as part of regular science programs. There were six tracks in the 230 GHz band and four in the 345 GHz band. The weather was very good, with a typical zenith opacity at 225 GHz of , or when scaled to 343 GHz. All data were obtained with five to seven antennas in the compact configuration ( meter baselines), resulting in a synthesized beam width of 2040 at 230 GHz and 1632 at 345 GHz on Sgr A*. For the purposes of self-calibration and polarization extraction, baselines shorter than were removed to exclude the extended emission around Sgr A*. Polarization was extracted through point-source fits to the visibilities. To obtain full polarization information we used the SMA polarimeter [6], which will be described in a forthcoming instrument paper (D. P. Marrone et al., 2006, in prep.). In 2005 new wave plates were added to the polarimeter to allow simultaneous polarimetry in the SMA 230 GHz and 690 GHz bands. These represent the first scientific data obtained with the new capabilities.
Measurement of polarization relies on precise determination of the fractional contamination (“leakage”) of each polarization state by the cross-handed polarization. Uncalibrated leakage contaminates the linearly polarized Stokes parameters ( and ) with . Leakages were measured each night by observing polarized quasars (3C 279 or 3C 454.3) over a large range of parallactic angle and simultaneously solving for the source and instrumental polarization. The leakages are stable, with an r.m.s. variability of 0.3% at 230 GHz and 0.4% at 345 GHz. There are three potential sources of variability: (1) real instrumental polarization changes between nights, (2) finite signal-to-noise ratio, and (3) polarization leakage that is not constant across the sky, resulting in leakage determinations that depend on the hour angle coverage. The first two sources are likely present at a low level. The third effect is also present, at a level of around 0.2%, due to the SMA optical configuration. Fortunately, the resulting polarization changes are small. Leakage errors of 0.3%0.4% contribute % fractional contamination to the instantaneous polarization measured with seven antennas, significantly less when averaged over a full track due to the parallactic angle rotation. For Sgr A*, which we measure to be 5%10% polarized, this results in at most 1∘ of position angle error. More importantly for this purpose, the uncorrected instrumental polarization (source 3, above) is very nearly constant across the sidebands. Therefore, although the absolute position angle varies by up to 1∘, the inter-sideband difference varies only by 0.1∘0.2∘.
4.2 Rotation Measure and Intrinsic Polarization
Faraday rotation changes the observed polarization position angle () as a function of frequency according to:
| (1) |
where is the intrinsic position angle. The rotation measure (RM) is proportional to the integral of the electron density and parallel magnetic field component along the line of sight. From the observed LSB and USB position angles we derive a RM and for each observation (see Figures 5 and 5). The larger errors on 345 GHz points in these figures result from the much smaller inter-sideband difference in at the higher frequency. The average RM from all 10 epochs is rad m-2, while the 230 GHz and 345 GHz points alone yield rad m-2 and rad m-2, respectively, consistent within their errors. The ten single-night RM values are consistent with a constant value (, for 9 degrees of freedom). We therefore place an upper limit of rad m-2 on the RM dispersion.
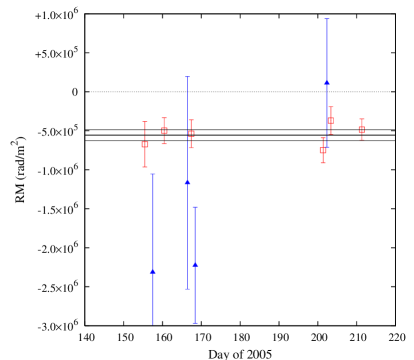
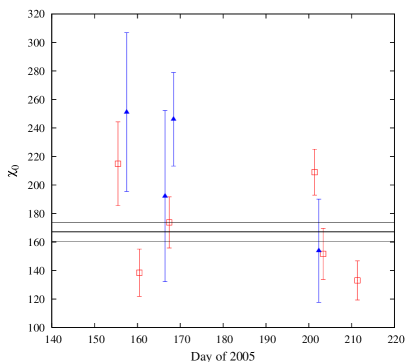
This represents the first statistically significant measurement of the RM of Sgr A*, and the only measurement made from simultaneous observations at multiple frequencies and therefore able to isolate source polarization changes. Our ten measurements show an average intrinsic polarization of , or and from 230 and 345 GHz observations, respectively. The values vary by more than our measurement errors predict, suggesting intrinsic polarization changes. Assuming a constant , we obtain (0.3% probability) using all data points, or (0.16%) for the 230 GHz points only. The variability in the full data set suggests an intrinsic dispersion of degrees, with very similar results obtained from 230 or 345 GHz points separately.
4.3 Implications for the Nature of Sgr A*
The RM we observe is too large to be produced by material beyond the Bondi accretion radius of Sgr A* (approximately 1′′ or 0.04 pc). Using the density measurements of Baganoff et al. [14], the RM in the inner 10′′ is just rad m-2 assuming a 1 mG ambient field. Observations of nearby radio sources have found RMs up to 70% of this estimate [31].
The RM can be used to determine the accretion rate at small radii around Sgr A* if assumptions are made about the nature of the accretion flow. The procedure is outlined in Marrone et al. [6] and assumes a power-law radial density profile () and ordered, radial, equipartition-strength magnetic fields. The accretion rates allowed by our RM detection are shown in Figure 6. The most important parameter in determining the range of accretion rate upper limits is , the radius at which electrons become relativistic and their RM contribution begins to be suppressed [28]. In general, shallower density profiles () approaching that of the convection-dominated accretion flow (CDAF) [32] yield hotter central temperatures and thus larger [33]. Simulations favor values closer to this type of flow (i.e., ) [23, 34, 35, 36]. Simulations with published temperature profiles show between 30 and [23, 34], yielding accretion rate upper limits of to yr-1. Steeper profiles (), as in Bondi-like or advection-dominated accretion flows (ADAF) [37] are marginally relativistic to small radii and may have of a few , indicating an accretion rate upper limit of for . This has been used to rule out the original ADAF model, which has an accretion rate comparable to the Bondi rate ( yr-1 for this source, [14]).

It is very important to note that the assumptions of the Marrone et al. [6] formalism, which were taken from previous related works [28, 38], are not observationally constrained. In particular, the assumption of equipartition-strength fields is not well justified, although simulations may show a tendency to develop field strengths of a few percent of equipartition [35]. Magnetic fields that are a fraction of the equipartition strength will raise the accretion rate limits by (a factor of 10 for %). The assumption of an ordered field is also potentially suspect. The direction of position angle change with frequency, and thus the sign of the RM, appears unchanged since the Aitken et al. [1] measurements in 1999. This sign stability in the RM and stability of the sense of circular polarization may be evidence of a highly reversed field with a small bias superimposed in an accretion flow or jet [39, 40]. Sign stability would not be expected from turbulent accretion flows unless a special geometry is invoked or a rigid field is assumed [35]. If the stochastic field picture is correct, the accretion rate could be much higher than the limits we have derived.
Our RM also allows us to place lower limits on the accretion rate; these are not subject to the caveats above since all of the uncertainties act to raise the minimum accretion rate. If we take to be around or (smaller yields smaller lower limits, so this is conservative for hot flows), we find that the accretion rate must be greater than yr-1 or yr-1, respectively. This rules out a thin disk in this source, as accretion rates of yr-1 or less are required to match the luminosity of Sgr A* with a thin disk [41]. Moreover, if the field is toroidal, reversed, or sub-equipartition, these lower limits are raised and may pose problems for very low accretion rate models. Our limit on RM variability (12%) also limits the fractional accretion rate variability to 8% over two months.
5 Conclusions
We have shown several new observations of Sgr A*, made possible by the Submillimeter Array and its polarimeter. In particular, we report the first significant detection of the RM in this source and discuss its implications. Significant work remains in polarimetric studies of Sgr A*. In particular, these observations cannot be used to detect deviations from the dependence expected for Faraday rotation. Such deviations, arising from internal Faraday rotation, would be evidence for cooler than expected gas at small radii, which would favor steep density profiles. Future dual-receiver SMA observations or joint SMA-CARMA polarimetry could yield measurements at three or more frequencies and resolve this question.
We thank the Submillimeter Array staff, particularly Ken Young, for vital assistance in developing the polarimetry system. We also thank the organizing committee for a well-managed and useful conference.
References
References
- [1] Aitken D. K. et al. 2000 ApJL 534 L173–L176
- [2] Bower G. C., Backer D. C., Zhao J.-H., Goss M. and Falcke H. 1999 ApJ 521 582–586
- [3] Bower G. C., Wright M. C. H., Backer D. C. and Falcke H. 1999 ApJ 527 851–855
- [4] Bower G. C., Wright M. C. H., Falcke H. and Backer D. C. 2003 ApJ 588 331–337
- [5] Bower G. C., Falcke H., Wright M. C. and Backer D. C. 2005 ApJL 618 L29–L32
- [6] Marrone D. P., Moran J. M., Zhao J.-H. and Rao R. 2006 ApJ 640 308–318
- [7] Zylka R., Mezger P. G., Ward-Thompson D., Duschl W. J. and Lesch H. 1995 A&A 297 83–97
- [8] Serabyn E., Carlstrom J., Lay O., Lis D. C., Hunter T. R. and Lacy J. H. 1997 ApJL 490 L77
- [9] Pierce-Price D. et al. 2000 ApJL 545 L121–L125
- [10] Yusef-Zadeh F. et al. 2006 ApJ 644 198–213
- [11] Dent W. R. F., Matthews H. E., Wade R. and Duncan W. D. 1993 ApJ 410 650–662
- [12] Genzel R. et al. 2003 Nature 425 934–937
- [13] Ghez A. M. et al. 2004 ApJL 601 L159–L162
- [14] Baganoff F. K. et al. 2003 ApJ 591 891–915
- [15] Falcke H., Goss W. M., Matsuo H., Teuben P., Zhao J.-H. and Zylka R. 1998 ApJ 499 731
- [16] An T., Goss W. M., Zhao J.-H., Hong X. Y., Roy S., Rao A. P. and Shen Z.-Q. 2005 ApJL 634 L49–L52
- [17] Zhao J.-H., Bower G. C. and Goss W. M. 2001 ApJL 547 L29–L32
- [18] Melia F. and Falcke H. 2001 ARA&A 39 309–352
- [19] Zhao J.-H. et al. 2003 ApJL 586 L29–L32
- [20] Miyazaki A., Tsutsumi T. and Tsuboi M. 2004 ApJL 611 L97–L100
- [21] Mauerhan J. C., Morris M., Walter F. and Baganoff F. K. 2005 ApJL 623 L25–L28
- [22] Bower G. C. et al. 2005 ApJ 633 218–227
- [23] Yuan F., Quataert E. and Narayan R. 2003 ApJ 598 301–312
- [24] Falcke H. and Markoff S. 2000 A&A 362 113–118
- [25] Broderick A. E. and Loeb A. 2006 ApJL 636 L109–L112
- [26] Marrone D. P. 2006. PhD thesis Harvard University
- [27] Broderick A. E. and Loeb A. 2006 MNRAS 367 905–916
- [28] Quataert E. and Gruzinov A. 2000 ApJ 545 842–846
- [29] Agol E. 2000 ApJL 538 L121–L124
- [30] Macquart J.-P., Bower G. C., Wright M. C. H., Backer D. C. and Falcke H. 2006 ApJL. (Preprint astro-ph/0606381)
- [31] Yusef-Zadeh F. and Morris M. 1987 ApJ 322 721–728
- [32] Quataert E. and Gruzinov A. 2000 ApJ 539 809–814
- [33] Quataert E. 2003 Astronomische Nachrichten Supplement 324 435–443
- [34] Hawley J. F. and Balbus S. A. 2002 ApJ 573 738–748
- [35] Igumenshchev I. V., Narayan R. and Abramowicz M. A. 2003 ApJ 592 1042–1059
- [36] Pen U.-L., Matzner C. D. and Wong S. 2003 ApJL 596 L207–L210
- [37] Narayan R. and Yi I. 1995 ApJ 452 710
- [38] Melia F. 1992 ApJL 387 L25–L28
- [39] Ruszkowski M. and Begelman M. C. 2002 ApJ 573 485–495
- [40] Beckert T. and Falcke H. 2002 A&A 388 1106–1119
- [41] Narayan R. 2002 Lighthouses of the Universe , Gilfanov M., Sunyeav R. and Churazov E. ed, page 405. Berlin: Springer