Dynamic Fibrils Are Driven by Magnetoacoustic Shocks
Abstract
The formation of jets such as dynamic fibrils, mottles, and spicules in the solar chromosphere is one of the most important, but also most poorly understood, phenomena of the Sun’s magnetized outer atmosphere. We use extremely high-resolution observations from the Swedish 1-m Solar Telescope combined with advanced numerical modeling to show that in active regions these jets are a natural consequence of upwardly propagating slow mode magnetoacoustic shocks. These shocks form when waves generated by convective flows and global p-mode oscillations in the lower lying photosphere leak upward into the magnetized chromosphere. We find excellent agreement between observed and simulated jet velocities, decelerations, lifetimes and lengths. Our findings suggest that previous observations of quiet sun spicules and mottles may also be interpreted in light of a shock driven mechanism.
Subject headings:
magnetic fields — Sun: photosphere — Sun: chromosphere1. Introduction
The solar chromosphere is sandwiched between the surface, or photosphere, and the hot and tenuous outer corona. This highly structured region, on average 2000 km thick, is constantly perturbed by short lived (3 – 10 minutes), jet-like extrusions that reach heights of 2000 – 10000 km above the photosphere. These thin jets are formed in the vicinity of photospheric magnetic field concentrations. Until recently, their small size and short lifetimes have made detailed analysis difficult (Beckers, 1968; Suematsu et al., 1995), which has led to a multitude of poorly constrained theories of their formation (Sterling, 2000). In addition, there has been considerable confusion about the relationship between spicules at the quiet Sun limb, mottles observed on the quiet Sun disk, and dynamic fibrils (DFs) found in the vicinity of active region plage (Grossmann-Doerth & Schmidt, 1992), although the similarity in many of their properties strongly suggests some of these phenomena are related (Tsiropoula et al., 1994). We focus on observations of DFs (§2), compare them to advanced numerical simulations (§3), report on regional differences of DF properties (§4), and finish with a comparison to quiet Sun jets (§5).
2. Observations of Dynamic Fibrils
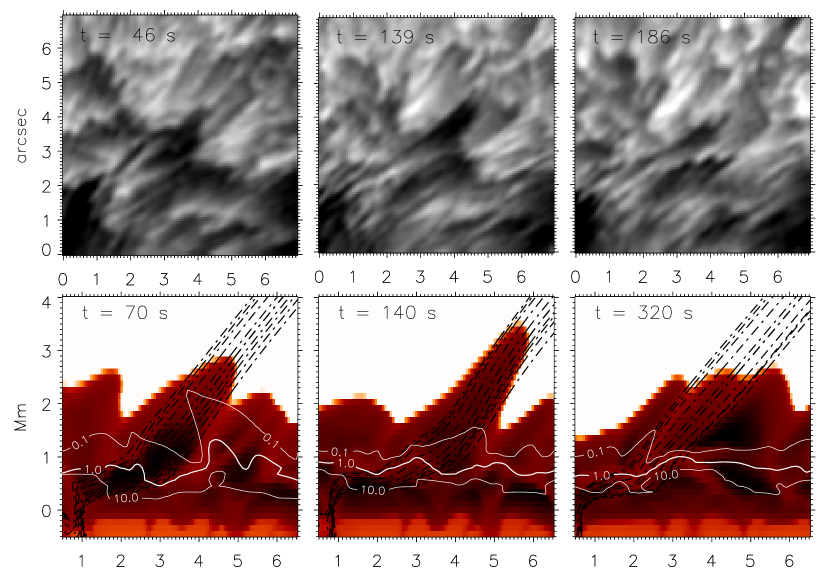
The recent advent of the Swedish 1-m Solar Telescope (SST, Scharmer et al., 2003) and advances in post-processing techniques (van Noort et al., 2005) have allowed us to obtain an unprecedented, diffraction-limited (120 km) 78 minute long time series of the chromosphere as imaged in the core of H (656.3 nm) at a cadence of 1 s (van Noort & Rouppe van der Voort, 2006). These data, taken on 4 October 2005, resolve for the first time the spatial and temporal evolution of DFs, in particular the properties of the 257 DFs chosen for this study. While DFs have varying lifetimes, lengths and widths, a typical fibril rises rapidly to a maximum length in 1.5–3 minutes and recedes in a similar time along the same, relatively straight path, presumably parallel to the direction of the magnetic field (Fig. 1, top panels). Typical fibril lifetimes are between 120 and 650 s, with an average of 290 s. DFs display some internal structure (e.g. at s and s in top panels of Fig. 1): many DFs do not rise and fall as a rigid body but rather show phase and amplitude variations in velocity at various positions away from the fibril axis. Despite the substructure, fibrils are thin, with widths ranging from the diffraction limit of 120 km to 700 km. The maximum projected extent is usually relatively modest, ranging from 400 km to 5,000 km with an average of 1,250 km. Both the lifetimes and lengths of DFs are in the lower range of values reported for quiet Sun spicules or mottles (Beckers, 1968).
It has been a subject of significant debate whether quiet Sun jets such as spicules or mottles follow paths that are parabolic, ballistic (i.e., solar gravity), or constant velocity (e.g., Beckers, 1968; Nishikawa, 1988; Suematsu et al., 1995). The high cadence and high spatial resolution of our observations reveals that most active region DFs observed in H line core follow almost perfect parabolic paths. We have therefore fit the paths to all 257 DFs outlined in H linecenter with parabolas, and use these fits to determine velocities and decelerations. DF motions may be summarized by an initial impulsive acceleration, after which the top of DFs are subjected to a constant deceleration throughout their lifetime (Fig. 2, top panel). At the beginning of the ascending phase, the velocity of the fibril top is supersonic, with an average (line-of-sight projected) value of 18 km/s and a range from 10 to 35 km/s for the 257 DFs. The velocity of the fibril top then decreases linearly with time until it reaches a maximum downward velocity that is roughly equal in amplitude to the initial upward velocity. The average projected deceleration is 73 m/s2 with a significant spread, ranging from 20 to 160 m/s2. These projected values are significantly smaller than the (downward) solar gravitational acceleration of 274 m/s2. In principle, the deceleration suffered by DFs along their path could be much larger than the projected deceleration, if their path is close to the line of sight. We find that the projection angles necessary to obtain solar gravity (or its component along the field) are not compatible with the visual appearance of the large scale topology of the active region (Fig. 4, top panels).
3. Numerical Simulations of Dynamic Fibrils
We find features with similar properties in recent advanced two-dimensional numerical simulations (Fig. 1, bottom panels). These simulations model the evolution of a radiative MHD plasma, and, for the first time, span the entire solar atmosphere from the upper convection zone to the lower corona, including the photosphere, chromosphere and transition region (Hansteen, 2005). This model includes non-grey, non-local thermodynamic equilibrium radiative transport in the photosphere and chromosphere (Nordlund, 1982; Skartlien, 2000), and optically thin radiative losses as well as magnetic field-aligned heat conduction in the transition region and corona. We used an average field strength of about 100 G, with the field clumping up to 1 kG in downdraft regions in the photosphere. In these models, acoustic waves generated in or near the photosphere are found to propagate upward along the magnetic field lines, form shocks in the middle chromosphere, and lift the upper chromosphere several thousand kilometers along a front with a width of up to 1000 km. The elevated plasma protrudes into the hot corona (Fig. 1, bottom panels) and resembles the observed DFs (Fig. 1, top panels). The duration of these simulated jets is of order 3 - 5 minutes, with maximum lengths ranging from km to several thousand km.
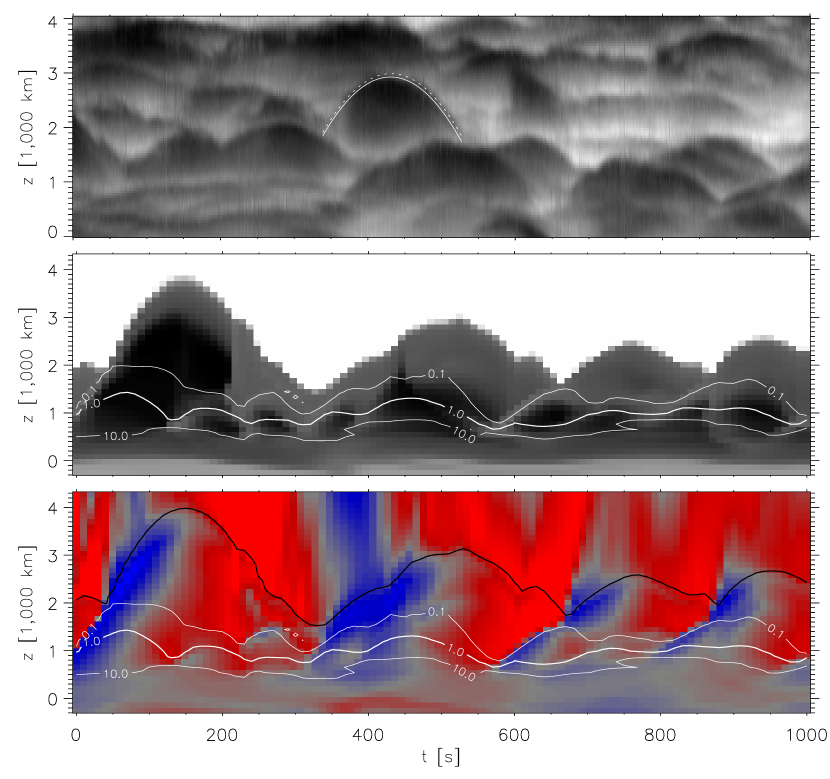
Our numerical simulations explain why the DFs in our SST data have parabolic paths with decelerations that are only a fraction of solar gravity. In the simulations, fibril-like features are seen to follow parabolic paths with properties very similar to those of the observed DFs (Fig. 2, middle panel). These paths occur as a natural result of shock wave driving. When a shock impacts the top of the chromosphere, the plasma is catapulted upward at a velocity that exceeds the local sound speed of 10 km/s. This agrees well with the lower cutoff at 10 km/s of maximum velocities in the observed DFs. Shock waves generally have velocity profiles in the form of ’N’- or ’sawtooth’ shapes (Mihalas & Mihalas, 1984). As a result, a plasma parcel passing through a shock wave will first experience a sudden impulse in velocity, followed by a gradual, linear deceleration as the shock recedes — this is consistent with a parabolic path.
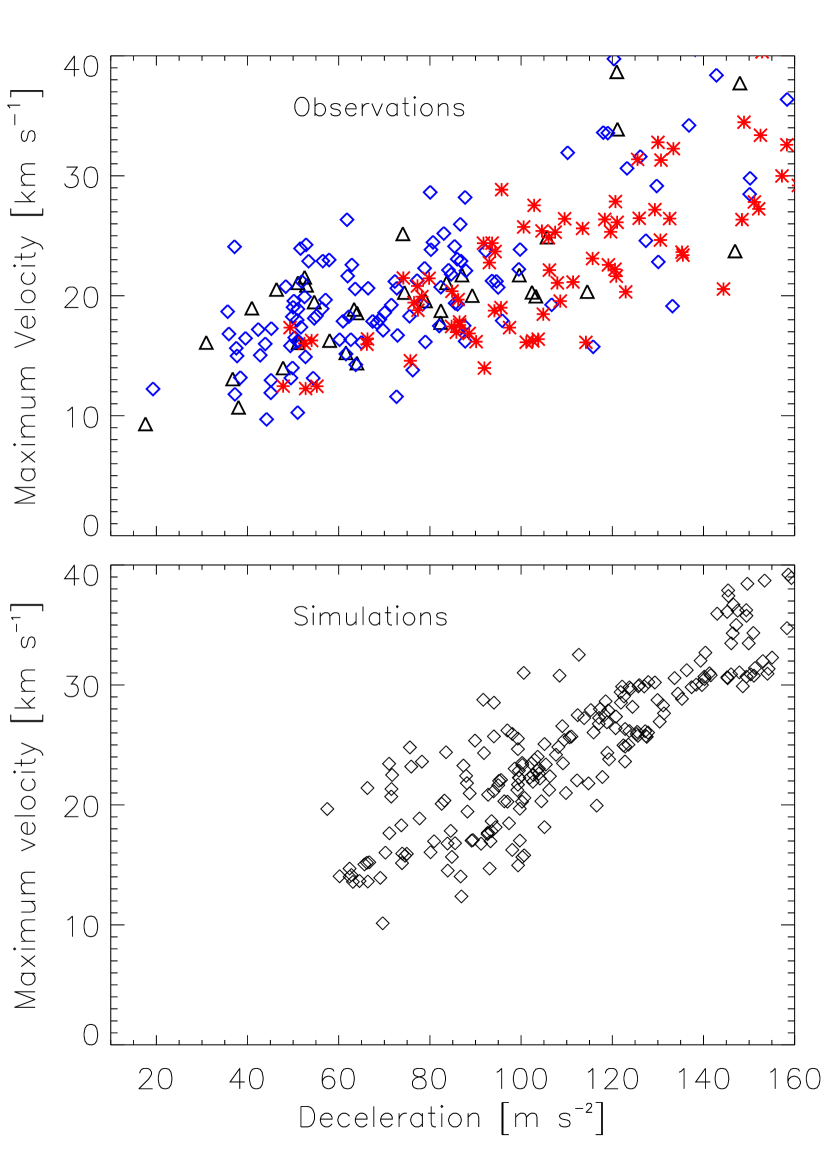
The deceleration in these shock waves depends on the component of solar gravity that is parallel to the magnetic field lines along which the shock waves propagate. However, it also critically depends on the period and amplitude of the shock waves. Even for vertical propagation, our simulations show that the deceleration is less than solar gravity. ’N’-shaped shock waves propagating at any angle to the vertical, will, for a given period, show a steeper decline with time (i.e., deceleration) in velocity for a greater shock strength. Similarly, for a given amplitude, shock waves with shorter periods show larger deceleration. These dependencies explain why the observed DFs have decelerations less than solar gravity. In addition, they offer a natural explanation for an intriguing linear relationship between the deceleration and maximum velocity of the DFs in our SST data. We find that DFs with a larger deceleration show a larger maximum velocity (Fig. 3, top panel). This previously unknown correlation is well reproduced by the jets in our simulations (Fig. 3, lower panel), for which we find a linear relationship with a similar slope and similar range in values as for the observed DFs. The observed relationship and the close similarities to simulations strongly suggest that DFs are driven by chromospheric shock waves with strengths between Mach 1 and Mach 4.
4. Regional Differences in Fibril Properties
This scenario is further strengthened by the clear regional differences of dynamic fibril properties. The field of view of the SST observations contains a dense plage region (region 1, red circle in Fig. 4), where the magnetic field is more vertically oriented, and a less dense plage region (region 2, blue circle in Fig. 4), where the field is more inclined away from the vertical. The dense plage region has a prevalence of DFs with larger decelerations (typically 100 m/s2, lower left panel of Fig. 4) than the region of less dense plage where DFs have smaller decelerations (typically 50 m/s2). In addition, DFs are shorter, typically 1000 km, and have shorter durations (3 minutes) in the dense plage region than in region 2, where DFs are on average 2000 km and typically last for 5 minutes. Since the regional differences imply high decelerations for short-lived and short fibrils, projection effects cannot explain these differences. If we assume that the low decelerations in region 1 are caused by a different viewing angle than in region 2, this projection effect would make the already longer fibrils in region 1 even longer than those in region 2, which would make the regional differences more pronounced. Moreover, differences in duration are independent of projection effects, as are various correlations between deceleration, maximum length and velocity.
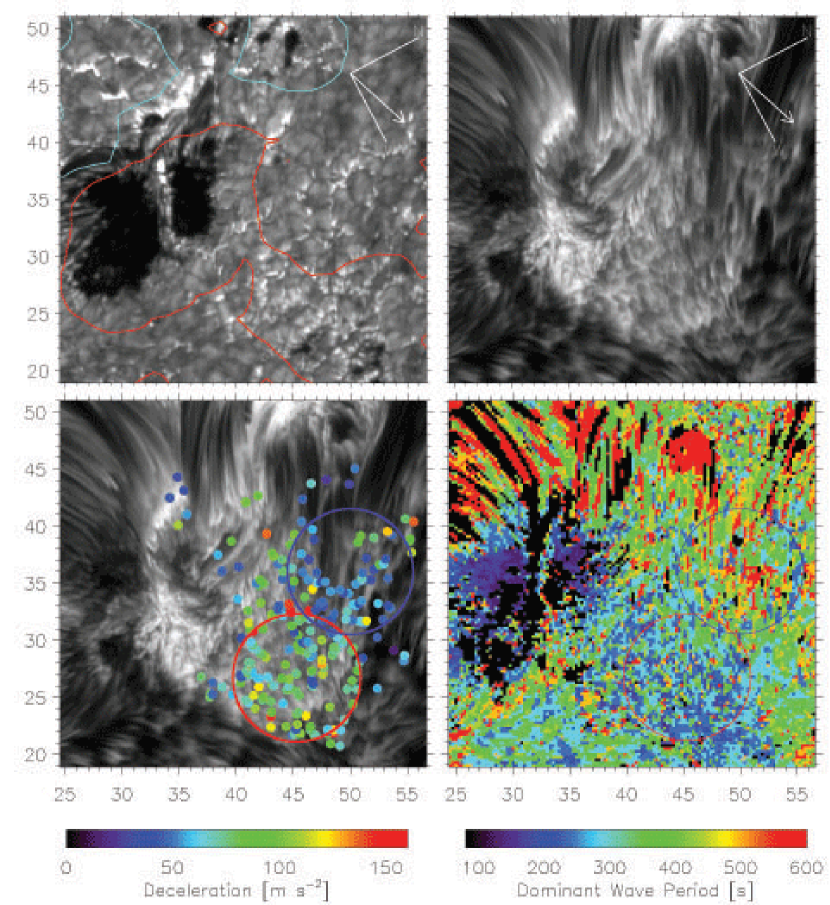
We believe instead that the regional differences occur because the solar atmosphere produces chromospheric shocks of varying strengths and varying periods. The strengths and periods depend critically on which disturbances propagate from the photosphere into the upper atmosphere. The chromosphere acts to filter out upward-propagating disturbances with periods that are longer than the local acoustic cutoff period. In general, the acoustic cutoff period depends on the inclination of the magnetic field lines to the vertical (Suematsu, 1990; De Pontieu et al., 2004). Under conditions of vertical magnetic field such as in the dense plage region (region 1 in Fig. 4), this implies that the chromosphere is dominated by oscillations and waves with periods at the acoustic cutoff of 3 minutes. Since these waves shock and drive the DFs, this explains why DF lifetimes are about 3 minutes in region 1. Wavelet analysis of the H linecenter time series confirms that the upper chromosphere is dominated by wave trains with periods of order 3 minutes (Fig. 4, lower right panel). Observations of the DFs in this region also show higher decelerations and lower velocities. Fibrils in the dense plage region are driven by shocks with slightly lower amplitude, since the photospheric power spectrum peaks at periods of 5 minutes, and in addition the strong magnetic fields in dense plage regions generally reduce the amplitude of convective flows and global oscillations at the photospheric level. These DFs also experience the component of gravity along the magnetic field, which in dense plage regions with more vertical field implies higher decelerations. The short lifetimes, high decelerations and low velocities lead to shorter DFs.
In region 2, where the field is inclined from the vertical, the acoustic cutoff period increases to 5 minutes, allowing waves with the full photospheric peak power at 5 minutes to propagate along the field into the chromosphere, and develop into shocks that are stronger than in region 1 and which drive DFs with lifetimes of 5 minutes. Wavelet analysis of region 2 confirms a preponderance of wave trains with periods of 5 minutes (Fig. 4, lower right panel). The longer lifetimes and less vertical field lead to the observed lower decelerations and longer lengths.
5. Discussion and Conclusion
There are many striking similarities between quiet Sun mottles and the active region DFs studied here. Both phenomena appear as highly dynamic, dark features in the wings and core of H, and are associated with magnetic flux concentrations. More importantly, Suematsu et al. (1995) found evidence that quiet Sun mottles also follow parabolic paths with decelerations that are too small to be consistent with a purely ballistic flight at solar gravity. While the interpretation of their observations proved difficult without detailed numerical models, Suematsu et al. (1995) note that the apparent velocity profiles in mottles are fully compatible with impulsive acceleration followed by a constant deceleration, with maximum upward velocities usually about equal in amplitude to the maximum downward velocities. The velocities they report for mottles, of order 10-30 km/s, are similar to those we find in our SST observations of DFs. Suematsu et al. (1995) also find that the largest Doppler velocities in mottles appear at the beginning of the ascending phase (blue-shifts) and at the end of receding phase (red-shifts), with downward red-shifted motion sometimes occurring close to their base during the ascending phase. These observations agree well with the properties of our simulated jets (Fig. 2, lower panel). In addition, Christopoulou et al. (2001) observe limb spicules with clear parabolic paths with decelerations and maximum velocities similar to those for mottles and DFs.
All of these strong similarities between previous mottle and spicule observations and our modeling and SST observations of DFs seem to imply that highly dynamic chromospheric shock waves cause significant up- and downward excursions of the upper chromosphere in both active region and quiet Sun, as proposed by De Pontieu et al. (2004). Some unresolved issues remain, such as the longer lifetimes of quiet sun mottles and spicules (2-10 minutes), and the greater heights of 2-10 Mm that spicules reach at the limb. Preliminary analysis of our simulations suggests that these differences could be related to large scale differences in magnetic topology. Further numerical simulations of various magnetic topologies will help resolve these issues. For example, it is possible that spicules reach slightly greater heights because they consist of two populations: jets that are driven by shocks (as described here), and jets caused by reconnection. The latter jets could form a subset that on average is taller than the shock driven jets, and perhaps be part of a continuous spectrum of reconnection jets that includes surges, macrospicules and H upflow events (Chae et al., 1998). Whatever the role of reconnection in quiet Sun, our findings indicate that, at least in active regions, most jets are caused by chromospheric shocks driven by convective flows and oscillations in the photosphere.
References
- Beckers (1968) Beckers, J. M. 1968, Sol. Phys., 3, 367
- Chae et al. (1998) Chae, J., Wang, H., Lee, C.-Y., Goode, P. R., & Schuhle, U. 1998, Ap. J.l, 504, L123+
- Christopoulou et al. (2001) Christopoulou, E. B., Georgakilas, A. A., & Koutchmy, S. 2001, Sol. Phys., 199, 61
- De Pontieu et al. (2004) De Pontieu, B., Erdélyi, R., & James, S. P. 2004, Nature, 430, 536
- Grossmann-Doerth & Schmidt (1992) Grossmann-Doerth, U., & Schmidt, W. 1992, A&A, 264, 236
- Hansteen (2005) Hansteen, V. H. 2005, in IAU Symposium, ed. A. V. Stepanov, E. E. Benevolenskaya, & A. G. Kosovichev, 385–386
- Mihalas & Mihalas (1984) Mihalas, D., & Mihalas, B. W. 1984, Foundations of Radiation Hydrodynamics (New York: Oxford University Press)
- Nishikawa (1988) Nishikawa, T. 1988, PASJ, 40, 613
- Nordlund (1982) Nordlund, Å. 1982, A&A, 107, 1
- Scharmer et al. (2003) Scharmer, G. B., Bjelksjö, K., Korhonen, T. K., Lindberg, B., & Petterson, B. 2003, in Innovative Telescopes and Instrumentation for Solar Astrophysics. eds. S.L. Keil & S.V. Avakyan. Proc. SPIE., Vol. 4853, 341–350
- Skartlien (2000) Skartlien, R. 2000, Ap. J., 536, 465
- Sterling (2000) Sterling, A. C. 2000, Sol. Phys., 196, 79
- Suematsu (1990) Suematsu, Y. 1990, LNP Vol. 367: Progress of Seismology of the Sun and Stars, 367, 211
- Suematsu et al. (1995) Suematsu, Y., Wang, H., & Zirin, H. 1995, Ap. J., 450, 411
- Tsiropoula et al. (1994) Tsiropoula, G., Alissandrakis, C. E., & Schmieder, B. 1994, A&A, 290, 285
- van Noort & Rouppe van der Voort (2006) van Noort, M., & Rouppe van der Voort, L. 2006, submitted to ApJ Letters
- van Noort et al. (2005) van Noort, M., Rouppe van der Voort, L., & Löfdahl, M. G. 2005, Sol. Phys., 228, 191