Complex emission line region of Mrk 817
Abstract
In this work we study the physical and kinematical properties of the emission line region of Seyfert 1.5 galaxy Mrk 817 using three sets of observations, among which are high-resolution spectra obtained with the Isaac Newton Telescope on Canary Islands. We find that in Mrk 817 the Narrow (NEL) and Broad Emission Lines (BEL) are very complex, indicating that structure of both the Narrow (NLR) and Broad Line Region (BLR) is complex and consists of at least two sub-regions with different kinematical properties. We find that the BEL can be fitted with the two-component model, where the core of the line is coming from a spherical region with isotropic velocity distribution, and wings might be affected by a low inclined accretion disc (or disc-like emitting region). Also, we discuss the physical properties of the BLR. Moreover, we find that an outflow is present in the NLR, that may be driven by an approaching jet.
keywords:
galaxies:Seyferts - galaxies: individual: Mrk 8171 Introduction
The emission line region of Active Galactic Nuclei (AGN) is complex and is usually divided to the Narrow (NLR) and Broad Line Region (BLR), where the physics of the NLR is better understood then that of the BLR (see e.g. Sulentic et al. 2000). The most accepted scenario of the structure of AGN is the one in which AGN are powered by the accretion of matter from the host galaxy on to super-massive black hole. One of the way to study the inner emitting region of an AGN, one that is closest to the black hole, is by analyzing its broad emission lines. So far, in a small fraction of AGN double-peaked emission lines were detected (around 5 %, see Eracleous & Halpern 2003). Modeling these lines gave proof to the presence of an accretion disc in the AGN (Eracleous & Halpern 1994, 2003). Beside the disc, emission lines also imply presence of more kinematically different emission regions that contribute to formation of lines: complex broad and narrow line regions (Popović et al. 2003).
Even there are numerous papers devoted to the studies of the kinematical and physical properties of the NLR and BLR (Krolik 1999, Kembhavi & Narlikar 1999, Sulentic et al. 2000), it is not clear yet what is the connection between these two kinematically different regions. One of the method to study the connection is to map a whole emission region of an AGN. For that one should have a high resolution spectra of the object that covers wide wavelength band. It is also needed that the AGN emits both narrow and broad lines. Accordingly, the spectroscopical investigations of Seyfert 1 galaxies that have strong narrow lines (as e.g. Seyfert 1.5) are important. Following these reasons, for our analysis we selected Mrk 817, that is a Seyfert 1.5 galaxy, with the redshift of 0.03145, (Strauss & Huchra 1988) determined from the emission lines111A slightly different value of 0.031158, determined from both absorption and emission lines, can be found in Falco et al. (1999), but since the redshift is not crucial for this study we adopt the value of 0.03145 for the systemic redshift of the galaxy., and which both broad and narrow emission lines are complex (Popović & Mediavilla 1997; Peterson et al. 1998; Popović et al. 2004). Also, for this galaxy the mass () and the BLR size ( light days222The radius of 15 light days corresponds to , where is the gravitational radius for the black hole mass of (G is the gravitational constant, M is the mass of the black hole and c is the speed of light).) have been estimated by reverberation mapping studies (Peterson et al. 1998, 2004; Kaspi et al. 2000). We observed the galaxy several times collecting the high resolution spectra in the H and H wavelength band, as well as the low resolution spectra in the wide wavelength region.
The aim of this work is to explore the properties of the whole emission region of the active galaxy Mrk 817. Using the high-resolution spectra (such as one obtained with the Isaac Newton Telescope) in analyzing the broad spectral line shapes and applying the two-component model of the BLR proposed by Popović et al. (2004), we investigate the kinematical parameters of the BLR in Mrk 817. First we will present the Gaussian analysis of the H and H lines and after that we will apply the two-component model for fitting the broad emission lines. Also, an estimate of the electron temperature in the BLR will be given. Finally we make a scheme of the emission line region of Mrk 817 and discuss the complex structure of that region.
2 Observations and data reduction
In studying the BLR of Mrk 817, three different sets of spectral observations were used:
i) Observations with the 2.5-m Isaac Newton Telescope (INT) at La Palma island in Spain. The observations were performed in the period 21–25 of January 2002. The Intermediate Dispersion Spectrograph (IDS) and the 235 camera in combination with the R1200Y grating were used. Two exposures of 550 and 500 s, included three H and three H spectrum. The seeing was and the slit width . The spectral resolution was around 1.0 Å.
ii) Observations with the 4.2-m William Herschel Telescope (WHT), at La Palma islands. The observations were performed on 12/13 March 2001. The long-slit spectrograph (ISIS) was used, in combination with CCD cameras TEK4 (grating R158R). The H was observed with the exposure of 120 s. The slit width of the spectrograph was . The spectral resolution was about 2.9 Å.
iii) Intermediate resolution optical spectroscopy was carried out with Mexican 2.1-m telescope in Observatorio Astronomico Nacional de San Pedro Martir (OAN SPM). Observation were carried out with the Boller & Chivens (B&Ch) spectrograph, equipped with SITe 1k CCD. The width of a spectrograph slit was and grating was 600 lines/mm (Blue and Red), providing a dispersion of 2 Å/pix and with the effective instrumental spectral resolution of about 4 Å ( pixels FWHM). Observations were carried out during fotometric conditions 06–07 of February 2005, with the seeing of (FWHM), when the spectral range covering the Balmer lines was observed. Exposure time for the blue part (H region) was 1800 s and for the red part (H region) was 3000 s.
Standard reduction procedures, including bias and flat field corrections, wavelength calibration, spectral response, cosmic ray hits removal and sky subtraction were performed with the IRAF333 IRAF is the Image Reduction and Analysis Facility distributed by the National Optical Astronomy Observatories, which is operated by the Association of Universities for Research in Astronomy (AURA) under agreement with the National Science Foundation (NSF). More details can be found at http://iraf.noao.edu. software package. The software package DIPSO was used for reducing the level of the local continuum (by using the DIPSO routine ’cdraw 1’444 The ’cdraw 1’ procedure acts essentially as a spline fit to the marked data points. More details for this procedure can be found on the following website http://www.starlink.ac.uk/.) fitted through the points taken to be on the local continuum (full circles in Figure 1). When necessary, spectral lines have been normalized to unity.


3 Kinematical properties of the BLR
3.1 Data analysis
First, we fitted the H and H emission lines with a sum of Gaussian profiles555The Gaussian profile is given as exp, where (FWHM is the Full Width at Half Maximum). using a minimization routine to obtain the best-fitting parameters. The fitting procedure has been described several times (Popović et al. 2002, 2003). In the case of Mrk 817, we have assumed that the narrow [OIII] 4959, 5007 emission lines can be composed by more than one Gaussian component, as the blue-asymmetry is very obvious in their narrow lines (Popović et al. 2004). In the fitting procedure, we look for the minimal number of Gaussian components needed to fit the lines, taking into account the fixed intensity ratio of [OIII] 4959, 5007 lines (the atomic value 1:3.03) and the fit of Fe II template for the H. We took the relative strengths of Fe II lines from Korista (1992) and assumed that they all originate in the same region (i.e. the lines have the same shift and ). Additionally, we assumed the core of the H line is originating in the same region as Fe II lines. In order to analyse the NLR kinematics, we fitted the [OIII] lines separately, after subtracting the continuum and the wings of the H line, keeping the ratio of both components constant (, Figure 3). In the case of the H line, for the narrow [NII] 6548, 6583 lines we assumed their intensity ratio is 1:2.96 (Storey & Zeippen 2000). It was found that three broad Gaussian and one narrow components could fit well the profiles of the H and H lines, where we can recognize clear evidence of substructure in these emission lines, not only in the broad component of the lines, but also in the narrow emission lines (Figure 2).

| z | R | R | z | Fd/FG | ||||
| (o) | (km s-1) | (km s-1) | ||||||
| 12-35 | -450,+300 | 600,850 | 140 | 14000 | 0,+130 | 110070 | 1.8 | 1.1 |
3.2 Results of the Gaussian analysis
Considering only the broad components of the H and H emission lines we can conclude that:
-
(i)
the H and H line shapes of the considered AGN are very complex, and usually cannot be described by one Gaussian, i.e. the Gaussian decomposition indicates a complex kinematic structure of the BLR.
-
(ii)
the Gaussian decomposition indicates the existence of a central broad component with low velocity dispersion 1400 km s-1and a redshift consistent with the systemic redshift.
-
(iii)
the Gaussian decomposition shows the existence of the red- and blue-shifted broad components with higher velocity dispersion 2200 km s-1and higher (positive or negative) redshift. This implies that the emission in the wings could originate in an accretion disc.
As was mentioned above, we assumed that the Fe II lines originate in the same region (with the same and shift) as the core of the H line. From the best-fitting we obtained that velocity dispersion is 1400 km s-1and that a redshift is equal to the systemic redshift of the galaxy. With this asumption we obtained a good fit (Figure 2), therefore it could be that the Fe II emission is created in the same region that is emitting the core of the H and H lines.
3.3 Two-component model
In order to model the BLR, we applied the two-component model where one component is the disc or disc-like region and another one is a spherical emission region. First component was used for fitting the line wings and the other for fitting the line core. For the disc we used the Keplerian relativistic model (Chen & Halpern 1989, Chen et al. 1989). The kinematics of the additional emission region can be described as emission of a spherical emission region with isotropic velocity distribution. Accordingly, the emission line profile for this region can be described by a Gaussian function. The whole line profile can be described by the relation: where , are emissions of the relativistic accretion disc and the spherical emission region, respectively (Popović et al. 2004).
For fitting the broad H and H emission lines with the two-component model, first we ’cleaned’ the lines from its narrow component and satellite lines, using the results from the Gaussian decomposition (Figure 4). Furthermore, we normalized the intensities of both Balmer lines to unity and converted the wavelengths into a velocity scale: . This allowed us to compare the H and H high resolution profiles. We found that they have similar line profiles (Figure 4), which indicates that these lines are coming from the same region. For the fitting we used the average profile of the H and H lines.

The results of the fitting test are very dependent on the initial values given to the parameters since we apply a two-component model to single-peaked lines, so the number of free parameters is large. To overcome this problem we had to use the additional constraint that the disc component fits the line wings, and the spherical component the line core. We have found that this model can well fit the line profiles, but some of the parameters are not constrained. The unique solution for the model could not be obtained without giving additional constrains to the disc parameters, but we were trying to find the optimal solution. This is presented in the Figure 5 were two satisfactory fits, obtained with different sets of parameters, are shown. From these fitting tests (without any constraints for the disc parameters) we were able only to give rough estimates of the kinematical parameters of the BLR in the AGN Mrk 817 (see Table 1). Important result is that the ratio of the disc flux and the flux from the spherical region is close to unity and approximately the same in every fit. Obviously, in this AGN, the shape of the line wings indicates rotational motion, which may be caused by a disc-like geometry.
We should note here that other interpretations for the structure of the complex broad emission line region are possible. For instance a Very Broad Line Region (VBLR), that has isotropic velocity distribution, may be responsible for the emission in the line wings. Therefore, we performed an additional test, in what we fitted the average profile of the broad H and H emission lines with two Gaussians. We obtained a relatively good fit (see Figure 6) in the case when one Gaussian fits the line core (with velocity dispersion 2100 km s-1), and the other one fits the line wings (with velocity dispersion 4600 km s-1). We should note here that the BLR might be composed from two spherical regions, but we should emphasize that we obtained better fit with the disc + spherical emission region model (see Figure 5). This indicates that probably in the case of Mrk 817 the part of the BLR emission is coming from the disc-like region.

4 The Narrow Line Region
The Narrow Line Region (NLR) of the studied AGN also shows a complex structure, and we can clearly see at least two NLR regions (see Figure 3):
-
(i)
the NLR1, which has 450 km s-1, and relative approaching velocity 400 km s-1with respect to the systemic redshift of the observed galaxy; and
-
(ii)
the NLR2 which has 150 km s-1, and a redshift equal to the systemic one of the studied object.
The blue asymmetry observed in the [OIII] lines of Mrk 817 is also detected in numerous AGN, especially the case that the blue-shifted component is broader (see e.g. Veilleux 1991, Leighly 1999, Leipski & Bennet 2006). The difference in shifts and widths of the [OIII] 4959, 5007 between two narrow components indicate different kinematical and physical properties of these two NLRs. The clear tendency of the NLR1 to have a blue-shifted systemic velocity suggests that it is associated with a high-ionization outflow originating in the accreting source. In this case the receding jet emission in the [OIII] lines might be obscured or absorbed by the host galaxy, so one sees only the outflowing gas from the closer part of the jet.
| FHα/FHβ | FHγ/FHβ | FHδ/FHβ | FHϵ/FHβ | FHβ | |
|---|---|---|---|---|---|
| (a) | 3.289 0.750 | 0.3710.092 | 0.183 0.046 | 0.0880.027 | (3.1200.361)E-13 |
| (b) | 2.579 0.588 | 0.4050.100 | 0.208 0.052 | 0.1010.031 | (3.1200.361)E-13 |
5 Balmer line intensities as indicators of the BLR physics
Here we have used the strong Hydrogen lines to discuss the physical properties of the Mrk 817 BLR. Assuming that the BLR is optically thin (see Corbin & Boroson 1996)666Corbin & Boroson (1996) found from the difference between the Ly and H full width at zero intensity (FWZI) values additional evidence of an optically thin BLR. we have applied the method (so called Boltzmann Plot - BP) proposed by Popović (2003) on the flux ratios of the Hydrogen lines of the Balmer series (H, H, H, H, and H), obtained with the OAN SPM telescope. Before measuring the emission line flux, it was necessary to ’clean’ the lines from its narrow component, as well as from the satellite lines (especially in the case of the H and H). In the case of the H, the Fe II contribution was subtracted using the Fe II template of Véron-Cetty et al. (2004). The flux ratios of the Balmer lines are given in the Table 2. The errors were estimated as cumulative errors of the continuum subtraction () and the line flux measurement. The errors of the narrow and satellite lines subtraction are also present, but we estimated that errors of this procedure are within the frame of the above errors.
Also, we took into account the reddening effects. In the case of Mrk 817, the influence of the galactic reddening is insignificant, according to data in the NASA’s Extragalactic Database (NED)777http://nedwww.ipac.caltech.edu/, but the intrinsic reddening is higher, E(B-V)=0.22 (Cohen 1983) and should be taken into account. The values of the unreddened flux are also given in the Table 2 (as value (b)). This reddening coefficient has been determined for the NLR which implies that the reddening could be even higher in the BLR, and consequently the obtained electron temperature may represent the lower limit.
Also, it seems that the BLR of Mrk 817 is composed from two kinematically, and probably physically different regions (see §3.3), and the BP is applied on the summary emission of these two regions. In Popović et al. (2006) several combination were demonstrated, where the BLR is composed of the one region in the Partial Local Thermodynamical Equilibrium (PLTE) and the other one in the non-PLTE conditions, and here we present one example. In this example, we assumed that in one region PLTE is present with K, and that other one, non-PLTE region, emits recombination Balmer line spectrum (”Case B”) with K, (Osterbrock 1989, Table 4.4). We considered that the contribution of each region in the total emission flux () can be different taking that
where and are the flux of the region in PLTE and non-PLTE, respectively. The coefficient is varied from 0.5 to 2 so different contributions of the non-PLTE emission in the total line flux were calculated (the is taken to be 1). In the Figure 7 the BP is presented for the different values of the parameter , as well as for the cases when only PLTE or non-PLTE is present. As one can see from Figure 7, the determined temperature for a mixed BLR (one part in PLTE and one in the ’Case B’ recombination) are higher than they really are in the assumed different parts of the BLR. As it was shown in Popović et al. (2006), if the BLR temperature obtained from BPs are smaller than 20000 K, one may expect that PLTE exist at least in one part of the BLR.

For Mrk 817, in both cases, with or without reddening taken into account, the BP could be applied, meaning that the flux ratio of the Balmer lines could be fitted with the straight line, but with different slopes. On the Figure 8, log(In) vs. E(u)888The log(In) is logarithm of the spectrally integrated emission line intensity and is given as , where is relative intensity of transition from upper to lower level (), is the statistical wight of the upper level and is the transition probability. The E(u) is the energy of the upper level of the line transition (Popović 2003). is presented for the case where correction for the intrinsic reddening was performed. According to calculated slopes, one may consider that PLTE exists at least in one part of the BLR, and consequently give estimates of the electron temperature (Popović 2003). Using the relationship given by Popović (2003) and a temperature parameter obtained from the slope (see Figure 6) we found that the electron temperature might be in an interval of K, depending on the reddening effect and the contribution of different regions to the total flux of broad Balmer lines.

6 Structure of the emission line region of Mrk 817
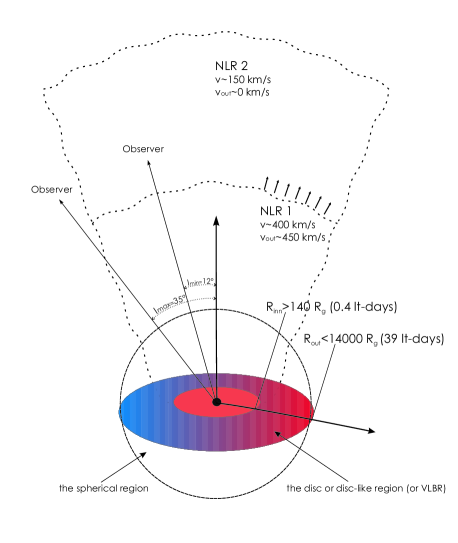
¿From the study of the narrow and broad emission lines we can make some conclusions on the emission line region structure of Mrk 817. In general two main emission regions (NLR and BLR) are present, but they seem to be complex as well. A scheme of the emission line region of Mrk 817 is presented in Figure 9 and it highly corresponds to the unified model scheme.
In the inner part of the emission region probably a relativistic disc or a disc-like region is present (or VLBR see §3.3). Our analysis of the disc parameters shows that the minimal inner radius of the disc cannot be smaller than 0.4 lt-days and that the disc should be smaller then 39 lt-days (for a black hole mass of ). These results are in the agreement with the results obtained by Kaspi et al. (2000), who estimated the dimensions of the BLR to be lt-days. Also, the inclination of the disc is small and in the range of . The other region seems to be spherical with isotropic velocity distribution. It is hard to estimate its dimensions, but one can conclude that it should not be significantly larger than the disc, since the velocity dispersion in this region () is very similar to the velocity dispersion in the disc999Beside the rotational motion, one can expect the random motion inside of the disc, therefore we adopted the model for the disc, proposed by Chen & Halpern (1989), where random motion is also taken into account. (see Table 1). If we assume that the random velocities are decreasing from the center of an AGN, one may conclude that these two regions are not too different in dimensions. It is therefore possible that this region is created by the disc wind (Murray & Chiang 1997).
In this complex BLR, it is hard to determine the temperature (see §5), but from the BP one may have an impression that the temperature might be in an interval from 10000 K to 20000 K. As it was mentioned above, we could not use the BP method as an indicator of the physical parameters of the disc (or VBLR) and the spherical region, since we did not have high resolution observation of the H, H and H lines, but the BP indicates that at least one of the two regions might be close to the PLTE (see Popović et al. 2006).
The narrow line region is also complex and it consists of the NLR1, with 450 km s-1, and relative approaching velocity 400 km s-1with respect to the systemic redshift of the observed galaxy, and the NLR2, with 150 km s-1, and a redshift equal to the systemic one of the corresponding object. Since the inclination angle of the disc is relatively small it is likely that we observe this AGN along the approaching jet that emits only in the NLR1. Therefore, the outflow velocities should be higher for the factor of . There is no clear connection between the spherical region and NLR1, but one can conclude that emission of the approaching jet in the optical spectral band is noticeable only far from the BLR. It is, therefore, interesting that we cannot register an outflow in the spherical part of the BLR. It does not mean that we have no outflow in this region, but it might be that in this part the emission of the jet is in the radio spectral band. The high-resolution VLA map of Mrk 817 at 8.4 GHz (Kukula et al. 1995) shows a relatively symmetric shape of the radio emission, that may come from a line-of-sight orientated jet.
7 Conclusions
In this contribution, we have reported the results of the emission line regions study of the Seyfert 1.5 galaxy Mrk 817. The Seyfert 1.5 galaxies are convenient for exploring the narrow and broad line emission regions since those galaxies have very strong both narrow and broad emission lines. In our work we have used several sets of different spectral observations with high spectral resolution. Our main finding is that both NLR and BLR are complex emission regions, where they are composed of at least two kinematically separated regions. We made a scheme of the emission line regions of Mrk 817 (Figure 9).
We found that the BLR of Mrk 817 can be described with the two-component model, where the core of the line is coming from a spherical region with isotropic velocity distribution, and wings are probably affected by a low inclined accretion disc. The ratio of the fluxes coming from the disc and from the spherical region did not depend on the parameters of the fit, it was almost the same in evert fit and equal to unity. In the NLR, we found that an outflow is present. In principle we can conclude that emission line region of Mrk 817 is complex, heaving at least four kinematically and physically different regions.
Acknowledgments
This work was supported by the Ministry of Science and Environment Protection of Serbia through the project “Astrophysical Spectroscopy of Extragalactic Objects”. L. Č. P. is supported by Alexander von Humboldt Foundation through ”Rückkehrstipendium”. V. H. C. is supported by the CONACYT research grant 39560-F (Mexico). We are grateful to Nina Polusuhkina, who provide us spectra of Mrk 817 observed by K.K. Chuvaev and to Professor Philippe Véron for useful comments and suggestions.
References
- Chen & Halpern (1989) Chen K., Halpern J.P., 1989, ApJ, 344, 115
- Chen & Halpern (1989) Chen K., Halpern J.P., Filippenko A.V., 1989, ApJ 339, 742
- Cohen (1983) Cohen R.D., 1983, ApJ, 273, 489
- Corbin & Boroson (1996) Corbin, M.R. & Boroson, T.A., 1996, ApJS, 107, 69
- Falco et al. (1999) Falco, E.E., Kurtz, M.J., Geller, M.J., Huchra, J.P., Peters, J., Berlind, P., Mink, D.J., Tokarz, S.P., Elwell, B., 1999, The Updated Zwicky Catalog (UZC), PASP, 111, 438
- Eracleous & Halpern (1994) Eracleous M., Halpern J.P., 1994, ApJS, 90, 1
- Eracleous & Halpern (2003) Eracleous M., Halpern J.P., 2003, ApJ, 599, 886
- Kaspi et al. (2000) Kaspi S., Smith P.S., Netzer H., Maoz D., Jannuzi B.T., Giveon U., 2000, ApJ, 533, 631
- Kembahavi & Narlikar (1992) Kembhavi A.K., Narlikar J.V., 1999, Quasars and Active Galactic Nuclei, Cambridge University Press
- Korista (1992) Korista K.T., 1992, ApJS, 79, 285
- Krolik (1999) Krolik J.H., 1999, Active Galactic Nuclei: From the Central Black Hole to the Galactic Environment, Princeton Univ. Press, Princeton
- Kukula et al. (1995) Kukula M.J., Pedlar A., Baum S.A., O’Dea, C.P., 1995, MNRAS, 276, 1262
- Murray & Chiang (1997) Murray N., Chiang J., 1997, ApJ, 474, 91
- Leighly (1999) Leighly K.M., 1999, ApJS, 125, 317
- Leipski & Bennet (2006) Leipski C., Bennet N., 2006, A&A, 448, 165
- Peterson et al. (2004) Peterson B.M., Ferrarese L., Gilbert K.M., Kaspi S., Malkan M.A., Maoz D., Merritt D., Netzer H., Onken C.A., Pogge R.W., Vestergaard M., Wandel A, 2004, ApJ, 613, 682
- Peterson et al. (1998) Peterson B.M., Wanders I., Bertram R., Hunley J.F., Pogge R.W., Wagner R.M., 1998, ApJ, 501, 82
- Popović (2003) Popović L.Č., 2003, ApJ, 599, 140
- Popović et al. (2003) Popović L.Č., Mediavilla E.G., 1997, POBeo, 57, 95
- Popović et al. (2004) Popović L.Č., Mediavilla E.G., Bon E., Ilić D., 2004, A&A, 423, 909
- Popović et al. (2003) Popović L.Č., Mediavlilla E.G., Bon E., Stanić N., Kubičela A., 2003, ApJ, 599, 185
- Popović et al. (2003) Popović L.Č., Mediavlilla E.G., Kubičela A., Jovanović P., 2002, A&A, 390, 473
- Popović et al. (2006) Popović L.Č., Shapovalova A.I., Chavushyan V.H., Ilić D., Burenkov A.N., Marcado A., 2006, (astro-ph/0511676)
- Storey & Zeippen (2000) Storey P.J., Zeippen C.J., 2000, MNRAS, 312, 813
- Strauss & Huchra (1988) Strauss M.A., Huchra J., 1988, AJ, 95, 1602.
- Sulentic et al. (2000) Sulentic J.W., Marziani P., Dultzin-Hacyan D., 2000, ARA&A, 38, 521
- Veilleux et al. (1991) Veilleux S., 1991, ApJS, 75, 383
- Véron-Cetty et al. (2004) Véron-Cetty M.-P., Joly M., Véron P., 2004, A&A, 417, 515