∎
22email: tvsh@prao.psn.ru
Slow glitches in the pulsar B182209
Abstract
The pulsar B182209 (J18250935) experienced a series of five unusual slow glitches over the 1995–2004 interval. The results of further study of this unusual glitch phenomenon are presented. It is also reported the detection a new glitch of typical signature that occurred in the pulsar period in 2006 January.
Keywords:
stars: neutron pulsars: general pulsars: individual: PSR B182209 stars:rotationpacs:
97.60.Jd 97.60.Gb 97.10.Kc 97.10.Sj1 Introduction
The timing observations of PSR B182209 obtained with the Pushchino radio telescope have revealed a new type of glitches, which has not been observed in any pulsar before. These rotation variations occurred in the form of slow glitches (Shabanova 1998, Shabanova & Urama 2000, Shabanova 2005, hereafter SH05). The present paper also reports the detection a new glitch of small size that occurred in 2006 January.
Characteristic feature of the slow glitches observed is a gradual exponential increase in the rotation frequency with a time-scale of 200–300 d. The curvature of the curve is determined by the corresponding change in the frequency derivative , the magnitude of which decreases by 1–2 of the initial value across the glitch. No obvious relaxation in frequency after a slow glitch is observed. The size of the slow glitches after a span of a few years is rather moderate, with magnitude of . Three slow glitches of similar amplitude have occurred in 1995 June, 1998 August and 2000 December. The third slow glitch was independently observed by Zou et al. (2004). The authors also reported a fourth smaller slow glitch that occurred in 2003.
2 Observations
Timing observations of the pulsar were performed with the BSA transit radio telescope at the Pushchino Observatory at frequencies around 103 and 112 MHz, using a 3220 kHz filter bank receiver, as described in detail in SH05. The topocentric arrival times for each observation were corrected to the barycenter of the Solar System using the TEMPO software package and the JPL DE200 ephemeris. A simple spin-down model involving and was used for fitting the barycentric arrival times. In order to study variations in the spin-down parameters of the pulsar in more detail, and were calculated by performing local fits to the arrival time data over the intervals of 200 d.
3 Results
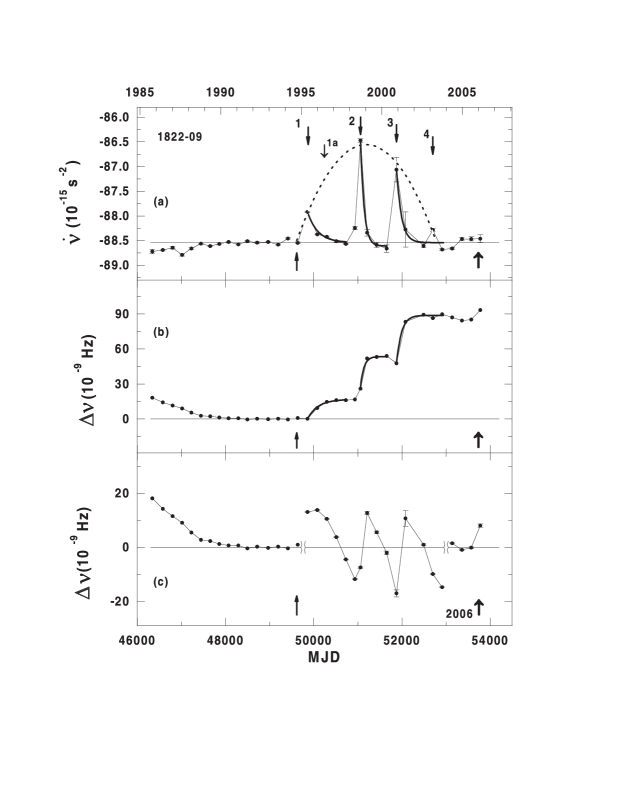
With respect to SH05, we extend the observational interval up to 2006 June, including two years of new observations, and present a description of the timing behavior of the pulsar over the 21-yr data span from 1985 to 2006. The timing data set includes the Pushchino data collected for the period 1991–2006 and the Hartebeesthoek data collected over the 1985–1998 interval and taken from the previously published paper (Shabanova & Urama, 2000). Fig. 1 gives the dependencies of and the frequencies residuals on time, plotted as in fig.2 of the paper SH05, but supplemented with the four last new points.
Since 1994 the pulsar underwent a series of glitches. The first glitch that occurred in 1994 September (MJD 49615) had a typical signature and an extremely small size with the fractional increase of the rotational frequency (marked by the bottom arrow in Fig. 1). The next glitch occurred about a year later, in 1995 June, and initiated a series of five glitches of unusual signature, showing a slow growth in the frequency rotation during hundreds days. Here we mention five glitches because the first glitch shown in Fig. 1, in fact, represents the sum of two partially overlapped glitches of the smaller size (as was pointed out in fig.1 of SH05). The parameters of the slow glitches are listed in Table 3. The epochs of glitches correspond to the time at which reaches its minimum value. The interval between all the glitches is approximately equal to 800 d, if the small glitch 1a is taken as the starting point. With all probability the small glitch 1a marks the starting point of a new phase in the glitching behaviour of PSR B182209. It is seen that rather small sizes of the glitches are related to large changes of across the glitch, which reach . These are responsible for the steepness of the front in .
Fig. 1(a) shows that all the peaks of lie on a curve which is the envelope of these peaks and is well described by a parabolic curve. The existence of the envelope indicates that all the slow glitches are the components of one process, the action of which ceased in the middle of 2004. The beginning of the envelope coincides with the epoch of the 1994 glitch of typical signature. It is likely that this small glitch has behaved as a trigger for the following unusual glitch-like events. Fig. 1(c) also shows that the process, responsible for the oscillatory changes in the rotation frequency, was stopped in the middle of 2004.
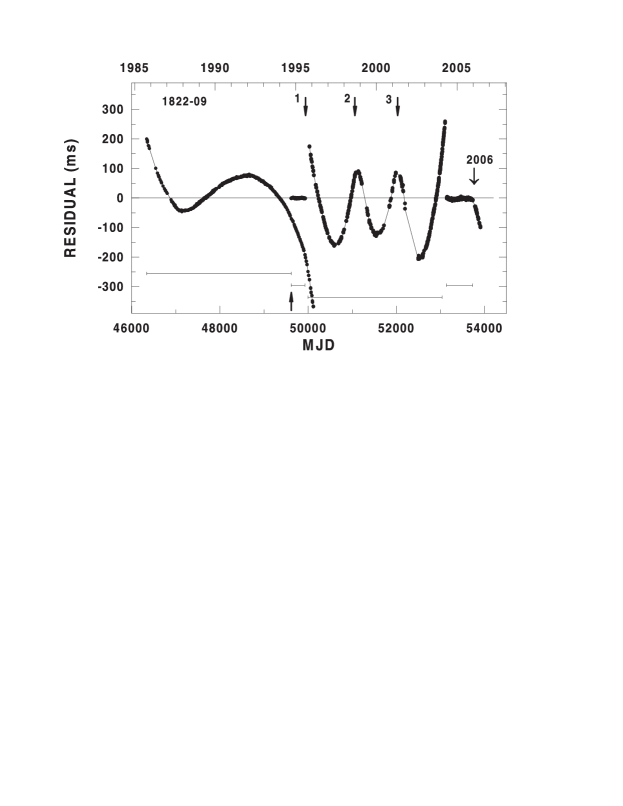
Fig. 2 presents the timing residuals of the pulsar, plotted as in fig.3 of SH05, but supplemented with the last data segment from 2004 June to 2006 June. Analysis of this data segment showed that the pulsar suffered a new glitch that occurred in 2006 January 10 (MJD 53745(2)). This glitch is small, with the fractional increase . The frequency and timing residuals for this glitch are shown in the rightmost sides of Fig. 1 and Fig. 2.
Thus, a total of seven glitches have been detected in PSR B182209 during the 12 years since 1994. All glitches are small, with fractional increases of the rotation frequency . Five of these glitches belong to a new type of glitches that occurred in the form of slow glitches. The newly reported glitch of 2006, on the contrary, has a typical signature.
| No. | MJD | ||
|---|---|---|---|
| 1 | 49857 | 12.8(2) | 7.0(2) |
| 1a | 50253 | 4.3(2) | 4.8(3) |
| 2 | 51060 | 28.7(6) | 24.2(4) |
| 3 | 51879 | 32.0(9) | 16.7(8) |
| 4 | 52700 | 2.5(3) | 2.9(3) |
References
- Shabanova (1998) Shabanova, T.V. A&A, 337, 723 (1998)
- Shabanova & Urama (2000) Shabanova, T.V. & Urama, J.O. A&A, 354, 960 (2000)
- Shabanova (2005) Shabanova, T.V. MNRAS, 356, 1435 (2005) (SH05)
- Zou et al. (2004) Zou, W.Z., Wang, N., Wang, H.X. et al. MNRAS, 354, 811 (2004)