Satellite Systems around Galaxies in Hydrodynamic Simulations
Abstract
We investigate the properties of satellite galaxies formed in N-body/SPH simulations of galaxy formation in the CDM cosmology. The simulations include the main physical effects thought to be important in galaxy formation and, in several cases, produce realistic spiral discs. In total, a sample of 9 galaxies of luminosity comparable to the Milky Way was obtained. At magnitudes brighter than the resolution limit, , the luminosity function of the satellite galaxies in the simulations is in excellent agreement with data for the Local Group. The radial number density profile of the model satellites, as well as their gas fractions also match observations very well. In agreement with previous N-body studies, we find that the satellites tend to be distributed in highly flattened configurations whose major axis is aligned with the major axis of the (generally triaxial) dark halo. In 2 out of 3 systems with sufficiently large satellite populations, the satellite system is nearly perpendicular to the plane of the galactic disc, a configuration analogous to that observed in the Milk Way. The discs themselves are perpendicular to the minor axis of their host halos in the inner parts, and the correlation between the orientation of the galaxy and the shape of the halo persists even out to the virial radius. However, in one case the disc’s minor axis ends up, at the virial radius, perpendicular to the minor axis of the halo. The angular momenta of the galaxies and their host halo tend to be well aligned.
1 Introduction
A successful theory of galaxy formation needs to explain a wide
variety of physical phenomena across many scales. On the Galactic mass
scale, the problem of how small satellites form around galaxies such
as the Milky Way poses two interesting, and as yet not fully answered
questions. These are:
1) What determines the number
of Milky Way satellites and the shape of
their luminosity function?
2) Why are the Milky Way’s satellites aligned on a great circle in
the sky and why is this great circle nearly perfectly perpendicular to
the disc of the Milky Way?
At present, it is
unclear whether the luminosity function of the satellites of the
Milky Way and their peculiar spatial distribution are unique to the
Galaxy, or whether these are generic features that arise during the
formation of a typical galaxy. By virtue of their small size,
extragalactic satellites are difficult to observe and most studies
are hampered by either flux limits, completeness, or sample
size. However, recent advances using large sky surveys have
resulted large samples – albeit with only very few satellites per
primary – and have shed some light on these questions.
In a universe in which the gravitationally dominant component is cold dark matter (CDM), the existence of small-scale power in the initial conditions causes the early collapse of matter; cosmological simulations show that small, dense, CDM haloes are able to form at early times. These low mass haloes grow by successive mergers and smooth accretion giving rise to the large-scale structures we see today (e.g Frenk et al. 1985; Navarro, Frenk & White 1995; Wechsler et al. 2004; Zhao et al. 2003). High resolution N-body simulations of the growth of CDM halos have shown that the dense cores of merging clumps often survive the disruptive effects associated with mergers and remain as distinct substructures (or subhalos) embedded within a larger, smooth main halo (Klypin et al. 1999, Moore et al. 1999). Although the total mass attached to subhalos is only of order of the total halo mass (Ghigna et al. 1998; Gao et al. 2004; Springel et al. 2001; Stoehr et al. 2002), both N-body simulations and semi-analytical calculations of the assembly of dark matter haloes based on the extended Press-Schechter theory (Bond et al. 1991; Bower 1991; Lacey & Cole 1993), show that many more embedded substructures survive than there are visible satellites in galactic halos (Kauffmann, White & Guiderdoni 1993; Moore et al. 1999; Klypin et al. 1999).
Many authors have argued that this so-called “missing satellite problem” poses a severe challenge to the CDM cosmology and encourages the study of alternative forms of dark matter (Craig & Davis 2001; Moore et al. 2000; Spergel & Steinhardt 2000; Yoshida et al. 2000) or of different cosmological initial conditions (Kamionkowski & Liddle 2000). Other authors have argued that the paucity of satellites in the Local Group is a natural byproduct of the physics of galaxy formation that regulate the cooling of gas in small halos (Kauffmann et al. 1993; Bullock, Kravstov & Weinberg 2000; Benson et al. 2002a) or merely the result of a misidentification of substructures in the simulations with satellites in the Milky Way (Stoehr et al. 2002). The semi-analytical model of galaxy formation of Benson et al. (2002b) included a detailed treatment of the reionization of hydrogen in the early universe which, by altering the thermodynamic state of primordial gas, inhibits the formation of small satellite galaxies. In this model, the increase in the entropy of the gas has two effects: it inhibits the cooling of new gas into small halos and it delays star formation in gas that has already cooled. The end result is a satellite population with about the observed numbers seen in the Local Group and with a luminosity function that matches the faint end of the observed function but not its bright end where the model fails to produce enough large, LMC-like satellites.
The spatial distribution of satellite galaxies poses another interesting problem within the CDM paradigm. Whereas N-body simulations show that the substructures that survive within halos tend to be nearly spherically distributed, the galactic satellites of the Milky Way are confined to a highly flattened structure, a puzzling fact first recognized 30 years ago (Lynden-Bell 1976, Kunkel & Demers 1976; see also Lynden-Bell 1982). Kroupa, Thies & Boily (2005) drew attention to this discrepancy and concluded that the anisotropic alignment of the Galaxy’s satellites contradicts the CDM model. Recent work, however, has shown that the satellite galaxies do not populate a random selection of subhalos but are preferentially found in a biased subset which is arranged in a flattened configuration. This bias partly reflects the preferential infall of the most massive dark matter clumps along the filaments of the cosmic web. This phenomenon is clearly seen (to various degrees) in the N-body simulations analyzed by Kang et al. (2005), Libeskind et al. (2005) and Zentner et al. (2005) (and in the cluster mass simulations of Knebe et al. 2004). These studies differ in the precise way in which subhalos are identified with satellites but they all agree that flattened satellite configurations such as that seen in the Milky Way are not uncommon. In particular, Libeskind et al. and Zentner et al. followed the formation of satellites by applying a semi-analytic galaxy formation model to high-resolution N-body simulations. Both studies found not only fattenings consistent with that seen in the Milky Way, but also that the long axis of the flattened satellite distribution tends to be aligned with the long axis of the parent dark matter halo.
Beyond the Local Group, a number of studies have claimed correlations between the orientation of central galaxies and the distribution of their satellites. Holmberg (1969) first identified a lack of satellites in the plane of a coadded sample of central galaxies out to a projected radius of kpc. Zaritsky et al. (1997) found evidence for this “Holmberg effect” but only on much larger scales ( kpc). The reality of the Holmberg effect remains controversial. Early authors claimed that if an anisotropy exists at all, it is, even if significant, at best small (Hawley & Peebles 1975, Sharp, Lin & White 1979, MacGillivray et al. 1982). An enhancement perpendicular to the disc was recently inferred in the distribution of satellites identified in the 2dFGRS by Sales & Lambas (2004) but a private communication quoted in Yang et al. (2005) indicates that the original analysis was incorrect and that the enhancement is, in fact, along the disc, not perpendicular to it. Brainerd (2005) and Yang et al. (2005) have claimed to see an alignment of satellites in the SDSS111http://www.sdss.org/ in the opposite direction to Holmberg’s, that is along the plane of the galaxy disc rather than orthogonal to it. Yang et al. (2005) found that the planar distribution is detectable only in red satellites but the blue population is consistent with an isotropic distribution. These apparently conflicting observational studies all seem to suggest anisotropic distributions of satellites but they disagree on how the overall distribution of satellites is oriented relative to the central galaxy.
In principle, simulations are an ideal way to investigate this sort of issues. Since their introduction to cosmology in the 1970s and early 1980s (Peebles 1971; Aarseth, Turner, & Gott 1979, Frenk, White & Davis 1983), N-body simulations have been extremely useful in revealing how cosmic structures emerge out of small primordial perturbations (see Springel, Frenk & White 2006 for a review). To investigate questions such as the alignment between satellites and central galaxies, however, it is necessary to follow not only the evolution of dark matter, but the coupled evolution of the baryonic component as well. Until recently, progress in this area was hampered by the inability of hydrodynamic simulations to produce realistic discs from CDM initial conditions. Without some form of feedback to prevent most of the gas from cooling into subgalactic fragments, the outward transfer of orbital angular momentum to the dark halo as these fragments merge results in discs that are much too small (Navarro & Benz 1991; Weil, Eke & Efstathiou 1998; Sommer-Larsen, Gelato & Vedel 1999; Eke, Efstathiou & Wright 2000).
The “disc angular momentum problem” has recently been overcome, at least partially, in a number of simulations which include plausible forms of feedback and are able to produce relatively realistic galactic discs (e.g. Abadi et al. 2003, Governato et al. 2004, Robertson et al. 2004, Sommer-Larsen, Gelato & Vedel 1999, Bailin et al. 2005, Okamoto et al. 2005). In this paper, we analyse the simulations carried out by Okamoto et al. (2005). Specifically, we investigate the properties of satellite galaxies orbiting central galaxies of mass similar to that of the Milky Way. We derive the satellite luminosity function over a limited, but still interesting, range of luminosity. We search for anisotropy in the satellite galaxy distribution, and study the alignment of satellite systems with their central disc, as well as the alignment of the disc with the its host dark matter halo.
This paper is organized as follows. In Section 2 we describe the simulations we have used, as well as our method for selecting complete satellite samples. In that section we also derive the satellite galaxy luminosity function and investigate the gas fraction of the largest satellites. We present our analysis of relative shape alignments in Section 3 and of angular momentum alignments in Section 4, and conclude in Section 5.
2 Identifying galaxies and satellites
In this section, we briefly describe the simulations that we have analyzed and the methods that we have developed in order to identify central and satellite galaxies.
2.1 The simulations
We have analyzed two simulations of galaxy formation, both carried out using the parallel PM-TreeSPH code GADGET2 (Springel 2005), as modified by Okamoto et al. (2005). GADGET2 calculates the evolution of dark matter using N-body techniques and the evolution of gas using smooth particle hydrodynamics (SPH).
Initially, the two simulations followed the evolution of dark matter in a cosmological cubical volume of length Mpc in a CDM model with cosmological parameters =0.7, =0.3, km s-1 and =0.9. For the first simulation (hereafter SD), a region around a suitably chosen dark matter halo was identified at the final time and the simulation was run again, this time adding many more dark matter particles, as well as SPH particles, in the region of the halo, and perturbing these with additional high frequency power drawn from the same power spectrum of the original simulation following the general method outlined by Frenk et al. (1996). Since the goal of this simulation was to investigate the formation of a galactic disc, the halo chosen for resimulation was selected to have a quiet recent merger history, with no major mergers since . A preliminary semi-analytical calculation applied to the merger tree of this halo, using the methods of Helly et al. (2003), indicated that a disc galaxy was likely to form in this halo. The high resolution region enclosed a spherical volume of radius 0.9 Mpc around the halo at .
Simulation SD did indeed form a reasonably realistic disc, as discussed by Okamoto et al. (2005) (in their “shock-burst” model). Encouraged by this success, we ran a second simulation (hereafter SR) with the same code, this time populating several regions of the same volume with high resolution dark matter and gas particles. The high resolution regions consisted of a large sphere of radius 5Mpc and four smaller overlapping spheres each of radius r=1Mpc. This arrangement ensured coverage of all the large galaxies that formed out to the virial radii of their halos. The same cosmological parameters were used in both simulations, except that the baryon density was taken to be =0.040 in SD, and slightly larger, =0.044, in SR. In both simulations, the mass per particle was for gas and M⊙ for dark matter. The gravitational softening was 0.5 and 1 kpc for SPH and high resolution dark matter particles respectively, while the minimum SPH smoothing length was 0.5 kpc for simulation SD and 0.39 kpc for simulation SR.
The various physical processes included in our simulations are described in detail in Okamoto et al. (2005). Here, we summarize the salient points. The interstellar medium (ISM) is modelled, following Springel & Hernquist (2003), as a two phase medium composed of hot ambient gas and cold gas clouds in pressure equilibrium. Gas heating and cooling rates are computed assuming collisional ionization equilibrium in the presence of a uniform and evolving ultra-violet (UV) background, which is assumed to be generated by hot OB stars and is switched on at (Haardt & Madau 1996). The cooling rates, which depend on the metallicity of the gas, are computed from the tables given by Sutherland & Dopita (1993); molecular cooling and other forms of cooling below K are ignored.
Star formation can occur in a “quiescent” and a “burst” mode. In the quiescent mode, gas particles that meet a specified density criteria, are turned into stars according to a pre-determined probability. These stars form with a standard initial mass function (IMF; Salpeter 1955). Bursts of star formation are triggered by major mergers which are identified by tracking large changes in the entropy of the gas. In a burst, stars form on a shorter timescale than in the quiescent mode and with a top-heavy IMF. This model of star formation is motivated by the semi-analytical work of Baugh et al. (2005) who argue that only a top-heavy IMF in bursts can explain the number density of sub-millimetre and Lyman-break galaxies at high redshift. Nagashima et al. (2005a, b) argue, similarly, that this model is also required to explain the metallicity of the intracluster medium and of elliptical galaxies.
In the Okamoto et al. (2005) model, the evolution of the stellar populations that form is followed in detail, tracking both type-II and type-Ia supernovae. This requires abandoning the instantaneous recycling approximation (IRA) assumed by Springel & Hernquist (2003), whereby star formation, cold gas cloud formation by thermal instability, the evaporation of gas clouds and the heating of ambient gas by supernovae explosions all occur simultaneously. Instead, following each star formation event, supernovae energy and metals are injected back into the ISM on a timescale which is computed from the mass-dependent stellar lifetime (Portinari, Chiosi, & Bressan 1998; Marigo 2001) and the assumed IMF.
A top heavy IMF in bursts increases the number of supernovae that explode per unit of mass turned into stars, thereby generating stronger feedback. This, in turn, inhibits the early collapse of cold gas clouds in small subgalactic halos, helping to maintain an abundant reservoir of hot halo gas. Following the last major merger and accompanying starburst, radiative cooling of hot gas from the reservoir flows inwards and settles into a centrifugally supported disc which becomes unstable to star formation. This is the key to the formation of a realistic disc galaxy in the simulations of Okamoto et al. (2005).
2.2 Identifying central and satellite galaxies
We begin the process of finding central and satellite galaxies by identifying “friends-of-friends” (FOF) groups in the dark matter, linking together particles whose separation is less than 0.2 times the mean interparticle separation, corresponding roughly to particles within the virialised halo (Davis et al. 1985). We then identify bound substructures (“subhalos”) in the simulation with the algorithm SUBFIND (Springel et al. 2001). Using particle positions and velocities, SUBFIND calculates the binding energy of each FOF group (stripping unbound particles of group membership) and then identifies self-bound substructures inside the parent halo. We consider only halos with ten or more dark matter particles, corresponding to a subhalo mass resolution of . For each subhalo, we calculate the centre of mass, as well the size, , defined as the rms distance of its particles from the centre.
Substructures within the parent halo are thus identified as locally overdense, self-bound, regions in the dark matter density field that fall within the high resolution region of the simulation. In order to identify clumps of star particles as individual galaxies, we associate each star particle with a unique dark matter substructure. For each gas and star particle, we find the substructure whose centre of mass is closest and assign the SPH particle to that substructure if it is within . Since star clumps tend to be dense and centrally concentrated, our results are robust to the choice of subhalo radius (for example, increasing by 50% has a negligible effect on our results). We also impose a ten star particle lower limit, corresponding to M⊙, on the stellar mass of any galaxy. With this resolution limit, our galaxy samples become incomplete at magnitudes fainter than .
We identify “central” galaxies of luminosity similar to the Milky Way with galaxies brighter then -20.4 in the V band. We calculate their virial radius by growing concentric spheres around the galaxy and noting where the mean internal density first falls below 200, where is the critical density. Galaxies that fall within this radius are considered satellite galaxies. In order to obtain isolated systems similar to the Milky Way, we ensure that no two central galaxy candidates are within each other’s virial radius.
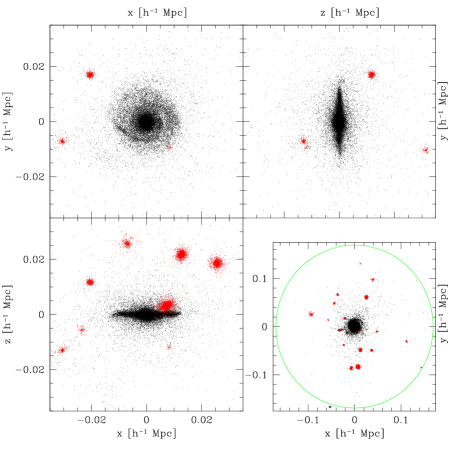
Fig. 1 shows an illustrative example of how our algorithm selects central and satellite galaxies. We plot all the star particles within the virial radius projected onto the principal planes of the central galaxy, i.e. the planes on which the galaxy is face-on and edge-on. In red, we plot the star particles that are associated with satellite galaxies. There are different numbers of satellites in each projection because we are plotting all the star particles in projection through the virial radius, which is larger than the plotted box. In the bottom right panel, we show the face-on projection of the system out to the virial radius. The central galaxy has a very extended stellar halo (black points in the figure) made up of stars that lie within the of the central galaxy’ subhalo and not within the of any satellite subhalo. This extended halo makes up only a small fraction of the stellar mass of the central galaxy. Below, when we calculate the shape of the central galaxy we remove the extended halo by considering only the innermost 98% of the stars.
| gh1 | gh2 | gh3 | gh4 | gh5 | gh6 | gh7 | gh8 | gh9 | |
| ( Mpc) | 0.171 | 0.170 | 0.169 | 0.146 | 0.106 | 0.133 | 0.120 | 0.106 | 0.151 |
| 1.170 | 1.154 | 1.127 | 0.731 | 0.281 | 0.458 | 0.397 | 0.284 | 0.795 | |
| 4.64 | 6.73 | 4.54 | 3.63 | 1.62 | 2.28 | 1.69 | 1.21 | 3.88 | |
| 2.19 | 3.51 | 3.78 | 1.86 | 0.54 | 1.86 | 1.22 | 0.89 | 2.40 | |
| -21.3 | -22.1 | -21.2 | -20.9 | -20.4 | -20.5 | -20.4 | -20.4 | -21.6 | |
| 20 | 13 | 16 | 4 | 5 | 5 | 8 | 5 | 2 | |
| 2.64 | 1.89 | 1.76 | 1.78 | 0.71 | 1.30 | 1.04 | 1.01 | 2.01 | |
| 2.00 | 4.84 | 2.79 | 1.85 | 0.92 | 0.99 | 0.66 | 0.20 | 1.87 |
3 The luminosity function of satellite galaxies
Our simulations produced a sample of 9 central galaxies with , 8 from simulation SR and one from simulation SD. The properties of these 9 systems are displayed in Table 1.
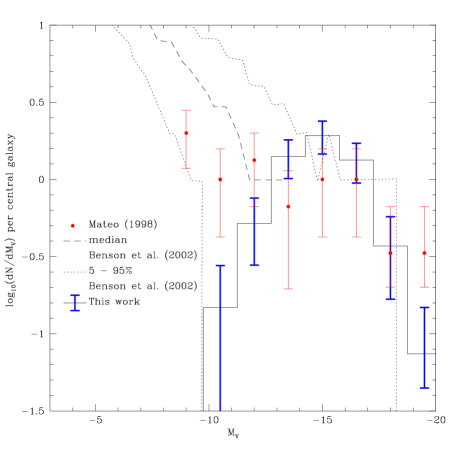
The V-band luminosity function of the satellites in this sample is shown in Fig. 2. The luminosity function is nearly flat in the range and drops off sharply at fainter and brighter magnitudes. The nominal resolution limit of our simulations corresponds to a satellite absolute magnitude and it is important to check whether the decline in the luminosity function in the range is the result of feedback processes, such as photoionization or supernova feedback, which affect the number of faint galaxies in the simulations, or whether it is due to limited resolution.
To investigate the likely effects of resolution in our estimate of the satellite luminosity function we have used the semi-analytic model GALFORM described by Cole et al. (2000) and Benson et al. (2002a). The semi-analytic model includes all the standard physical effects present in the simulation: gas cooling according to a metallicity-dependent cooling function, star formation, feedback due to supernovae explosions, etc. Photoionization is included in an approximate way by assuming that gas cannot cool in halos with circular velocity km s-1 after the assumed epoch of recombination, . Baugh et al. (2005) have shown that this simple approximation gives an excellent match to a detailed calculation based on the concept of a filtering mass (Gnedin 2000, Benson et al. 2002b).
We proceed as follows. In the semi-analytic model, it is possible to specify the mass of the smallest halo to be considered and this allows us to model the effects of resolution in the SPH simulation (Helly et al. 2003). We recall that in the simulation itself we only considered halos with at least ten particles, corresponding to M⊙. We ran a series of semi-analytic models with resolution varying by 4 orders of magnitude, from to . In all cases, we found that the shape of the luminosity function brightwards of was essentially unaffected. If the resolution is degraded further, then the faint end of the luminosity function becomes truncated at increasingly bright magnitudes. We conclude from this test that our satellite sample is likely to be complete for magnitudes brighter and that our estimate of the satellite luminosity function in this regime is unlikely to be affected by resolution.
In Fig. 2, we compare our estimated luminosity function with data for satellites in the Local Group obtained from the sample compiled by Mateo (1998), supplemented with data from Irwin222http://www.ast.cam.ac.uk/mike/local_members.html. Unlike Mateo (1998), we include the SMC, the LMC and M33 in our sample. Brighter than our estimated resolution limit of , we find that the luminosity function in our simulations is in excellent agreement with the Local Group data over a range of 7 magnitudes, down to . Of course, in the Local Group, the statistics at the bright end are rather poor: the last two data points (centred on and ) contain only one galaxy each (the LMC and M33, respectively). However, within the errors, the simulations are consistent with the data.
We also compare our results in Fig. 2 with those in the semi-analytic model of Benson et al. (2002b). The simulations and the semi-analytic model are broadly in agreement over most of the luminosity range, from the resolution limit of the simulations to the brightest two bins. However, there is a significant difference at the bright end: while we find a satellite as bright as the LMC one third of the time, Benson et al. only find one such satellite 5% of the time. In the simulations, satellites as bright as M33 are produced in about 5% of systems, while the frequency in the Benson et al. model is less than 1%. The reasons for the disagreement between the semi-analytic model and the simulations (and Local Group data) are a reflection of the different treatment of various physical processes in the methods. However, the fact that our simulations match the observed satellite luminosity function over a large range of magnitudes indicates that the relatively small observed number of satellites in the Local Group is not, in principle, difficult to explain within the CDM model. The much publicized “satellite problem” exists, as other authors have remarked (e.g. Bullock et al. 2000; Benson et al. 2002b), only when the astrophysical processes involved in the formation of visible galaxies are neglected.
In order to investigate how realistic the satellites in our simulations are, particularly the bright ones, we compare, in Fig. 3, their gas fractions with those of real satellites.
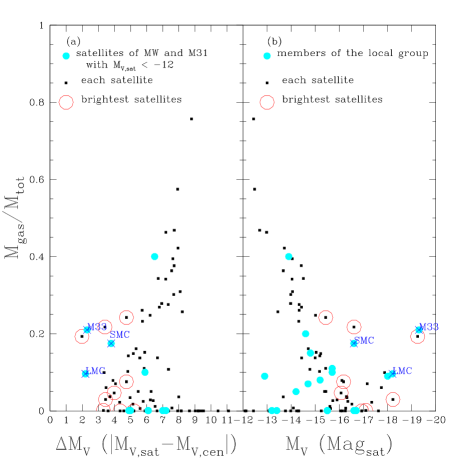
Panel (a) shows the gas fractions as a function of the magnitude difference between the satellite and the parent galaxy in the V-band. Only satellites with in the simulations, the Milky Way and M31 are shown and, for the latter, we require also a reliable measurement of, or upper limit to the gas fraction. The simulations show a trend of increasing gas fraction with decreasing luminosity which, as far as the scant data for the real satellites permit, seems consistent with the measurements. In particular, the brightest satellites in the simulations bracket the values measured for the LMC, the SMC, and M33 with 3 out of 9 simulated satellites having a larger gas fraction than the LMC and SMC. In panel (b) we extend the comparison by including not only satellites within the virial radius, but all the satellites in the Local Group that have reliable gas fraction measurements or upper limits. In this case, we plot the gas fraction against the V-band magnitude of the satellite. The trend of increasing gas fraction with decreasing luminosity is now clearer in the data and the locus they define agrees well with the locus traced by the simulated satellite galaxies (although note that not all the points plotted are strictly speaking satellites, according to our definition, which requires satellites to lie within the virial radius.) We conclude that the satellites in the simulations not only have a luminosity function similar to that observed, but also have realistic gas fractions.
4 The spatial distribution of satellite galaxies
In Fig. 4, we show the mean interior radial mass density profile of the dark matter (red dashed line) and the mean interior radial number density profile of the satellites (thick black line) averaged over the 9 central galaxies in our simulations.
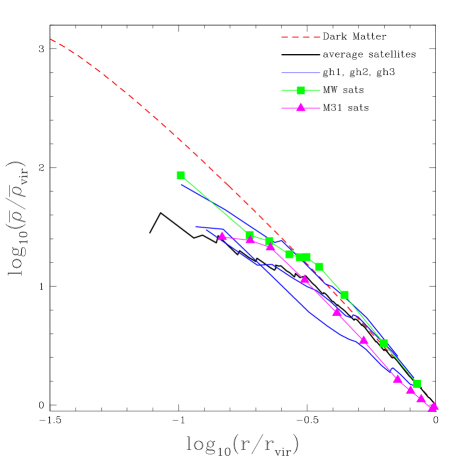
Also plotted are the individual number density profiles of the satellites in the three systems with 11 or more satellites (gh1, gh2 and gh3; blue lines), as well as the corresponding profiles for the 11 brightest satellites in the Milky Way (magenta line) and M31 (green line). All profiles have been normalized to their respective values at the virial radius. The dark matter density profile, shown as the dashed line, closely follows the NFW form (Navarro, Frenk & White 1996; Navarro, Frenk & White 1997). As found in previous N-body studies (Stoehr et al. 2002; Gao et al. 2004; Libeskind et al. 2006), the average satellite number density profile is flatter than the dark matter mass density profile. The three simulated systems with 11 or more satellites display a range of profiles, but they all resemble the observed profiles of real satellites, and one of them (gh2), is remarkably close to the Milky Way data over the entire radial range, 0.1-1.
To characterize our simulations further, we investigate the flattening of the distributions of dark matter, satellites and stars in the central galaxy. We define the tensor of second moments,
| (1) |
where is the coordinate of the th particle in a reference frame centred on the centre of mass of the central galaxy. To determine the flattening of the central galaxy, we consider only the innermost 98% of the stars and exclude the outermost 2% that make up the diffuse stellar halo. (Our results are insensitive to the exact fraction of excluded stars, provided this is small.) To determine the principal axes of each distribution, we diagonalise the tensor . Its eigenvalues, , give the mean square deviation of the , and coordinates along the principal axes. We define as the major, intermediate and minor axes of the system, and use the notation {,}, {}, {} to refer to the distributions of dark matter, satellites and stars in the central galaxy respectively.
It is important to keep in mind that estimates of , and using small numbers of objects are generally biased towards higher anisotropy. For example, if a system has only three members (e.g. satellite galaxies), our method would always return since three objects will always lie on a plane. Tests of the statistical robustness of our results are performed below.
The Milky Way has 11 satellite galaxies within its virial radius with reliably measured positions and magnitudes. As shown in Table 1, of our sample of nine simulated central galaxies, three have 11 or more satellites and can be compared with the Milky Way. The axial ratios of each central galaxy in our simulations, its dark matter halo and, for systems with 11 or more members within the virial radius, its satellite distribution are shown in Fig. 5.
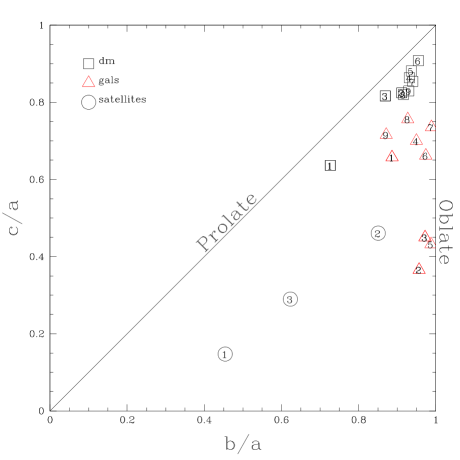
It is immediately apparent that, in the three sufficiently rich systems, the distribution of the 11 most massive satellites is considerably flatter than their respective dark matter halo, particularly in systems 1 and 3. This is consistent with previous studies (Libeskind et al. 2005, Kang et al. 2005, Zentner et al. 2005) which also found large flattenings in simulated satellite systems, although in those studies the satellites were identified in dark matter simulations using a semi-analytic galaxy formation model rather than the full hydrodynamic calculations that we are analyzing here. Libeskind et al ascribed this anisotropy to the preferential infall of substructures along the spines of filaments as they collapse to make a galaxy.
In order to assess the statistical robustness of our results, we performed three tests whose results are displayed in Table 2.
| gh1 | gh2 | gh3 | |
|---|---|---|---|
| Isotropic NFW sphere | 0.1% | 47.6% | 5.4% |
| Squashed NFW profile | 0.4% | 51.5% | 6.4% |
| Simulated dark halo | 0.6% | 66.2% | 10.5% |
For the first test, we constructed a spherically symmetric NFW halo with particles. We then selected 11 particles at random from the halo 1000 times, and calculated the cumulative distributions of minor-to-major and intermediate-to-major axis ratios. The probability of drawing more extreme values that those measured for the satellite distributions in the simulations is given in the first row of Table 2, for each of the three galaxies with 11 or more satellites. For the second test, we construct flattened NFW halos by squashing a sphere according to the values of , , and for each of the three simulated halos. We then performed the same test as before; the results are displayed in the second row in Table. 2. Finally, we selected 11 dark matter particles directly from each of the three halos (again 1000 times) and performed the same test with results given in the third row of the table.
With the exception of galaxy gh2, whose satellite system is the least flattened of the three (see Fig.5), the numbers in Table 2 rule out with high confidence the null-hypothesis that the satellite systems in the simulations were randomly drawn from either a spherical or a squashed NFW halo or from the dark matter distribution of the halo itself. This result agrees well with those obtained by Libeskind et al. (2005) and Zentner et al. (2005).
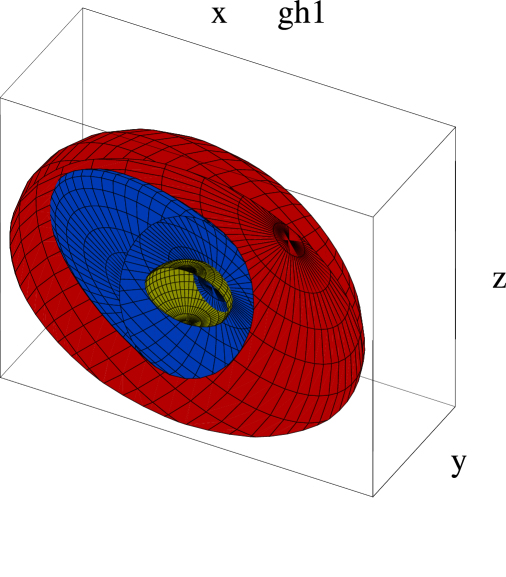
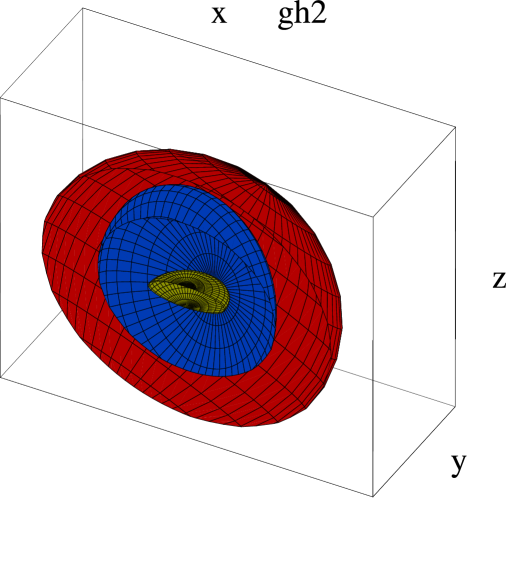
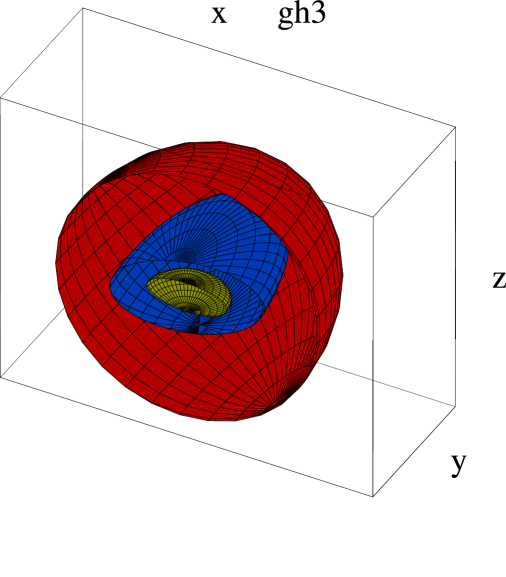
The flattening and relative orientations of the disc, halo and satellite system of each of our three well populated simulations are shown schematically in cross section in Fig. 6. While the relative flattening and orientation of each component has been rendered according to the measured values, for clarity, the relative sizes have been chosen arbitrarily. The central galaxy is represented by a yellow ellipsoid embedded within two larger ellipsoids, a blue one representing the satellite system and a red one representing the dark halo. The poles (i.e. the direction of the axis) are visible as the point at which the lines of “longitude” converge. The various systems display a variety of orientations which we quantify below.
The central galaxy orientations displayed in Fig. 6 were calculated from the innermost 98% of stars. To refine our estimate of orientation and for other purposes, we have performed a dynamical bulge-disc decomposition for each of the nine central galaxies in our simulations, applying the method proposed by Abadi et al. (2003) and used also by Okamoto et al. (2005). The net angular momentum, relative to the centre of mass of the galaxy, of the material in the inner kpc is used to define a “z” axis. The angular momentum, , about this axis is computed for each star particle and compared to the angular momentum of a circular orbit with the same energy, . All stars with are assigned to a disc component whose orientation is taken to be the direction of the nett angular momentum of the disc stars. (In some cases, this method may incorrectly assign some bulge stars to the disk, but this is not important for our analysis.) Generally, the direction defined by the disc angular momentum coincides with that of the short axis of the overall stellar distribution, except in two case (galaxies gh8 and gh9) which are bulge-dominated galaxies with very small discs whose orientation is ill-defined. In what follows, we take the orientation of the galaxy to be that of the disc except for gh8 and gh9 for which we take the direction of their minor axis.
The angles between the different components of each of the three galaxies with 11 or more satellites are plotted in Fig. 7. The top panel shows that in two of the galaxies, the disc is inclined about relative to the minor axis of the dark halo. Surprisingly, in the third galaxy, the disc is orthogonal to the minor axis of the halo. The middle panel shows that in two cases (including the one with the orthogonal disc), the satellite systems are, within , perpendicular to the galactic disc. This is also surprising but it is exactly the alignment seen in the Milky Way galaxy, where the satellites lie approximately along a great circle on the sky whose pole is in the galactic plane (e.g. Kroupa et al. 2005). In the third system (gh3), the satellite system is almost perfectly aligned with the galactic disc. Finally, the bottom panel shows that in two of the three cases, the long axis of the satellite system is well aligned with the long axis of the dark halo. This is consistent with the conclusions reached by Libeskind et al. (2005) from their (discless) dark matter simulations. The lack of alignment in system gh2 is probably due to the fact that this has the least aspherical dark halo whose long axis is therefore poorly determined.

5 Alignment of the angular momenta
In this section, we extend our study of alignments to include the possible correlations between the angular momenta of the dark matter halo, , the satellite galaxy population, , and the stars of the central galaxy, . Unless otherwise noted, we consider a number-weighted mean angular momentum, . For the dark matter halo and the central galaxy whose particles all have roughly the same mass, this “specific” angular momentum is approximately proportional to the standard, mass-weighted angular momentum (). For a satellite system, however, this definition gives equal weight to each satellite, preventing the statistics from becoming dominated by one or two very large satellites.
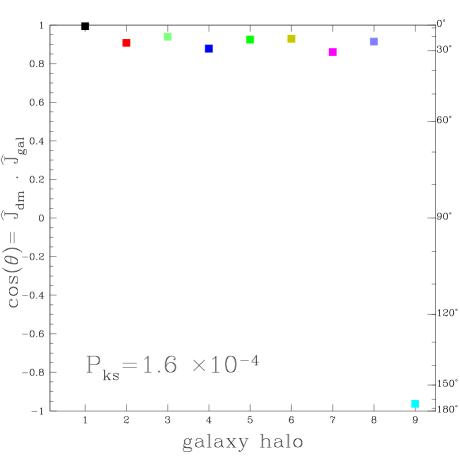
The angle between and evaluated for all the material within the virial radius, is plotted in Fig. 8. Since the number of satellites is immaterial in this case, we expand our sample to include the six other galactic systems (identified according to the criteria outlined in Sec. 2.2) that were excluded from the satellite analysis in the preceeding section. The angular momenta of the galaxy and the dark matter within the virial radius are aligned to within , i.e. the galaxy spins in essentially the same direction as the dark matter halo. The single exception is system gh9 in which the galaxy and the dark matter are counter-rotating. A KS test shows that the probability of obtaining the distribution of cos shown in the figure from nine objects drawn at random from a larger sample of randomly oriented galaxies is only . We conclude that there is a significant alignment between the angular momenta of the galaxy and that of the dark halo it inhabits. This is consistent with the acquisition of angular momentum prior to the collapse of the system, when dark matter and gas were well mixed, as expected in the tidal torque theory (e.g. White 1984) and as usually assumed in semi-analytic models of galaxy formation (e.g. Cole et al. 2000).
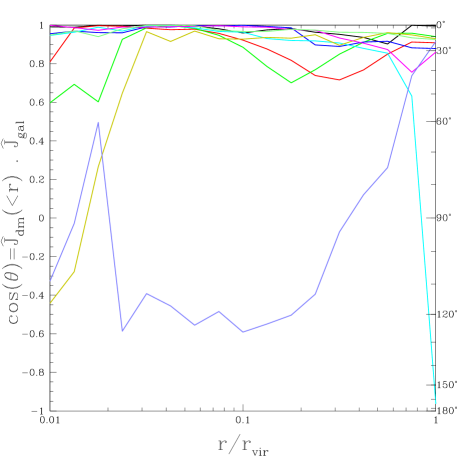
The radial dependence of the galaxy-halo spin alignment is shown in Fig. 9 where we plot the cosine of the angle between and for our nine systems. In 7 out of 9 cases, the alignment persists out to the virial radius of the halo, never straying much beyond . The two exceptions are systems gh9 and gh8. In the first of these, a tight alignment persists for , but it rapidly disappears beyond this radius. A visual inspection of this system shows that the reason for the rapid change in spin direction is simply the presence of a large counter-rotating fragment of dark matter in the outer parts of the halo which has recently been accreted, causing the halo angular momentum to flip in the outer parts. The other anomalous system owes its strange behaviour to the fact that the galaxy is almost a pure spheroid with very little angular momentum and for which the direction of is poorly defined.
Previous studies (e.g. Warren et al. 1992, Bailin & Steinmetz 2005) have found that the halo angular momentum, , tends to be aligned with the halo minor axis, . The simulations of Warren et al. (1992) clearly show such an alignment in the inner parts of the dark halo. Bailin & Steinmetz (2005; see their Fig. 16) demonstrate that the alignment becomes weaker with radius but is still significant () at the virial radius. By contrast, Bailin et al. (2005) report an absence of alignment between and at the virial radius in seven hydrodynamic simulations. We now consider the angle subtended by and in our own simulations.
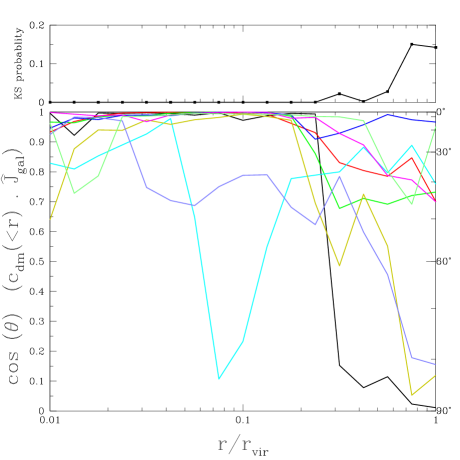
In Fig. 10 we plot the angle between and for all the material within the virial radius and, in Fig. 11, the run of this angle with radius. We also plot the KS probability that the distribution of angles in the nine systems at each radius is consistent with a uniform distribution.
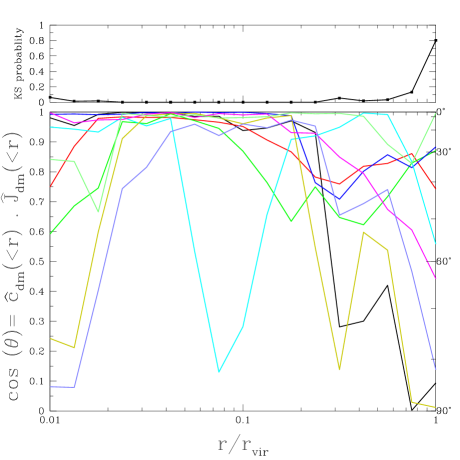
Our results are qualitatively in good agreement with both Warren et al. (1992) and Bailin & Steinmetz (2005). The radial dependence of , displayed in Fig. 11, shows that, apart from one anomalous system, gh9, there is a good alignment between these two vectors in the inner parts of the halo, within a few tenths of . In the outer parts the correlation becomes much weaker, which is perhaps not surprising for systems whose shape is supported by an anisotropic velocity dispersion tensor rather than by rotation (Frenk et al. 1985; Warren et al. 1992). While Warren et al. (1992) and Bailin & Steinmetz (2005) find a weak correlation at the virial radius our small sample of 9 halos is consistent with no correlation. Thus, the KS probability that the cosine of the angle for these 9 halos is consistent with a uniform distribution jumps from at to at .
Turning to the galaxies, Fig. 10 shows that in all but two of them, the angular momentum vector points in the direction of the shortest galactic axis, as expected for systems flattened by rotation. Of the two discrepant galaxies, gh8 is a nearly perfect spheroid with very little rotation while gh9 is a rapidly rotating spheroid, whose angular momentum is dominated by the bulge’s bulk rotation.
The orientation of the galaxy and its host halo is displayed in Fig. 12 where we plot the angle between and as a function of radius. Since is always parallel to , this is equivalent to plotting the angle between and . Apart, again, from the anomalous gh9, the angular momentum vector of the galaxy points along the short axis of the halo in the inner parts of the system. This alignment begins to weaken beyond , but even at the KS probability is consistent with a uniform distribution only at the % level. Our results agree well with those of Bailin et al. (2005) in the inner parts of the halo, but they are marginally inconsistent at the virial radius where their small sample of objects has a distribution of cosines consistent with uniform.
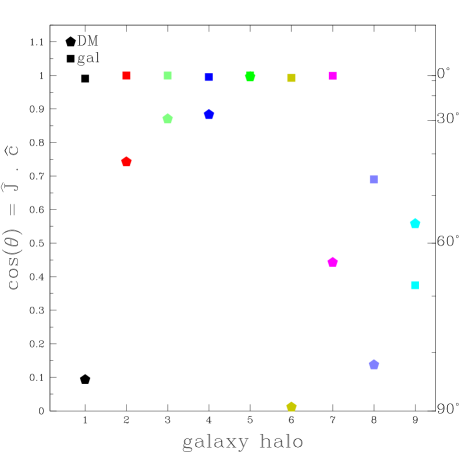
We now turn to the alignment of the angular momentum of the satellite system with those of the galaxy and the dark matter halo. In this case, we can use only the three systems with a large satellite population. The results are plotted Fig. 13(a) as filled and empty squares.

For all three systems, there is some alignment (within ) between the spin vectors of the satellite systems and the dark halo. However, in only one case (gh3) is the spin of the satellites aligned with that of the galaxy.
Finally, we ask whether the net angular momentum of the satellite system is related to the shape of the system, i.e. whether the satellites tend to orbit in the approximate plane that they define. If this were the case, we would expect to point along the short axis of their distribution, . In fact, this is not what we find. tends to point in a direction which, while often approximately at right angles to , the long axis of the satellite system (Fig. 13(b)), it is nevertheless not along the short axis of the system, . This arrangement is illustrated schematically in Fig. 14 where the blue ellipsoid demarks the structure defined by the anisotropic satellite distribution, while the spin axis, , is shown as a red line and its three projections along the three principal axes of the satellite structure are shown as black lines.
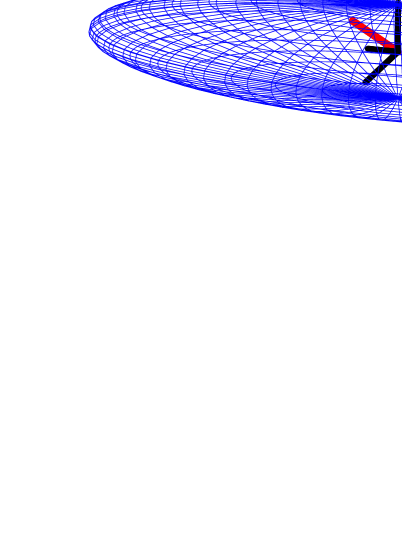
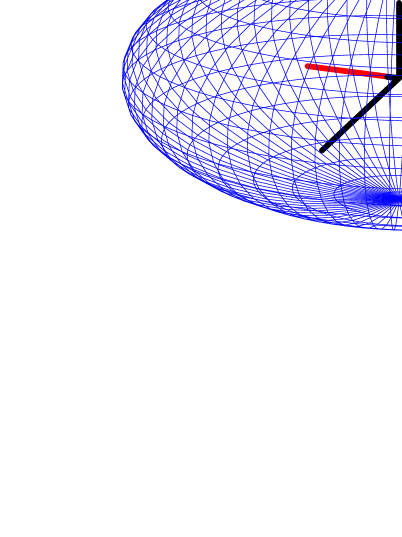
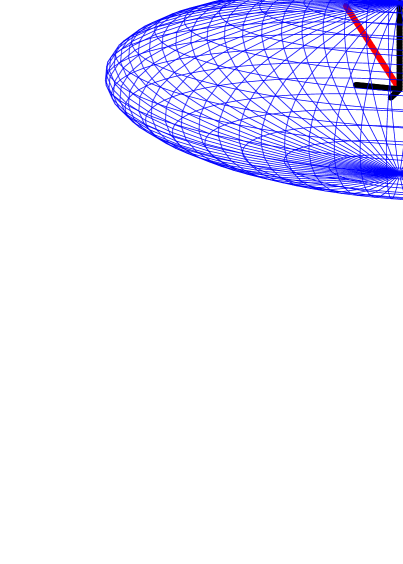
From Fig. 13(b) we find that in all three cases the angular momentum of the satellite system subtends an angle greater than with the long axis of the satellite distribution, indicating that the satellites are not orbiting in the apparent plane defined by their spatial distribution. However, there is little consistency amongst the 3 galactic systems which exhibit a variety of orientations and alignments.
6 Conclusion and discussion
We have analyzed two N-body/SPH simulations of galaxy formation in a CDM universe, one of a single bright galaxy and the other of a small region. Our simulations include the main physical processes thought to be important in galaxy formation: metal-dependent gas cooling, heating by photoionizing the primordial hydrogen gas, star formation, metal production and feedback due to supernovae energy injection. In total, we obtained a sample of 9 bright galaxies comparable in luminosity to the Milky Way, containing a total of 78 satellites. Three of the central galaxies had a population of at least 11 satellites, the number of well-studied satellites in the Milky Way. We have used these samples to investigate several interrelated properties of the satellite population.
We first investigated the luminosity function of satellites, a property often regarded as a challenge to the cold dark matter model (e.g. Moore et al. 1999). We find, however, that our simulations produce an excellent match to the observed luminosity function of satellites in the Local Group, at least to the resolution limit of the calculation which corresponds to , close to the luminosity of the faintest observed satellites. The gas fractions in these satellites agree well with observations, suggesting that their formation paths may be similar to those of real satellites. Many of the small subhalos resolved in the simulations fail to make a substantially bright satellite. As Benson et al. (2002b) have argued, star formation is inefficient in small subhalos due to the combined effects of reionization and supernovae feedback which limit the supply of cool gas to the subhalo.
The match of our simulations to the satellite data over most of the observed range suggests that the relative paucity of satellites in the Local Group (the “satellite problem”) does not reflect the much larger abundance of subhalos, but rather feedback effects that limit the growth of small galaxies. Furthermore, Benson et al. (2002b) and Stoehr et al. (2002) have argued that the internal dynamics of CDM satellites are also consistent with the data. Overall, our results agree well with the semi-analytic model of Benson et al. (2002b). In the semi-analytic model, however, bright satellites, of luminosity similar to the LMC or M33, were rare. This is not the case in our simulations which match the bright end of the satellite luminosity function well. The differences between the two treatments are no doubt due to the different ways in which the physics of galaxy formation are modelled, including differences in the treatment of feedback and star formation and in the satellite merger rates.
We next considered the spatial distribution of the satellites. In the outer half of the system, the number density profile of the satellites tracks the dark matter well but in the inner parts it falls below the dark matter profile. Remarkably, the number density profile of the 11 brightest satellites in one of our simulations is almost indistinguishable from the profile for the 11 brightest satellites of the Milky Way. The profiles of the other 2 well populated systems are broadly similar, as is the profile for the satellites of M31. As in previous N-body studies (e.g. Gao et al. 2004; Libeskind et al. 2006; Shaw et al. 2006), we find no resolved satellites in the inner of the halo.
We can study the distribution of individual satellite systems, particularly their alignments with the halo and disc, for the three systems that formed more than 11 satellites. In agreement with previous purely N-body studies (Libeskind et al. 2005, Zentner et al. 2005), we find that the satellites tend to be distributed in a highly flattened configuration whose major axis is aligned with the major axis of the (generally triaxial) dark halo. Libeskind et al. (2005) argued that this arrangement reflects the preferential infall of satellites along the spine of the filaments of the cosmic web. Our gasdynamic simulations allow us to go further than previous N-body work and investigate the alignment of satellite systems with galactic discs and the alignment of the latter with the dark matter halo. We find that in 2 out or 3 systems, the satellite system is nearly perpendicular (to within ) to the plane of the galactic disc. This surprising configuration is exactly what is seen in the Milky Way. The third satellite system ended up well aligned with the disc.
To investigate these alignments further, we calculated the relationship between the disc and the halo, this time using the 9 bright galaxies in our simulations. Previous hydrodynamic simulations have found a good alignment between the disc and the principal plane of the halo (i.e. a good correlation between the directions of the disc axis and the halo minor axis), but only in the inner of the halo (Kazantzidis et al. 2004; Bailin et al. 2005). Beyond this, these studies find little or no correlation. We also find a good alignment in our simulations between the disc and the halo at small radii but, unlike in the previous studies, the correlation persists, albeit much weakened, out to the virial radius. This sort of alignment is perhaps not unexpected in the simplest interpretation of the tidal torque theory since both the dark halo and the baryon component experience similar tidal torques. The relatively small differences between our results and those of Kazantzidis et al. (2004) and Bailin et al. (2005) are most likely the result of different treatments of star formation and feedback. For example, the strong feedback in our simulations at early times which leads later to a prolonged period of gas accretion and the formation of a large disc in a relatively quiet halo favours the persistence of a relationship between the properties of the halo and the disc.
Of the two cases in which the satellite systems are nearly perpendicular to the disc, in the one which exhibits the strongest alignment (gh1) the disc is also nearly perpendicular to the minor axis of the halo. In the other case, the alignment between the disc and the halo is weaker. In the third system (gh3), in which the satellite system lies in the plane of the disc, the disc is only roughly aligned with the halo. Although our sample is small, it suggests that it should not be surprising that similar kinds of alignments are found in observational studies of satellites in the SDSS and 2dFGRS (Brainerd 2005, Yang et al. 2005, Sales & Lambas 2004).
Finally, we investigated the connection between the angular momenta of the disc and the dark halo. For most systems, the two vectors are very well aligned as a function of radius, out to the edge of the system. The halo spin tends to be point along the short axis of the halo. However, since the shape of the halo varies with redshift, the spin axis of the disc or of the halo can often loose its alignment with the short halo axis. Thus, care should be taken when interpreting alignment statistics, either in simulations or in observational data.
In conclusion, our simulations have revealed a number of interesting connections between the properties of central galaxies, their satellite systems and their dark matter halos. They also point to a good overall match between predictions of the CDM model and the observations of galaxy satellite systems that we have considered here such as the luminosity function and the peculiar spatial arrangement of the satellites of the Milky Way. However, due to their high computational cost, our simulations are still too small to provide good statistics. Larger simulations of this kind are required to test the validity of the trends that we have found.
References
- Aarseth et al. (1979) Aarseth S. J., Turner E. L., Gott J. R. III, 1979, ApJ, 228, 664
- Abadi et al. (2003) Abadi M. G., Navarro J. F., Steinmetz M., Eke V. R., 2003, ApJ, 597, 21
- Bailin et al. (2005) Bailin J., Kawata D., Gibson B. K., Steinmetz M., Navarro J. F., Brook C. B., Gill S. P. D., Ibata R. A., Knebe A., Lewis G. F., Okamoto T., 2005, ApJ, 627,17
- Bailin & Steinmetz (2005) Bailin J., Steinmetz M., 2005, ApJ, 627, 647
- Baugh et al. (2005) Baugh C. M., Lacey C. G., Frenk C. S., Granato G. L., Silva L., Bressan A., Benson A. J., Cole S., 2005, MNRAS, 356, 1191
- Benson et al. (2002b) Benson A. J., Frenk C. S., Lacey C. G., Baugh C. M., Cole S., 2002, MNRAS, 333, 177
- Benson et al. (2002a) Benson A. J., Frenk C. S., Lacey C. G., Baugh C. M., Cole S., 2002, MNRAS, 333, 156
- Bond et al. (1991) Bond J. R., Cole S., Efstathiou G., Kaiser N., 1991, ApJ, 379, 440
- Bower (1991) Bower R. G., 1991MNRAS, 248, 332
- Brainerd (2005) Brainerd T. G., 2005, ApJ, 628, L101
- Bullock et al. (2000) Bullock J. S., Kravstov A. V., Weinberg D. H., 2000, ApJ, 539, 517
- Cole et al. (2000) Cole S., Lacey C. G., Baugh C. M.. Frenk C. S., 2000 MNRAS, 319, 168
- Craig & Davis (2001) Craig M. W., Davis M., 2001, New Astron, 6, 425
- Davis et al. (1985) Davis M., Efstathiou G., Frenk C. S., White S. D. M., 1985, ApJ, 292, 731
- Eke, Efstathiou & Wright (2000) Eke V. R., Efstathiou G., Wright L., 2000, MNRAS, 315, L18
- Fall & Efstathiou (1980) Fall S. M., Efstathiou G., 1980, MNRAS, 193, 189
- Frenk, White & Davis (1983) Frenk C. S., White S. D. M., Davis M., 1985, Apj, 271, 417
- Frenk et al. (1985) Frenk C. S., White S. D. M., Efstathiou G., Davis M., 1985, Nature, 317, 595
- Frenk et al. (1996) Frenk C. S., Evrard A. E., White S. D. M., Summers F. J., 1996, ApJ, 472, 460
- Gao et al. (2004) Gao L., White S. D. M., Jenkins A., Steohr F., Springel V., 2004, MNRAS, 355, 819
- Ghigna et al. (1998) Ghigna S., Moore B., Governato F., Lake G., Quinn T., Stadel J., 1998, MNRAS, 300, 146
- Gnedin (2000) Gnedin N. Y., 2000, ApJ, 542, 535
- Governato et al. (2004) Governato F., Mayer L., Wadsley J., Gardner J. P., Willman B., Hayashi E., Quinn T., Stadel J., Lake G., 2004, ApJ, 607, 688
- Haardt & Madau (1996) Haardt F., Madau P., 1996, ApJ, 461, 20
- Hawley & Peebles (1975) Hawley D. L., Peebles P. J. E., 1975, AJ, 80, 477
- Helly et al. (2003) Helly J. C., Cole S., Frenk C. S., Baugh C. M., Benson A., Lacey C., 2003, MNRAS, 338, 903
- Holmberg (1969) Holmberg E., 1969, Arkiv Astron., 5, 305
- Kang et al. (2005) Kang X., Mao S., Gao L., Jing Y. P., 2005,A&A, 437, 383
- Kamionkowski & Liddle (2000) Kamionkowski M., Liddle A. R., 2000, Phys. Rev. Lett., 84, 4525
- Kauffmann et al. (1993) Kauffmann G., White S. D. M., Guiderdoni B., 1993, MNRAS, 264, 201
- Kawata & Gibson (2003) Kawata D., Gibson B. D., 2003, MNRAS, 340, 908.
- Kazantzidis et al. (2004) Kazantzidis S., Kravtsov A. V., Zentner A. R., Allgodd B., Nagai D., Moore B., 2004 ApJ, 611, L73
- Salpeter (1955) Salpeter E. E., 1955, ApJ, 121, 161
- Klypin et al. (1999) Klypin A., Kravstov A. V., Valenzuela O., Prada F., 1999 ApJ, 522, 82
- Knebe et al. (2004) Knebe A., Gill S. P. D., Gibson B. K., Lewis G. F., Ibata R. A., Dopita M. A., 2004, ApJ, 603,7
- Kroupa et al. (2005) Kroupa P., Thies C., Boily C. M., 2005, A&A, 431, 517
- Kunkel & Demers (1976) Kunkel W. E., Demers S., 1976, R. Greewhich Obser. Bull., 182, 241
- Lacey & Cole (1993) Lacey C., Cole S., 1993, MNRAS, 262, 627
- Libeskind et al. (2005) Libeskind N. I., Frenk C. S., Cole S., Helly J. C., Jenkins A. R., Navarro J. F., Power C. B., 2005, MNRAS, 363, 146
- Libeskind et al. (2006) Libeskind N. I., Cole S. Frenk C. S., Helly J. C., 2006, MNRAS, 368, 138
- Lynden-Bell (1976) Lynden-Bell D., 1976, MNRAS,174,695
- Lynden-Bell (1982) Lynden-Bell D., 1982, Obs, 102, 202
- MacGillivray et al. (1982) MacGrillivray H. T., Dodd R. J., McNally B. V., Corwin H. G., 1982, MNRAS, 198, 605
- Marigo (2001) Marigo P., 2001, A&A 370, 194
- Mateo (1998) Mateo M., 1998, ARA&A,36,435
- McGaugh (2005) McGaugh S. S., 2005, ApJ, 632, 859
- Moore et al. (1999) Moore B., Ghinga S., Governato F., Lake G., Quinn T., Stadel J.,Tozzi P., 1999, ApJ,524, L19
- Moore et al. (2000) Moore B., Gelato S., Jenkins A., Pearce F. R., Quilis V., 2000,ApJ, 535, 21
- Nagashima et al. (2005a) Nagashima M., Lacey C. G., Okamoto T., Baugh C. M., Frenk C. S., Cole S., 2005a, MNRAS, 363, L31
- Nagashima et al. (2005b) Nagashima M., Lacey C. G., Baugh C. M., Frenk C. S., Cole S., 2005b, MNRAS, 358, 1247
- Navarro & Benz (1991) Navarro J., Benz W., 1991, ApJ, 380, 320
- Navarro, Frenk & White (1995) Navarro J. F., Frenk C. S., White S. D. M., 1995, MNRAS, 275, 720
- Navarro, Frenk & White (1996) Navarro J. F., Frenk C. S., White S. D. M., 1996, ApJ, 462, 563
- Navarro, Frenk & White (1997) Navarro J. F., Frenk C. S., White S. D. M., 1997, ApJ, 490, 493
- Okamoto et al. (2005) Okamoto T., Eke V. R., Frenk C. S., Jenkins A., 2005, MNRAS, 363, 1299
- Portinari, Chiosi, & Bressan (1998) Portinari L., Chiosi C., Bressan A., 1998, A&A, 334, 505
- Peebles (1971) Peebles P. J. E., 1971, A&A, 11, 337
- Peñarrubia et al. (2002) Peñarrubia J., Kroupa P., Boily C. M., 2002, MNRAS, 333, 779
- Robertson et al. (2004) Robertson B., Yoshida N., Springel V., Hernquist L., 2004, ApJ, 606, 32
- Sales & Lambas (2004) Sales L., Lambas D. G., 2004, MNRAS, 348, 1236
- Sharp, Lin & White (1979) Sharp N. A., Lin D. N. C., White S. D. M., 1979, MNRAS 187, 287
- Shaw et al. (2006) Shaw L. D., Weller J., Ostriker J. P., Bode P., 2006 ApJ submitted (pre-print astro-ph/0603150)
- Sommer-Larsen, Gotz & Portinari (2003) Sommer-Larsen, Jesper; Gotz, M., Portinari, L., 2003, ApJ, 596, 47S
- Sommer-Larsen, Gelato & Vedel (1999) Sommer-Larsen J., Gelato S., Vedel H., 1999, ApJ, 519, 501
- Spergel & Steinhardt (2000) Spergel D. N., Steinhardt P. J., 2000, Phys. Rev. Lett., 84, 3760
- Springel et al. (2001) Springel V., White S. D. M., Tormen G., Kauffmann G., 2001, MNRAS, 328, 726
- Springel & Hernquist (2003) Springel V., Hernquist L., 2003, MNRAS, 339, 289
- Springel (2005) Springel V., 2005, MNRAS, 364, 1105
- Springel et al. (2006) Springel V., White S. D. M., Frenk C. S., 2006, Nature, 440, 1137
- Stanimirovi et al. (2004) Stanimirovi S., Staveley-Smith L., Jones P. A., 2004, ApJ, 604, 176
- Staveley-Smith et al. (2003) Staveley-Smith L., Kim S., Calabretta M. R., Haynes R. F., Kesteven M. J., 2003, MNRAS, 339, 87
- Stoehr et al. (2002) Stoehr F., White S. D. M., Tormen G., Springel V., 2002, MNRAS, 335, L84
- Sutherland & Dopita (1993) Sutherland R. S., Dopita M. A., 1993, ApJS, 88, 253
- Warren et al. (1992) Warren M. S., Quinn P. J., Salmon J. K., Zurek W. H., 1992, ApJ, 399, 405
- Wechsler et al. (2004) Wechsler R. H., Bullock J. S., Primack J. R., Kravtsov A. V., Dekel A., 2002, ApJ, 568, 52
- Weil, Eke & Efstathiou (1998) Weil M. L., Eke V. R., Efstathiou G., 1998, MNRAS, 300, 773
- White (1984) White S. D. M., 1984, ApJ, 286, 38
- White & Rees (1978) White S. D. M., Rees M. J., 1978, MNRAS, 183, 341
- Yang et al. (2005) Yang X., van den Bosch F. C., Mo H. J., Mao S., Kang X., Weinmann S. M., Guo Y., Jing Y. P., 2005, MNRAS, 362, 711
- Yoshida et al. (2000) Yoshida N., Springel V., White S. D. M., Tormen G., 2000, ApJ, 544, 87
- Zaritsky et al. (1997) Zaritsky D., Smith R., Frenk C. S., White S. D. M. 1997, ApJ, 478, L53
- Zentner et al. (2005) Zentner A. R., Kravstov A. V., Gnedin O. Y., KLypin A. A., 2005 ApJ, 629, 219
- Zhao et al. (2003) Zhao D. H., Mo H. J., Jing Y. P., Börner G., 2003, MNRAS, 339, 12