The luminosities, sizes and velocity dispersions of Brightest Cluster Galaxies: Implications for formation history
Abstract
The size-luminosity relation of early-type Brightest Cluster Galaxies (BCGs), , is steeper than that for the bulk of the early-type galaxy population, for which . This is true if quantities derived from either deVaucouleur or Sersic fits to the surface brightness profiles are used. Contamination from an intra-cluster light component centered on the BCG, with similar parameters to what has been seen in some recent studies, is not able to account for this difference. In addition, although BCGs are hardly offset from the Fundamental Plane defined by the bulk of the early-type population, they show considerably smaller scatter. The larger than expected sizes of BCGs, and the increased homogeneity, are qualitatively consistent with models which seek to explain the colors of the most massive galaxies by invoking dry dissipationless mergers, since dissipation tends to reduce the sizes of galaxies, and wet mergers which result in star formation would tend to increase the scatter in luminosity at fixed size and velocity dispersion. Furthermore, BCGs define the same color-magnitude relation as the bulk of the early-type population. If BCGs formed from dry mergers, then BCG progenitors must have been red for their magnitudes, suggesting that they hosted older stellar populations than typical for their luminosities. Our findings have two other consequences. First, the relation of the early-type galaxy population as a whole (i.e., normal plus BCG) exhibits some curvature: the most luminous galaxies tend to have larger sizes than expected from the scaling—some of this curvature must be a consequence of the fact that an increasing fraction of the most luminous galaxies are BCGs. The second consequence is suggested by the fact that, despite following a steeper size-luminosity relation, BCGs tend to define a tight relation between dynamical mass and luminosity. Although this relation is slightly different than that defined by the bulk of the population, the fact that their sizes are large for their luminosities suggests that their velocity dispersions are small. We find that, indeed, BCGs define a shallower relation than the bulk of the early-type galaxy population. This shallower relation suggests there may be curvature in the correlation between black hole mass and velocity dispersion; simple extrapolation of a single power law relation to large will underestimate .
Subject headings:
galaxies: elliptical — galaxies: evolution — galaxies: fundamental parameters — galaxies: photometry — galaxies: stellar content1. Introduction
Understanding why massive early-type galaxies are red and dead has proved to be difficult; the problem is to arrange for star formation to occur at higher redshift than the actual assembly of the stars into a single massive galaxy. The most recent galaxy formation models arrange for this to happen by a combination of two processes: dry mergers and AGN feedback (Hopkins et al. 2005; Croton et al. 2005; De Lucia et al. 2005; Robinson et al. 2006; Bower et al. 2006). The dry merger hypothesis assumes that the assembly of massive galaxies occurs by merging smaller progenitor systems of old stars without additional star formation (which would otherwise lead to bluer colors). This happens either because the merging units were themselves gas poor, or because AGN feedback has prevented the hot gas reservoirs of the progenitors from cooling and forming stars after the merger. Together, these processes allow massive galaxies to be built from smaller systems while still remaining red.
The dry merger hypothesis is most necessary for the most massive galaxies. These tend to be the brightest galaxies in clusters (BCGs). Our primary focus will be the sizes of these BCGs, although we also study a number of other scaling relations. This is because, in a ‘wet’ merger, gas from the merging components is able to dissipate energy, cool, contract and eventually make new stars. Dry mergers on the other hand have no energy loss mechanism (other than dynamical friction); having suffered less dissipation, their stellar components are not as centrally contracted, so the optical sizes of dry merger products are expected to be larger than if the mergers were wet (e.g. Kormendy 1989; Capelato et al. 1995; Nipoti et al. 2003), although the sizes may also reflect the orbital parameters of the mergers which formed the BCG (e.g. Boylan-Kolchin et al. 2006).
The structural properties of BCGs have been the object of much previous work. Compared to normal early type galaxies, BCGs have larger than expected radii for their surface brightnesses (Thuan & Romanishin 1981; Hoessel et al. 1987; Schombert 1987, 1988; Oegerle & Hoessel 1991), and smaller than expected velocity dispersions for their luminosities (Malumuth & Kirshner 1981, 1985; Oegerle & Hoessel 1991). Crawford et al. (1999) describe the results of an extensive study of the spectra of X-ray selected BCGs, and Brough et al. (2005) find that BCGs of X-ray luminous clusters tend to be have larger than expected sizes. With the exception of Crawford et al., these studies were based on sample sizes of order 50 or smaller, so it is interesting to ask if the larger samples now available show the same trends.
We will study the objects which are identified as BCGs in the C4 cluster catalog of Miller et al. (2005). This catalog is complete out to , contains about 700 BCGs, and will contain about 1500 BCGs by Fall 2006. Section 2 describes the sample and provides a brief summary of our fits to the photometric properties of BCGs and normal early-type galaxies. Details are provided in Hyde et al. (2006). These new fits were necessary, as the SDSS photometric reductions of objects in crowded fields suffer from sky subtraction problems (e.g. Hyde et al. 2006, Lauer et al. 2006). In Section 3 we compare a variety of BCG scaling relations to those of the bulk of the early-type galaxy population. This section shows that BCGs define a steeper size-luminosity relation than does the bulk of the early-type galaxy population; that although BCGs have larger than expected sizes, they still define a tight relation between luminosity and dynamical mass , and so the relation of BCGs curves away from the power-law scaling defined by the bulk of the early-type galaxy population. It also shows the location of BCGs in the same Fundamental Plane defined by normal early-type galaxies, and shows that they define the same color-magnitude relation as normal early-type galaxies. Appendix A presents a comparison with the color-magnitude relation predicted by the semi-analytic galaxy formation models of Croton et al. (2006) and Bower et al. (2006).
Section 4 studies two systematic errors which might have caused the steeper relation we see, and concludes that they are probably not to blame. The first possibility is that the deVaucouleur fit is systematically worse for BCGs than it is for the bulk of the population. The second possibility is more subtle. Galaxy clusters contain a substantial population of stars which are not associated with a galaxy (e.g. Gonzalez et al. 2005; Zibetti et al. 2005). So it is not unreasonable to ask if this intracluster light is contaminating our estimates of the sizes and luminosities of BCGs, and hence the inferred and relations.
At the very largest luminosities (), the relation of the early-type galaxy population (normal + BCG) appears to curve upwards toward larger sizes from the scaling. If an increasing fraction of these objects are BCGs, then this curvature is not unexpected in view of our finding that BCGs follow a steeper size-luminosity relation. Appendix B presents evidence that, at large luminosities, an increasing fraction of galaxies are indeed BCGs. However, our results do not exclude the possibility that there is, in addition, intrinsic curvature in the relation of early-types which are not BCGs.
A final section summarizes our findings and discusses the implications for galaxy formation models, and for studies which seek to estimate the mass of a supermassive black hole from the stellar velocity dispersion of the bulge which surrounds it. Where necessary, we assume a flat cosmological model with , and km s-1Mpc-1.
2. Sample selection and fits to light profiles
We have selected the objects identified as BCGs in the C4 cluster catalog of Miller et al. (2005). This catalog was based on the Second Data Release of the SDSS: DR2. Of the 748 BCGs in the catalog, spectra are available for 580 (fiber collisions mean some BCGs were missed). Some of these are duplicates (i.e. some clusters were listed more than once), and the number which are matched to a parent catalog based on SDSS DR4 is 403. Of these, a visual inspection of the fields centred on C4 BCGs fainter than often showed a brighter galaxy nearby, especially when the C4 BCG was a spiral. If we restrict attention to objects with , then 286 have SDSS reported velocity dispersions, and have at least 10 other luminous galaxies () within Mpc. The SDSS does not estimate velocity dispersions from spectra which have strong emission lines, so our requirement that the SDSS reports a velocity dispersion means that the objects we select are almost certainly not AGN. Removing the final cut on ‘richness’ increases the sample of BCGs to 324, but does not change the results which follow.
Visual inspection of the SDSS images of these objects shows that 25% actually have spiral arms; the absence of emission lines in the spectra of these objects is presumably because the SDSS fiber, with a radius of 1.5 arcsec, only sees the inner bulge. In what follows, we will be careful to distinguish the scaling relations of the genuine early-type BCGs from the rest.
It happens that BCGs are a class of object for which the SDSS photometric reductions are particularly unreliable: the reported magnitudes are in error by far more than the quoted 0.02 mags, with some discrepancies as large as 1 mag (Hyde et al. 2006). This is due to a combination of factors: because BCGs are often in crowded fields, the SDSS reductions tend to overestimate the sky level. This results in underestimates of the BCG magnitude and half-light radius, which are particularly severe for BCGs with large half-light radii. In addition, the surface brightness distributions of BCGs do not always follow pure single component deVaucouleurs profiles, which the SDSS reductions assume. For these reasons, we have performed our own photometric reductions, and examined the image of each BCG by eye. A more detailed discussion of the various issues involved is provided by Hyde et al. (2006), whose results we use below.
Because we will be interested in comparing the properties of BCGs to those of other early-type galaxies, we have also reanalyzed the photometric properties of the sample of SDSS early-type galaxies defined in Bernardi et al. (2003a). It is these parameters (i.e. those based on Hyde et al. 2006), rather than those output from the SDSS pipeline, which we use in what follows. On average, the Hyde et al. magnitudes are 0.1 mags brighter than those reported by the SDSS DR4 pipeline, and the sizes are about 10% smaller. In crowded fields, and especially for bright objects, Hyde et al. report both brighter magnitudes and larger sizes than does the SDSS. When comparing the scaling relations of these objects with those for the C4 BCGs, we restrict the redshift range to that over which the C4 catalog is complete (; except for the Fundamental Plane, this restriction makes little difference).
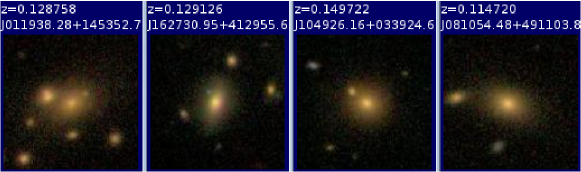
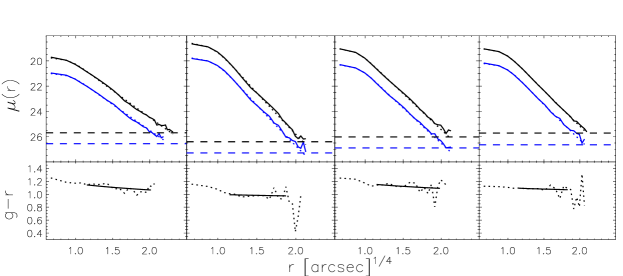
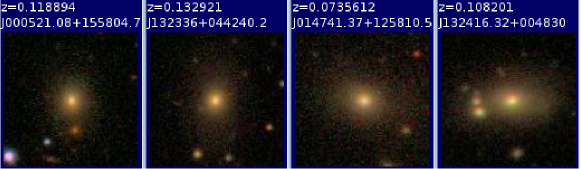
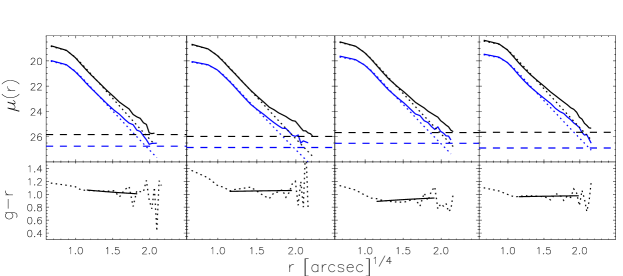
The most important finding of this reanalysis of BCG photometry is that there appear to be two classes of early-type BCG light profiles. Examples of these two types are shown in Figures 1 and 2. The first type is well fit by a single component deVaucouleurs profile, whereas the second is not. This second type of profile is similar to that associated with cD galaxies. Section 4 discusses these two profile types in more detail. Meantime, we will be careful to treat these two populations separately in what follows.
3. BCG scaling relations
3.1. The size-luminosity relation of BCGs
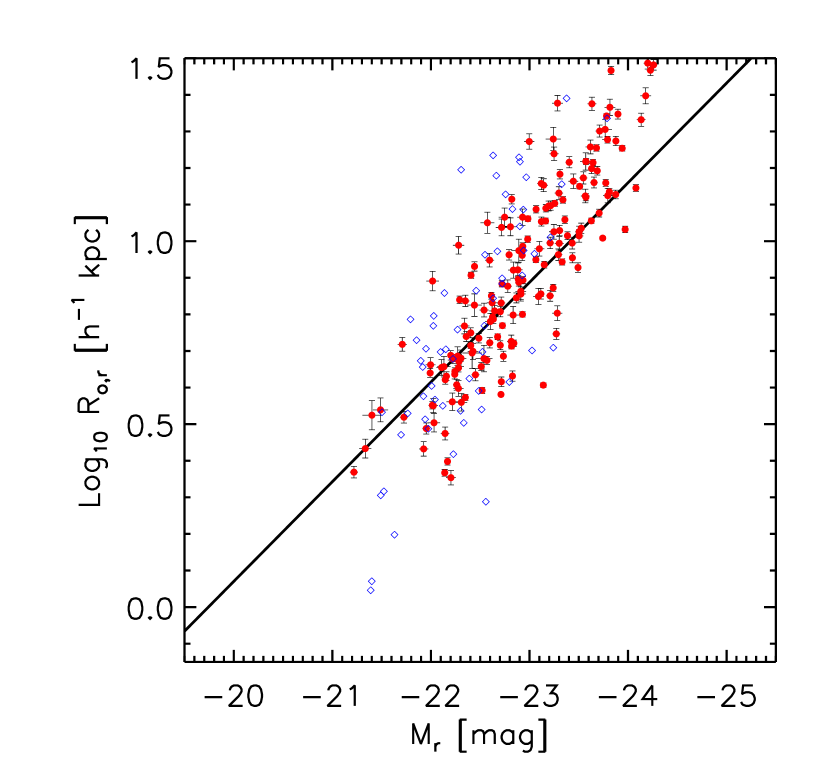
Figure 3 shows the correlation between luminosity and half-light radius for the C4 BCGs: diamonds represent objects with spiral morphologies, and filled circles represent E/S0s. Solid line shows the relation defined by the bulk of the early-type galaxy population—BCGs clearly define a steeper relation. (The steeper relation is also seen if we use the original SDSS photometric reductions which we believe to be incorrect—see bottom right panel of Figure 13.) In what follows, we focus on the early-type BCGs, but note that the spiral BCGs define an relation that is at least as steep.
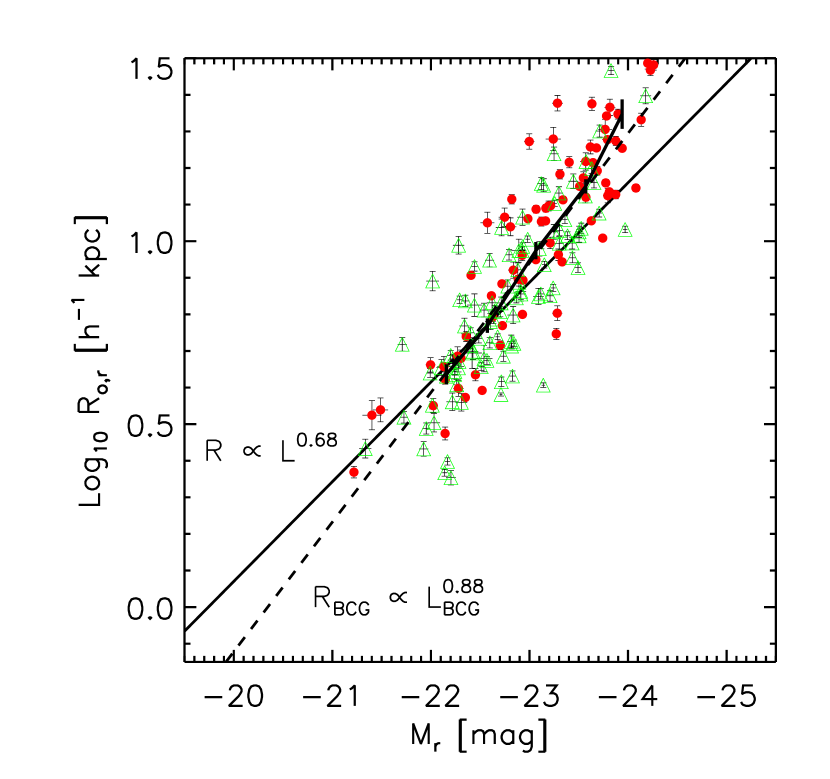
Figure 4 shows the relation for the early-type BCGs, now subdivided by whether (filled circles) or not (open triangles) the surface brightness profile is well fit by a single deVaucouleurs profile. Jagged solid line shows the median BCG size (whether or not it is well-fit by a deVaucouleur profile) in a few bins in luminosity, and dashed line shows a power-law fit to the size-luminosity relation for these BCGs:
| (1) |
This fit should be compared to the straight solid line which shows the scaling that provides a good description of the bulk of the early-type galaxy population:
| (2) |
Clearly, BCGs define a steeper relation—they have larger sizes than do normal early-type galaxies of similar luminosity. This trend is consistent with the hypothesis that BCGs have formation histories with less dissipation than the bulk of the early-type population.
The fits above are based on the photometric reductions described by Hyde et al. (2006). Using the SDSS photometry (deVaucouleur magnitudes and sizes) instead gives
for the BCGs and
for the total early-type galaxy population.
3.2. The mass-luminosity relation
The larger than expected sizes of BCGs have interesting consequences. If these objects are virialized, then one expects a relatively tight correlation between luminosity and the dynamical mass . Figure 5 shows that this correlation is indeed rather tight—the inset shows that BCGs define a tighter relation than does the bulk of the early-type galaxy population. This smaller scatter is also consistent with dry-merger formation histories; one might have expected ‘wet’ mergers to result in star formation, which would increase the scatter in luminosities at fixed dynamical mass.
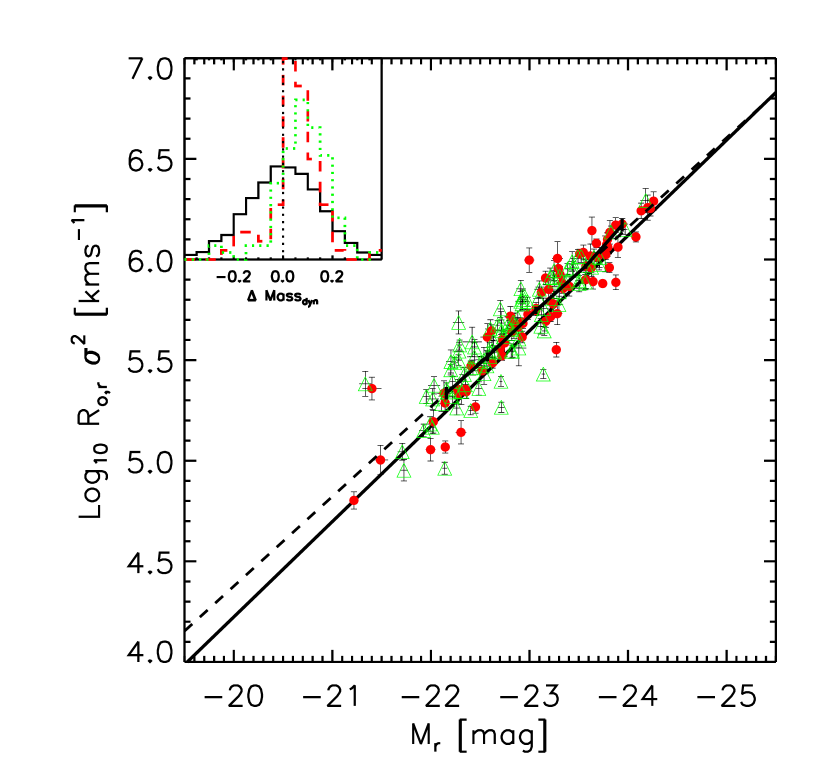
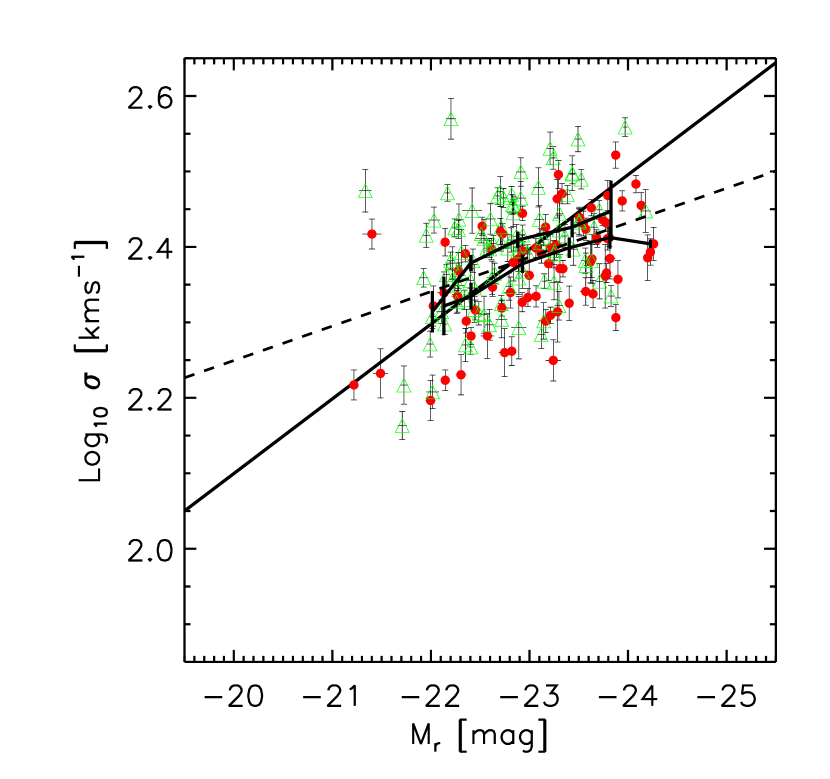
Figure 5 also shows that BCGs define a slightly different correlation between luminosity and than does the total early-type galaxy population. The actual relations are
| (3) |
with a scatter around the relation of 0.11 dex for the BCGs and
| (4) |
with a scatter around the relation of 0.34 dex for the total early-type galaxy population.
3.3. The velocity dispersion-luminosity relation
If the relation for BCGs is steeper than for the bulk of the early-type galaxy population, then the tight correlation between and dynamical mass shown in Figure 5 suggests that the relation for BCGs will be shallower. Figure 6 shows that this does appear to be the case. Once again, the solid line shows the relation for the full sample, and the dashed line shows a fit to the BCGs (filled and open symbols). A running average over small bins in luminosity shows evidence for curvature in the BCG relation, in the sense that velocity dispersion increases only weakly with luminosity once 250 km/s. However, notice that objects which are not well-fit by a single deVaucouleur profile appear to have slightly larger velocity dispersions.
3.4. The Fundamental Plane
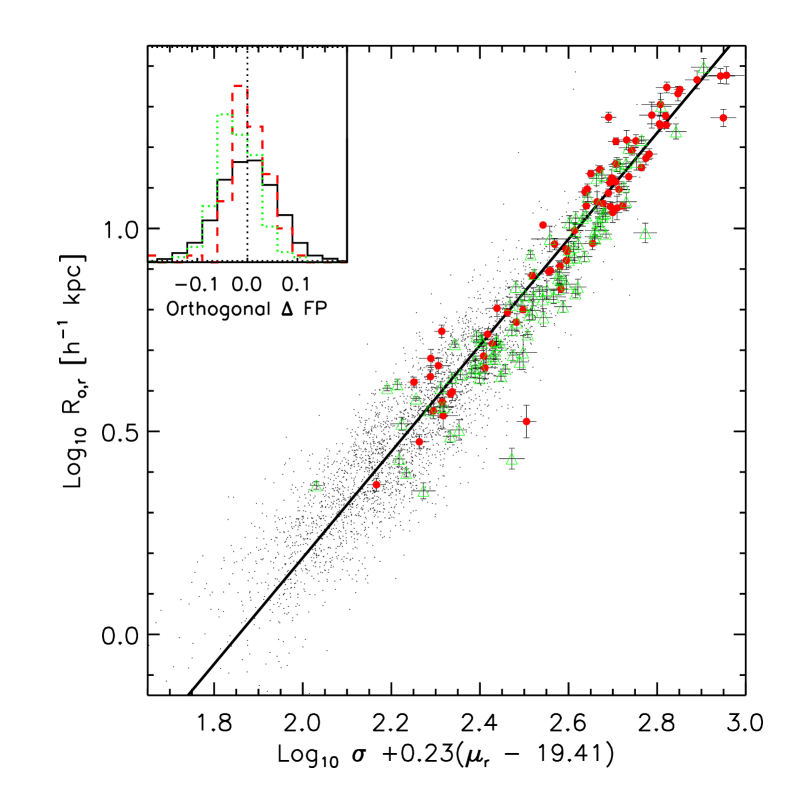
Numerical simulations of a dry merger scenario suggest that the final object will remain on the Fundamental Plane defined by the bulk of the early-type population (e.g. Boylan-Kolchin et al. 2006). Figure 7 shows the location of the C4 BCGs in the Fundamental Plane defined by the bulk of the early-type galaxy population:
| (5) |
This is the “orthogonal” Fundamental Plane and it differs from the result presented in Bernardi et al. (2003b) mainly because we have restricted our sample to (the new photometry changed the zero-point but not the slope of the relation).
The BCGs which are well fit by a single deVaucouleur profile lie on this same Fundamental Plane, whereas the others are slightly offset ( dex) from it. The inset shows that the scatter around this Plane is significantly reduced—the scatter orthogonal to the Plane decreases from 0.058 dex (solid line), to 0.046 dex (dotted line), to 0.04 dex (dashed-line) if only BCGs which are well fit by a deVaucouleur profile are used. This reduced scatter for BCGs is consistent with a dry merger formation history—even a small amount of star formation associated with a wet merger has the potential to change the surface brightnesses significantly, resulting in increased scatter about the Plane.
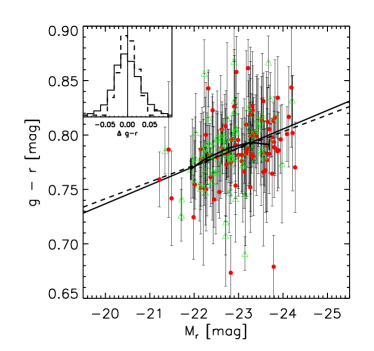
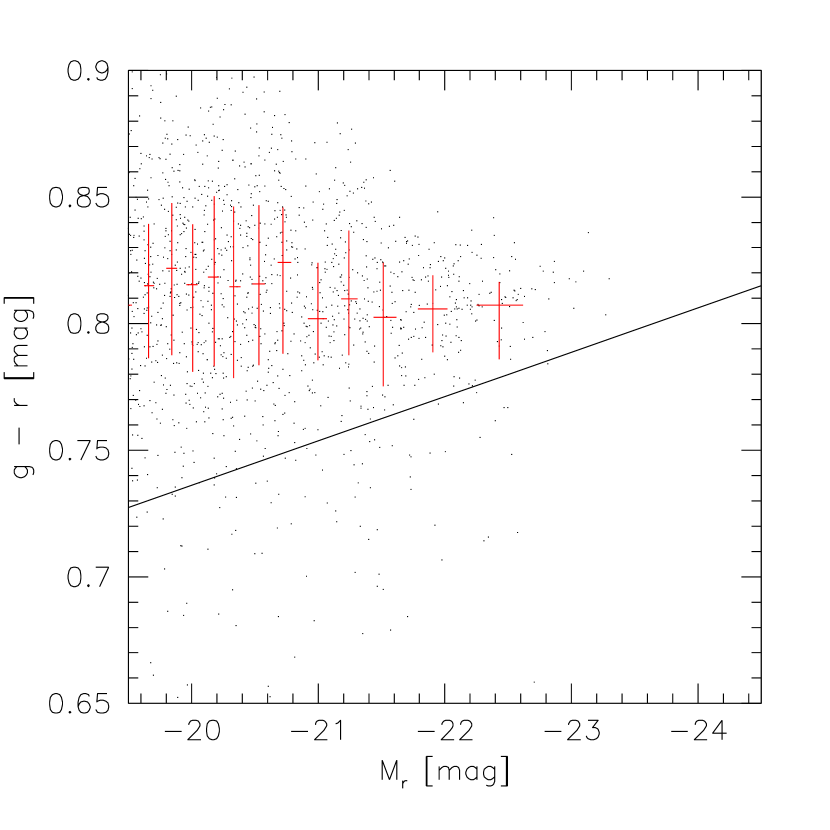
3.5. The color-magnitude relation
Early-type galaxies define a tight correlation between color and luminosity. Figure 8 shows that BCGs follow the same correlation, though with slightly smaller scatter. The Appendix presents a comparison with the color-magnitude relation predicted by semi-analytic galaxy formation models. The models suggest that BCGs should lie slightly blueward of the relation defined by the bulk of the population—an effect which is not seen in Figure 8.
Whereas the luminosity of an object formed from a dry merger is expected to be the sum of the luminosities of the objects involved in the merger, the merger is not expected to change the color (there being no associated star formation). Therefore, if BCGs formed from dry mergers, then the fact that they define the same color-magnitude relation as the bulk of the population suggests that the progenitors of BCGs were red for their luminosities. Objects which lie redward of the color-magnitude relation are expected to be older (Kodama et al. 1998; Bernardi et al. 2005). Thus, Figure 8 is not inconsistent with the expectation that the oldest stars in a halo find their way to the bottom of the potential well, the location of which is often traced by the BCG.
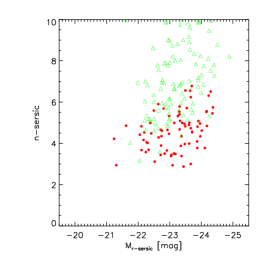
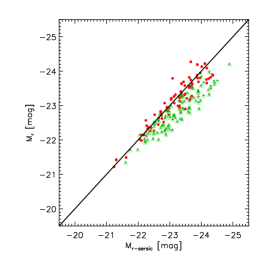
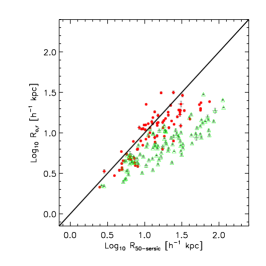
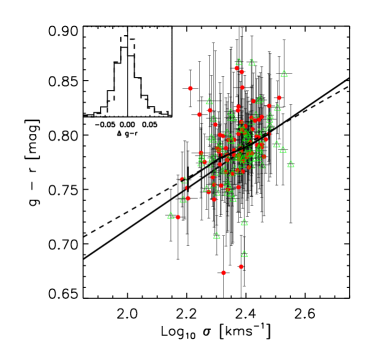
Figure 8 shows that BCGs also lie on approximately the same -color correlation as the bulk of the early-type population. This is consistent with a model in which the color is not altered by the merger, and the change to is also weak (recall Figure 6 suggests that dry mergers do not change as much as they change ).
The color-magnitude relation for the bulk of the early-type galaxy population is entirely due to the color- and -magnitude correlations (Bernardi et al. 2005). The figures above suggest that this is not true for BCGs. Specifically, the flatter relation for BCGs, combined with the fact that the color-magnitude and color relations show little difference from the main sample implies that the correlation between color and magnitude for BCGs is substantially stronger than expected from the BCG color- and -magnitude correlations.
4. Tests of systematic effects
This section studies two possible sources of systematic trends and concludes that they do not cause the steeper relation we see in our early-type BCG sample.
4.1. Sersic profile fits
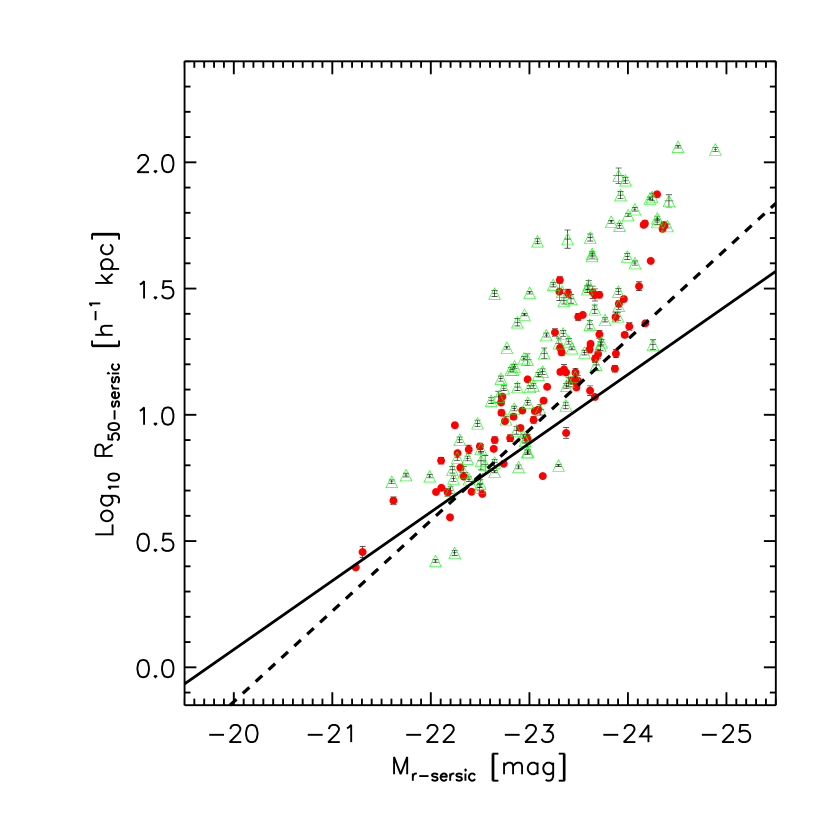
We have considered the possibility that the steeper relation we see arises because the deVaucouleur profile provides a systematically worse description of early-type surface brightness profiles at large . Figures 9–10 show results obtained from fitting Sersic profiles to the full early-type sample, as well as to the BCGs. Figure 9 shows that objects which we identified as potentially having two components (like those shown in Figure 2) tend to have large values of . Figure 9 shows that, for those objects which we flagged as having two components, the luminosities and half-light radii derived from the Sersic fits tend to be substantially larger than when the fit is restricted to a deVaucouleur profile. In some cases the difference in total luminosity is as large as one magnitude—this systematic difference dwarfs the 0.02 mag uncertainty usually quoted for SDSS photometry. Figure 10 shows the analog of Figure 4: the relation obtained from the Sersic profile fits. This illustrates that BCGs define a steeper relation than the bulk of the population even when parameters derived from Sersic fits are used.
4.2. The effect of intra-cluster light
The previous section showed that BCGs define a steeper size-luminosity relation than does the bulk of the early-type galaxy population. However, it is known that there is a component of the total luminosity of a cluster which is not associated with any particular galaxy in it: this intracluster light (ICL) tends to have a smooth profile centered on the cluster center (e.g. Malumuth & Kirshner 1981; Zibetti et al. 2005; Gonzalez et al. 2005; Krick et al. 2006). So it is natural to ask if this ICL profile is affecting our estimates of the sizes and luminosities of BCGs, thus altering the correlation between size and luminosity. This effect would be particularly severe for BCGs which lie at the cluster center. For such objects, it may be more reasonable to treat the surface brightness profile as the sum of two components, an inner one which represents the BCG itself, and an outer one which represents the ICL.
To estimate the effect of the ICL on our results, we have used two results from the recent literature. Zibetti et al. (2005) used a stacking technique to detect the ICL with high significance in SDSS clusters, and concluded that the ICL component has rather low surface brightness ( mag arcsec-2): single SDSS exposures in the band are not sufficiently deep to detect it unambiguously, which is why a stacking analysis was required. This suggests that contamination from the ICL is unlikely to be a strong effect in our case. However, recent work by Gonzalez et al. (2005) shows that BCG light profiles deviate from a deVaucouleur fit at about the same surface brightness values (once the difference between their band and our band has been accounted for) at which we see deviations (c.f. Figure 2).
To check if the ICL is affecting our results, we made mock observations of BCGs of various luminosities as follows. For a given BCG luminosity, we require the half-light radius to satisfy . We use this size and luminosity to generate a deVaucouleurs surface brightness profile. To this profile we add an ICL component, the parameters of which are motivated by the study of Zibetti et al.. Namely, the ICL component is modeled as a second deVaucouleurs profile, with the same integrated luminosity as the first component, but with half-light radius twenty times larger. We then fit the summed image with a single component deVaucouleurs profile (since this is, in effect, what the SDSS pipeline does), and record the best-fit values of luminosity and half-light radius. Upon repeating this procedure for a range of luminosities, we can compare the relation with the input one.
In general, the ICL component tends to increase both the size and the total luminosity of the BCG. Our experiments indicate that the net effect of the ICL is to move the BCG along the relation. Therefore, we find that the ICL component does not lead to a steepening of the relation. This conclusion remains unchanged if we use Sersic profiles instead, or the particular choice of Petrosian quantities used by the SDSS. (Because the Petrosian quantities do not make strong assumptions about the profile shape, one might have thought that they were particularly well suited to this comparison. However, the Petrosian quantities output by the SDSS pipeline are neither seeing-corrected nor have the correct sky subtraction, making them less attractive.)
This conclusion also remains unchanged if we assume that the ICL component follows a NFW profile (i.e., the profile traced by the dark matter in simulations of dissipationless clustering). For NFW concentrations between 5 and 10 (the range associated with cluster mass halos), and between 1 and 10, the net effect of the ICL is to move the BCG approximately along the relation. At larger , the ICL component results in a flattening rather than a steepening of the relation.
5. Discussion
Whether or not BCGs comprise a special population has been the subject of considerable debate for almost fifty years (Scott 1957; Sandage 1976; Schechter & Peebles 1976; Tremaine & Richstone 1977; Bhavsar & Barrow 1985; Oegerle & Hoessel 1991; Postman & Lauer 1995; Loh & Strauss 2006), with different authors coming to different conclusions. Semi-analytic galaxy formation models have long made the assumption that the central object in a halo is indeed special (Croton et al. 2006; Bower et al. 2006). And recently, halo model (see Cooray & Sheth 2002 for a review) interpretations of galaxy clustering strongly suggest that this is indeed the case (Berlind et al. 2005; Skibba et al. 2006).
One of the reasons the subject has received so much attention (and controversy!) is that BCGs appear to be quite homogeneous—being big and bright, they may be used as standard candles out to large distances. Their attractiveness as standard candles increases if their nature is understood, since the next generation of photometric galaxy surveys will identify large numbers of clusters to redshifts of order 0.7. This means that large BCG samples will also become available. If their nature is understood, then the BCGs themselves may provide complementary information about cosmological parameters.
BCG samples are only just becoming sufficiently large that unambiguous conclusions about their nature can be drawn. The particular question we addressed is whether or not BCG formation is dominated by dissipation or by dry mergers. The dry merger hypothesis seeks to explain why massive early-type galaxies, which are expected to have assembled their stellar mass recently, host the oldest stellar populations—even when the age estimate is luminosity-weighted. Recent observations suggest that dry mergers are a common formation mechanism for massive early-type galaxies (e.g., van Dokkum 2005). Since most BCGs are early-types, it is reasonable to ask if they show some signature of unusual formation histories.
Our analysis suggests that the answer to this question is ‘yes’. The optical surface brightness profiles of C4 BCGs appear to be of two types—one has the classical deVaucouleur profile (Figure 1), and the other shows evidence for a second, more extended, lower surface brightness component (Figure 2). The BCGs which are well-fit by classic deVaucouleur profiles have larger half-light radii than normal early-type galaxies of similar luminosities (Figure 4). The other BCGs also appear to follow a steep relation. The low surface brightness component in these objects may be due to light from the ICL. If so, then the steeper relation is also true of the BCG components of these objects, since the ICL tends to move objects along the relation, rather than change its slope (Section 4.2).
We also examined the relation of the normal early-type galaxy population, with a view to seeing if the most luminous galaxies tend to have abnormally large sizes whether or not they are BCGs. Although there is clear evidence for curvature in the relation defined by the full early-type sample (BCG + non-BCG), the evidence for curvature in the early-type sample once BCGs had been removed was much less compelling (Figure 13).
The relation of the bulk of the early-type galaxy population is steeper than the correlation between half mass radius and mass of dark matter halos. This is consistent with models in which galaxies in low mass halos have suffered more dissipation (e.g. Kormendy 1989; Dekel & Cox 2006). If massive galaxies have suffered less dissipation than less massive galaxies, then our results indicate that BCGs have suffered even less dissipation than other massive galaxies of similar luminosities. Although some of the steepening of the relation may be due to anisotropic mergers (e.g., Boylan-Kolchin et al. 2006), the larger than expected sizes of BCGs also suggest less dissipation, so they are consistent with the dry merger formation hypothesis. In addition, BCGs show a substantially smaller scatter around the Fundamental Plane defined by the bulk of the early-type population than does the early-type population itself (Figure 7). This might indicate that the formation histories of BCGs involve less recent star formation than occurs in early-type galaxies of similar mass; below average recent star formation rates would be consistent with dry merger formation histories.
BCGs define the same color-magnitude relation as the bulk of the early-type population (Figure 8). Hence, if BCGs form from dry mergers, then BCG progenitors must lie redward of this relation (else the product of the merger would lie blueward of this relation). In turn, this suggests that BCG progenitors host older stellar populations than is typical for their luminosities. This may provide an interesting constraint on dry merger models. To illustrate why, the Appendix compares our measurements with the color-magnitude relation predicted by semi-analytic galaxy formation models. The models suggest that BCGs should lie slightly blueward of the relation defined by the bulk of the population (Figure 12)—an effect which is not seen in the data (Figure 8).
The C4 BCGs also define a tight correlation between luminosity and dynamical mass , although this correlation is slightly steeper than it is for the bulk of the early-type population (Figure 5). This, with the steeper relation, implies that they define a shallower relation than the bulk of the population (Figure 6). These scaling relations are altered even for objects which are well described by classical deVaucouleur profiles (Figures 4–10). These changes to the scaling relations are consistent with previous work based on smaller samples of local BCGs (Malumuth & Kirshner 1981, 1985; Oegerle & Hoessel 1991).
The change in slope of the relation may be related to studies of curvature in the relation. This is because the most massive galaxies are expected to host the most massive black holes. This expectation is based on the strong and tight correlation between and the velocity dispersion of the spheroid/bulge which surrounds it: roughly (e.g. Ferrarese & Merritt 2000; Gebhardt et al. 2000; Tremaine et al. 2002). also correlates with the luminosity of the bulge, although this correlation is not as tight (Magorrian et al. 1995). The curvature we see in the relation (Figure 6), suggests that a single power law may be a better description of the relation than of . So it is interesting that Ferrarese et al. (2006a,b) find that the mass of the central compact object correlates better with bulge mass than with or .
References
- (1) Berlind A. et al. 2005, ApJ, 629, 625
- (2) Bernardi M., Sheth R. K., Annis J., et al. 2003a, AJ, 125, 1817
- (3) Bernardi M., Sheth R. K., Annis J., et al. 2003b, AJ, 125, 1866
- (4) Bernardi M., Sheth R. K., Nichol R. C., Schneider D. P. & Brinkmann J. 2005, AJ, 129, 61
- (5) Bhavsar S. & Barrow J., 1985, MNRAS, 213, 857
- (6) Bower R., et al., 2006, MNRAS, in press (astro-ph/0511338)
- (7) Boylan-Kolchin M., Ma C. & Quatert E. 2006, MNRAS, 369, 1081
- (8) Brough S., Collins C. A., Burke D. J., Lynam P. D., Mann R. G., 2005, MNRAS, 364, 1354
- (9) Capelato H. V., de Carvalho R. R., & Carlberg R. G. 1995, ApJ, 451, 525
- (10) Crawford C. S., Allen S. W., Ebeling H., Edge A. C., Fabian A. C., 1999, MNRAS, 306, 857
- (11) Cypriano E. S., Sodré L. Jr, Campusano L. E., Dale D. A. & Hardy E. 2006, AJ, 131, 2417
- (12) Cooray A. & Sheth R. K. 2002, Phys. Rep., 372, 1
- (13) Croton D., et al., 2006, MNRAS, 365, 11
- (14) Dekel A. & Cox T. J. 2006, MNRAS, submitted (astro-ph/0603497)
- (15) De Lucia G., et al., 2006, MNRAS, 366, 499
- (16) Ferrarese L. & Merritt D., 2000,
- (17) Ferrarese L. et al., 2006a, ApJ, 644, L21
- (18) Ferrarese L. et al., 2006b, ApJS, 164, 334
- (19) Gebhardt K. et al. 2000, ApJL, 539, 16
- (20) Gonzalez A., Zabludoff A. I. & Zaritsky, D. 2005, ApJ, 618, 195
- (21) Hyde J., Bernardi M., et al., AJ, submitted
- (22) Hopkins P. F., Hernquist L., Cox T. J., Di Matteo T., Robertson B., Springel V. 2006, ApJS, 163, 1
- (23) Hoessel, J. G., Oegerle, W. R. & Schneider, D. P. 1987, AJ, 94, 1111
- (24) Kodama T., Arimoto N., Barger A. J., & Aragon-Salamanca A. 1998, A&A, 334, 99
- (25) Koester, B. P. et al. 2007, AJ, submitted
- (26) Kormendy J., 1989, ApJL, 342, 63
- (27) Krick, J. E., Bernstein, R. A. & Pimbblet, K. A. 2006, AJ, 131, 168
- (28) Lauer T., et al., 2006, submitted (astro-ph/0606739)
- (29) Loh Y. S., Strauss M. A., 2006, MNRAS, 366, 373
- (30) Magorrian J. et al. 1998, AJ, 115, 2285
- (31) Malumuth E. M. & Kirshner, R. P. 1981, ApJ, 251, 508
- (32) —. 1985, ApJ, 291, 8
- (33) Miller C., et al., 2005, AJ, 130, 968
- (34) Nipoti C., Londrillo P., & Ciotti L. 2003, MNRAS, 342, 501
- (35) Oegerle W. R. & Hoessel J. G. 1991, ApJ, 375, 15
- (36) Postman M., Lauer T., 1995, ApJ, 440, 28
- (37) Robinson B., Cox T. J., Hernquist L., Franx M., Hopkins P. F., Martini P. & Springel V. 2005, ApJ, 641, 21
- (38) Sandage A., 1976, ApJ, 205, 6
- (39) Schechter P., & Peebles P. J. E., 1976, ApJ, 209, 670
- (40) Schombert J. M. 1987, ApJS, 64, 643
- (41) —. 1988, ApJS, 328, 475
- (42) Schweizer F. 1982, ApJ, 252, 455
- (43) Scott E., 1957, AJ, 62, 248
- (44) Springel V., et al. 2005, Nature, 435, 629
- (45) Thuan T. X. & Romanishin W. 1981, ApJ, 248, 439
- (46) Tremaine S. D., Richstone D. O., 1977, ApJ, 212, 311
- (47) Tremaine S. D. et al. 2002, ApJ, 574, 740
- Skibba et al. (2006) Skibba, R., Sheth, R. K., Connolly, A. J., & Scranton, R. 2006, MNRAS, in press (astro-ph/0511773)
- (49) van Dokkum P. G. 2005, AJ, 130, 2647
- (50) Zibetti S., White S. S. M., Schneider D. P. & Brinkmann J. 2005, MNRAS, 358, 949
Appendix A A: Comparison with semi-analytic galaxy formation models
The introduction states that semi-analytic galaxy formation models make strong assumptions about the formation histories of BCGs. This Appendix shows that although the models produce massive galaxies which lie on a well-defined color magnitude relation, different models disagree on the slope and zero-point of this relation (Figure 11). Nevertheless, the models do agree that the very most massive objects lie slightly blueward of the color-magnitude relation defined by the bulk of the bulge-dominated population. The SDSS early-type BCGs studied in the main text do not show such a blueward trend (Figure 8).
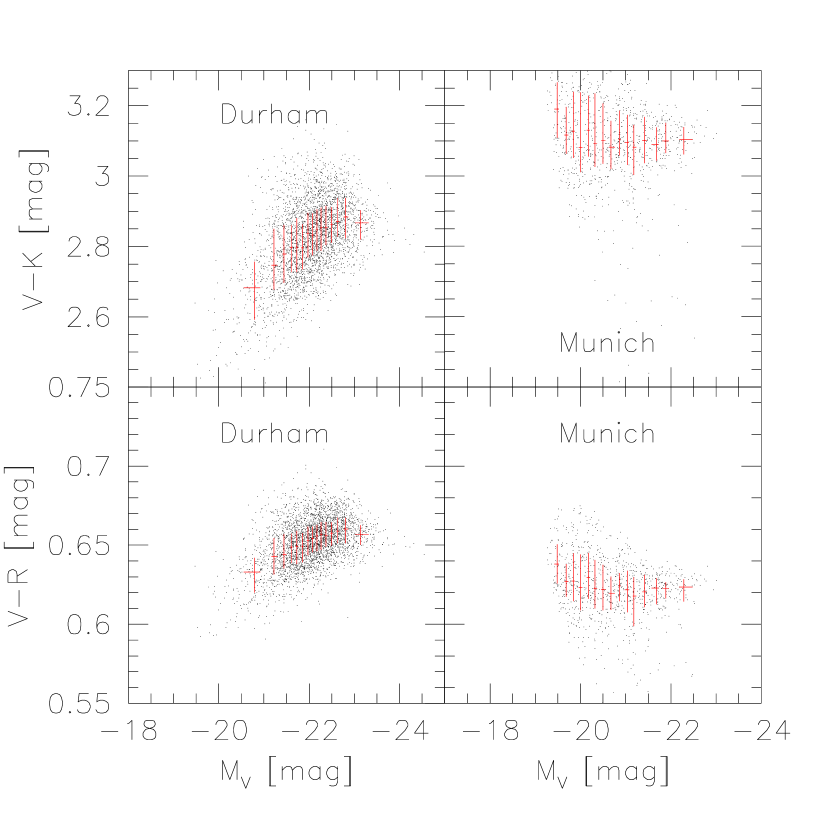
The ‘Munich’ and ‘Durham’ models we study here were kindly made available by Croton et al. (2006) and Bower et al. (2006) respectively. Both are based on the same underlying dark matter distribution—that of the Millennium Simulation (Springel et al. 2005). For the Durham models, we selected BCGs of halos more massive than ; this resulted in about 3200 objects from a Mpc)3 volume. The color magnitude relation defined by these objects is shown in the left-hand panels of Figure 11. Selecting BCGs from the Munich models is less straightforward, because information about halo masses is not provided. However, the stellar masses of the Durham model BCGs are all greater than , and so the right hand panels of Figure 11 show the color-magnitude relation of the objects which, in the Munich models, have stellar masses greater than . The difference between the Durham and Munich models is striking, and is not particularly sensitive to this cut. This illustrates that the semi-analytic modelers have not yet converged on an unambiguous prediction for the slope and zero-point of the color-magnitude relation.
For a more direct comparison with the results presented in the main text, Figure 12 shows the predicted color as a function of -band magnitude in the Munich models. Comparison with Figure 8 shows that the predicted colors are redder than in the SDSS. In addition, the trend for the most massive objects to be slightly bluer is not seen in the SDSS. If color gradients are responsible for the overall offset in color, then they must change along the color-magnitude relation to reconcile the predicted bluer colors of the most massive objects with the observations.
Appendix B B: BCGs and the most luminous galaxies
So far we have focussed on the fact that BCGs appear to have larger than expected sizes for their luminosities. It is, of course, possible that a single power-law is not a good description of the relation of normal early-types. Figure 13 presents a study of this correlation for early-types which are not BCGs. The top left panel shows the joint distribution of and in the full Bernardi et al. (2003a) sample, using the photometric reductions of Hyde et al. (2006). Notice that the lower envelope of the distribution appears to curve upward at large , whereas the upper envelope is approximately constant. The solid line shows the result of fitting a single power to . Upper (magenta) and lower (cyan) jagged lines show the median size in small bins in in the C4 BCG sample and in the total sample. At large , both samples curve upwards, away from the single power law fit.
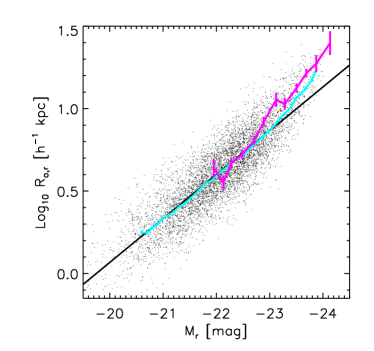
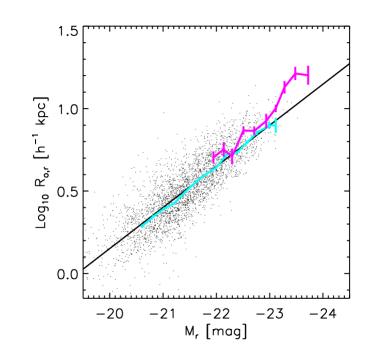
The upwards curvature in the full sample (normal plus BCGs) is qualitatively consistent with the curvature in the isophotal size-luminosity relation for cluster ellipticals recently noted by Cypriano et al. (2006). (In principle, curvature in the isophotal size-luminosity relation can result even if there is no curvature in the relation; we have checked that this cannot account for the curvature they report.) What causes this curvature?
The relation is a number-weighted average of the normal and BCG relations. So, if the fraction of objects which are BCGs increases with increasing luminosity, then this will produce curvature in the same sense as seen in Figure 13. If all of the curvature is to come from this effect, then the fraction of BCGs must increase with luminosity approximately as ; about half of all objects with must be BCGs.
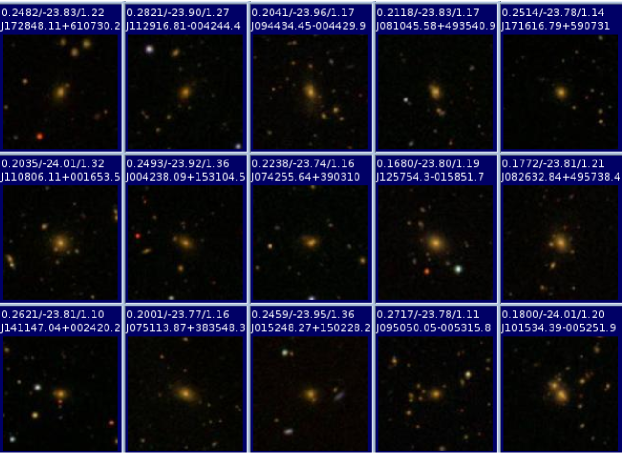
To illustrate that a substantial fraction of the most luminous galaxies are BCGs, Figure 14 shows fields centered on a random selection of objects with in the SDSS/Bernardi et al. sample. The fields tend to be very crowded, with many objects in the field having the same color as the more luminous central object, thus strongly suggesting that the central object is a BCG.
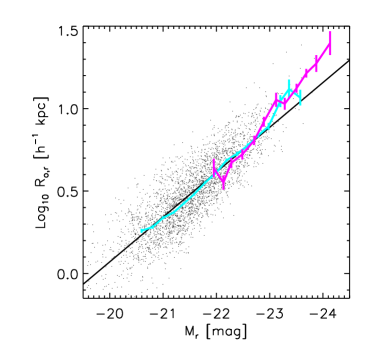
Unfortunately, the vast majority of objects with such luminosities in the SDSS lie at redshifts which are substantially larger than those over which the C4 catalog is complete—all the objects in Figure 14 are at ; the C4 catalog is only complete to about . This makes it difficult to quantify how the BCG fraction increases with luminosity. Nevertheless, the top right and bottom left panels in Figure 13 show an attempt to address this issue. The points in the top right panel show the result of limiting the Bernardi et al. sample to the same redshift range as the C4 catalog (), and then removing the C4 BCGs as well as the objects identified as BCGs in the maxBCG catalog of Koester et al. (2007). The solid line is a single power-law fit to the points in this panel; it is essentially the same as in the previous panel. The jagged magenta line shows the same BCG relation as in the previous panel. Although the lower envelope still curves upwards, the upper envelope is no longer as constant as before—removing the BCGs has depleted this upper envelope substantially. Nevertheless, the cyan jagged line suggests that the objects which survived the BCG cuts do still lie above the power-law relation at . What are these non-BCG objects with abnormally large sizes?
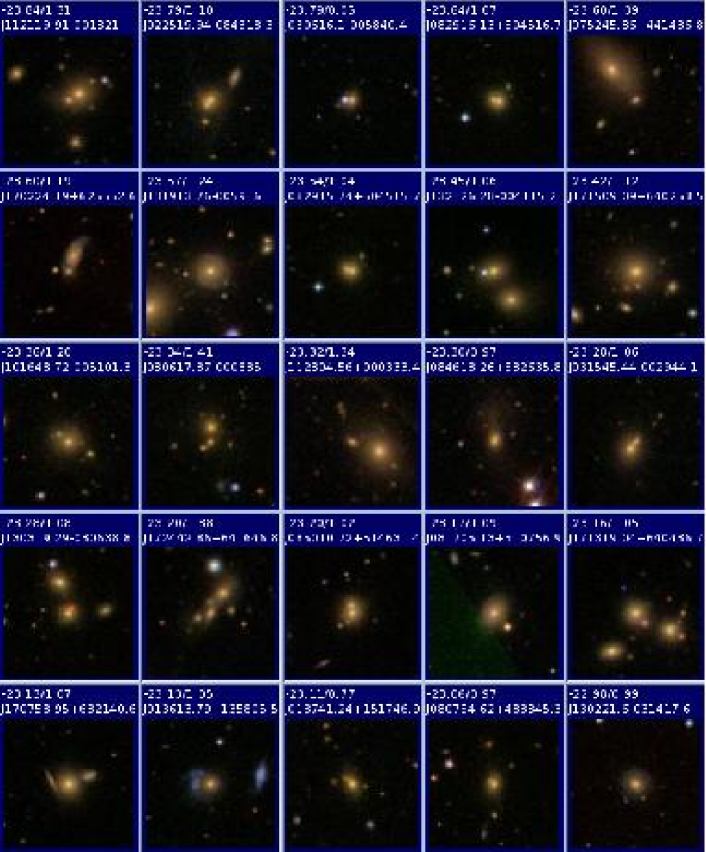
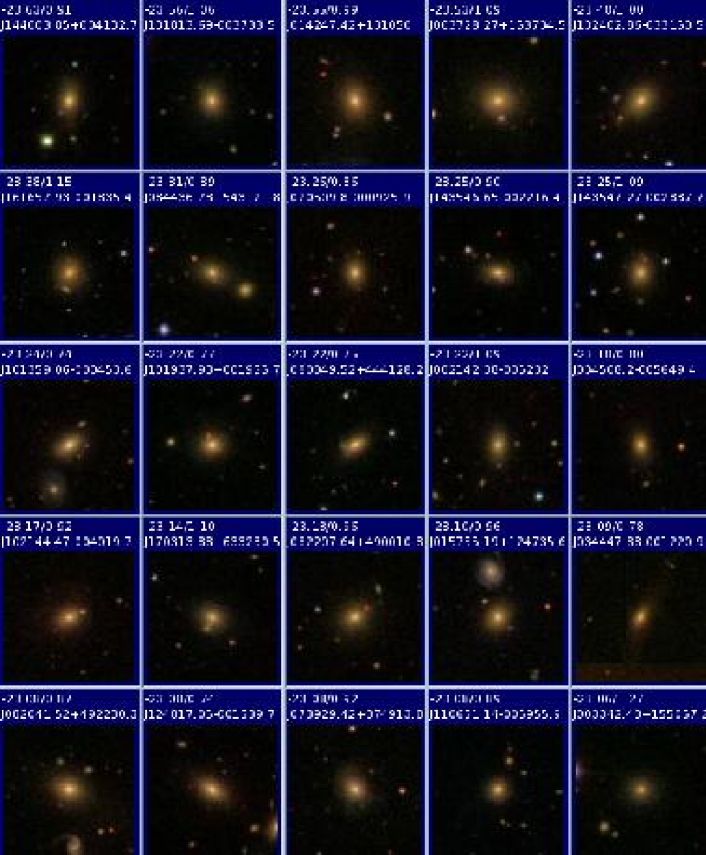
Recall that the C4 catalog only contains clusters with more than ten luminous galaxies, so the early-type sample which remains still contains BCGs of less massive clusters and groups. Since there is no reason to believe that the formation histories of the BCGs of massive clusters are particularly different from those of rich groups, it is possible that such objects contribute to the curvature in the top right panel of Figure 13. However, a visual inspection of the images of the objects with showed that many are actually rather complex. Although some have multiple near-neighbours of similar color (presumably these are the lower mass groups which are not included in the C4 or maxBCG catalogs), others appear to have double nuclei, or other unusual features. Hyde et al.’s estimates of the sizes and luminosities do not account for such complexities, making their estimates for these quantities suspect. Therefore, on the basis of these images, we classified objects as having suspect photometry or not. Figure 15 shows fields centered on the objects with which we removed, and Figure 16 shows similar fields centered on the objects which we kept.
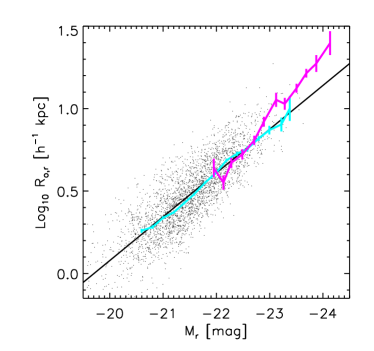
The jagged cyan line in the bottom left panel of Figure 13 shows the relation of the objects which we felt had more reliable photometric reductions. Notice that the difference between the jagged and solid black lines, which was obvious in the top right panel, has gone away, even though the actual values of and played no role in determining which objects were kept.
As a check, the bottom right panel of Figure 13 shows the SDSS reductions of the same objects shown in the top right panel. Recall that these reductions slightly underestimate the luminosities and sizes of bright objects in crowded fields (such as BCGs); the solid line which shows a fit to these points has a shallower slope than in the other panels. The BCGs clearly lie above this relation at large , whereas the non-BCGs do not.
Thus, although our results do not exclude the possiblity that there is real curvature in the relation of normal early-type galaxies, they do suggest that to estimate this curvature reliably, one must be careful to ensure that the sample contains no BCGs or contaminated galaxies. In principle, one can use recent halo model interpretations (see Cooray & Sheth 2002 for a review) of the luminosity dependence of galaxy clustering to estimate this effect, but this is beyond the scope of the present work.