Subarcsecond resolution mid-infrared observations of super star clusters in the Antennae (NGC4038/4039)11affiliation: Based on observations collected at the European Southern Observatory, Paranal, Chile, under programme no. 075.B-0791(A)
Abstract
In this letter we present ground-based subarcsecond mid-infrared imaging and spectroscopy of young super star clusters in the overlap region of the merging galaxies NGC4038/4039 (the Antennae) obtained with the VLT Imager and Spectrometer for mid-Infrared (VISIR). With its unprecedented spatial resolution VISIR begins to resolve the H ii/PDR complexes around the star-forming regions for the first time. In the N-band spectra of two young star clusters unexpectedly low polycyclic aromatic hydrocarbon (PAH) emission is observed, compared to what is seen with the Infrared Space Observatory (ISO) and with the Spitzer Space Telescope. We conclude that a large fraction of the PAH emission cannot directly be associated with the super star clusters, but originate from an extended region of at least 215 pc radius around the clusters. In the distribution of [Ne ii] 12.81 m emission a highly obscured cluster is discovered that does not have an optical or near-infrared counterpart.
Subject headings:
galaxies: individual (NGC4038/4039) — galaxies: star clusters — ISM: dust/PAH1. Introduction
Starburst galaxies experience a phase of rapid evolution. The rate at which their gas reservoir is turned into stars cannot be maintained for long, which makes the starburst phase by definition a transient one. The resulting stellar clusters make starbursts unique laboratories for the study of star formation, stellar populations and the evolution of galaxies as a whole.
Since the earliest stages of massive star formation are generally heavily enshrouded by dust, infrared observations are essential to detect the youngest stellar populations and provide various diagnostic features to study the properties of the interstellar matter (ISM) and the underlying stellar population. Recently, a new generation of ground- and space-based instruments working at mid-infrared wavelengths has become operational, giving this field of research a large impulse.
The Antennae (NGC4038/4039, Arp244) is the nearest major merger of two large spirals (Toomre & Toomre,, 1972). Since the beginning of the interaction the system went through several episodes of violent star formation of which the last one is probably still ongoing (Vigroux et al.,, 1996). The resulting (super) star clusters have been studied extensively throughout the electromagnetic spectrum (Whitmore et al.,, 2005; Wang et al.,, 2004; Gilbert et al.,, 2000). Radio and mid-infrared observations showed that the region between the two spirals (the overlap region) hosts spectacular obscured star formation. The brightest mid-infrared component produces 15% of the total 15 m luminosity of the entire system (Mirabel et al.,, 1998; Hummel & Van der Hulst,, 1986). This region is covered by a prominent dustlane, and can be associated with a faint, red source in the HST images (number 80 of Whitmore & Schweizer,, 1995, hereafter WS95), illustrating how optical data alone are insufficient to identify and study the youngest star-forming regions. An ISOCAM spectrum of this region shows strong fine-structure emission lines ([Ne ii] and [Ne iii]) and pronounced emission from polycyclic aromatic hydrocarbons (PAHs) (Mirabel et al.,, 1998).
We use the recently commissioned VLT Imager and Spectrometer for mid-Infrared (VISIR) (Lagage et al.,, 2004) at the Very Large Telescope (VLT) of the European Southern Observatory (ESO) to study the most luminous super star clusters and the surrounding matter in the Antennae overlap region in detail.
2. Observations and data reduction
The southern part of the overlap region of NGC4038/39 was observed with VISIR on 2005 April 17 – 20. VISIR offers a large set of imaging filters covering the 8 – 13 and the 17 – 24 micron range of which we used four (see Table 1), all at the largest pixel scale of 0127/pixel, resulting in a 32.5″ 32.5″ field-of-view. To correct for the strong and highly variable atmospheric background chopping and nodding was applied, with a chopper throw of 14″. The total on-source integration time was 60 minutes in both the PAH and PAH reference filter, 120 minutes in the [Ne ii] filter and 15 minutes in the [Ne ii] reference filter. The latter observations had to be aborted prematurely because of strong winds. Between individual nod cycles the telescope was given a random jitter offset to correct for array artefacts. Standard stars (HD99167 and HD157999, Cohen et al.,, 1999) were observed before and after each target observation for flux calibration.
Additionally, low-resolution N-band spectra were obtained for the two brightest sources in the overlap region simultaneously (R 185 – 390, 075 slit). Four spectral settings overlapping by at least 15% were used to cover the full N-band ( = 8.8, 9.8, 11.4 and 12.4 m). The total on-source integration time was 30 minutes for each spectroscopic setting. Since the images showed no large-scale diffuse emission, chopping and nodding on-slit was applied with a 10″ chopper throw. Early-type stars were observed before and after each target observation for flux calibration (HD115892 and HD135742).
IRAF111Image Reduction and Analysis Facility (NOAO, National Optical Astronomy Observatories) routines and customized IDL scripts were used for data reduction. Subtracting the chopping and nodding pairs removes most of the sky and telescope background. The resulting images were shifted and coadded. Wavelength calibration and removal of the curvature in the spectroscopic data was done by tracing skylines. Spectra were extracted in a 127 aperture. Absolute flux calibration was obtained by normalizing the standard star spectra to VISIR narrow-band fluxes. The accuracy of the flux calibration is 20% both for imaging and spectroscopy.
3. Results
| filter | seeingaamean of FWHM of PSF of all standard stars observed before and after target observations | flux densitybbtotal flux density, sum of compact and broad component | sizeccFWHM of the broad component of the best fit | ||
|---|---|---|---|---|---|
| (m) | (m) | (mJy) | (pc) | ||
| Source 1 | |||||
| PAH | 11.25 | 0.59 | 033 003 | 98 20 | 88 14 |
| PAHref | 11.88 | 0.37 | 032 001 | 133 27 | 80 14 |
| Ne iirefddlow SNR; observations aborted prematurely because of strong wind | 12.27 | 0.21 | 046 001 | 203 41 | – |
| Ne ii | 12.81 | 0.18 | 034 002 | 373 75eesum of sources 1a and 1b, one-fifth can be associated with 1b | 93 20 |
| Source 2 | |||||
| PAH | 11.25 | 0.59 | 033 003 | 74 15 | 76 9 |
| PAHref | 11.88 | 0.37 | 032 001 | 84 17 | 71 9 |
| Ne iirefddlow SNR; observations aborted prematurely because of strong wind | 12.27 | 0.21 | 046 001 | 114 23 | – |
| Ne ii | 12.81 | 0.18 | 034 002 | 210 42 | 84 10 |
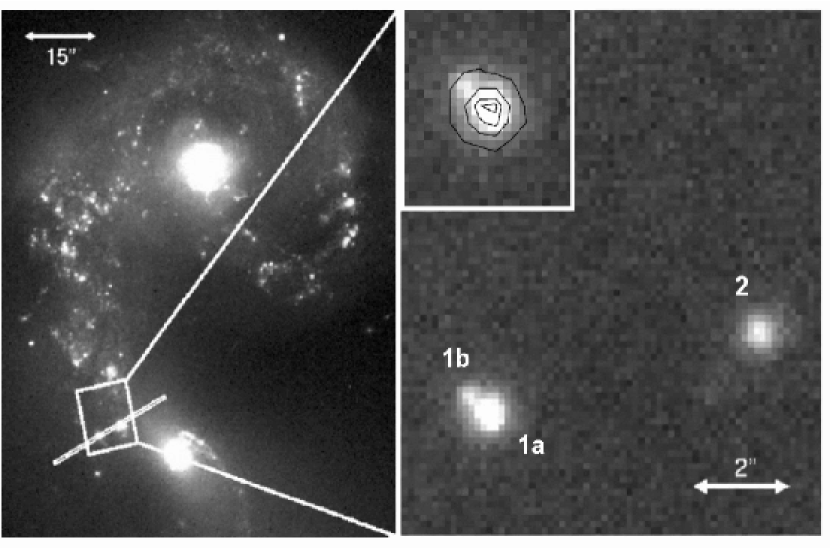
The narrow-band PAH 11.25 m and reference images show two bright resolved sources separated by 58 ( 600 pc in projection at a distance of 21 Mpc222Note that the distance of the Antennae is under debate. Recently a lower distance of 13.8 1.7 Mpc was found (Saviane et al.,, 2004), which would affect the values derived here., assuming a Hubble constant of 70 km s-1 Mpc-1; at this distance 1″ corresponds to 105 pc) in the southern part of the overlap region. These sources correspond to the two strong peaks identified in the overlap region in ISO images (Mirabel et al.,, 1998). The eastern source is the counterpart of the faint, very red cluster 80 in HST images (WS95) and a bright cluster in the near-infrared (IDWIRC 157, Brandl et al.,, 2005). The western source can be associated with a very crowded, much less obscured, bright cluster complex consisting of the star clusters WS95-86 to WS95-90 plus a number of close neighbours and with another bright near-infrared cluster, IDWIRC 136. It is remarkable how similar the eastern and western source are in shape and brightness in the mid-infrared, while these regions appear very different at shorther wavelengths. Given the similar ages for these clusters (both 6 Myr Gilbert et al.,, 2000; Mengel et al.,, 2005), the differences in appearance at the near-infrared and the optical indicate strongly varying physical conditions and/or extinction in these star-forming regions.
In the [Ne ii] filter image the eastern source breaks up into two distinct sources, which are separated by 054 ( 60 pc in projection, Fig. 1: source 1a & 1b). Relative astrometry strongly suggests that source 1a can be associated with the bright near-infrared cluster IDWIRC 157 and with the optical source WS95-80 mentioned before. This was determined by matching source 2 through all wavelength bands: the peak in the mid-infrared data was accurately matched with the well-defined peak in the near-infrared. The morphology of the cluster complex in the near-infrared was in turn precisely overlayed with the optical data. The fainter second source 1b, emitting one-fifth of the total emission in the [Ne ii] filter (continuum plus [Ne ii] line flux), has not been observed before. Neither in the optical nor in the near-infrared possible counterparts are identified. At shorter wavelengths this cluster is hidden by extinction and at longer wavelengths most instruments lack spatial resolution to separate the two clusters.
Under the assumption that source 1b is as 1a younger than 6 Myr, that source 1b has a similar spectral energy distribution and using the values for the Ks-band magnitude and extinction as published (Ks = 14.59 and is 4.23, Mengel et al. 2005; assuming that 9.3, Mathis,, 1990), the minimal extinction necessary to account for the observations is 7.8 ( 72) of source 1b. Although the exact intrinsic Ks-band flux of source 1b is not straightforward to determine, it is obvious that it is extinguished by an enormous amount of obscuring matter. The presence of this cluster compromises efforts to model the emission from this region with one coeval stellar population. It might for example partly explain the discrepancy between the mid-infrared luminosity measured in this region by ISO (15% of the total 15m flux of the entire system, Mirabel et al.,, 1998) and the far lower expected mid-infrared luminosity as reconstructed from the properties of the underlying stellar population derived from near-infrared and optical data (3.6% of the total 15m flux, Mengel et al.,, 2005).
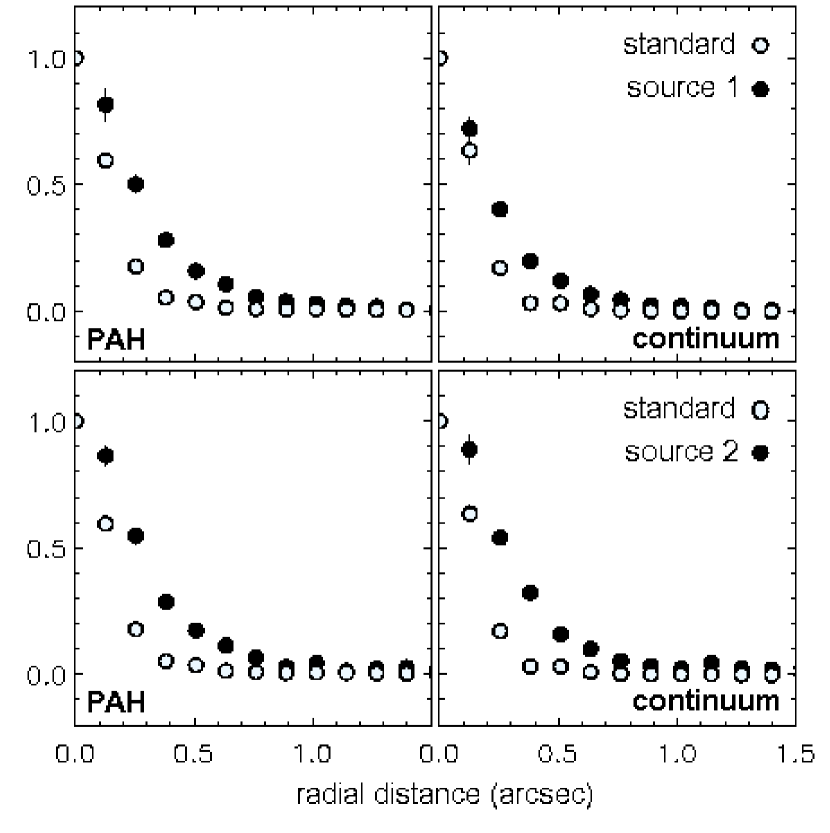
Fig. 2 shows that both source 1 and 2 are spatially resolved. The radial profiles of the sources are well fitted by a combination of two Gaussians, one compact component and a more extended component, both contributing roughly 50% to the total flux. The full-width at half maximum (FWHM) of the broad component for the best fit varies from 085 – 10 for source 1 and slightly smaller, 075 – 090, for source 2. This corresponds to a size of 90 – 105 pc and 80 – 95 pc respectively, similar to sizes observed for giant molecular clouds. Table 1 lists the size of the broad component and flux density for both sources in all filters.
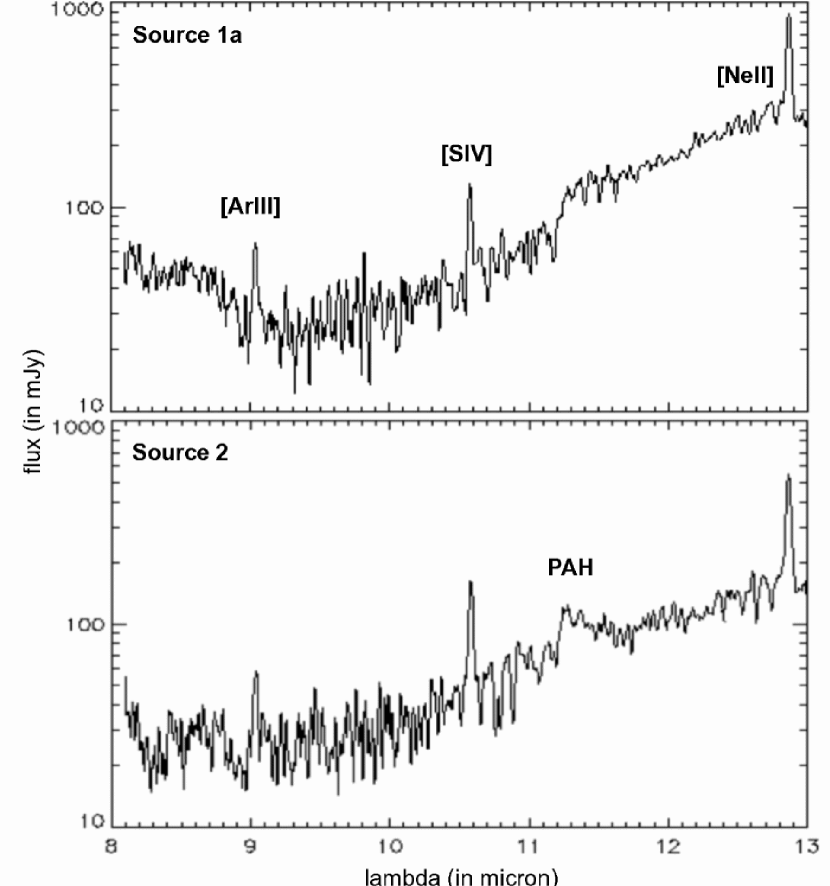
The spatial distribution along the slit in the spectroscopic data shows two bright, slightly resolved sources without any obvious more extended emission. The extracted N-band spectra show the typical signatures of a region of massive star formation: fine structure lines (, [S iv] and faint [Ar iii]) and a rising continuum characteristic for thermal emission by dust. Near-infrared data suggest that these clusters are very young, which is supported by the presence of strong [S iv] emission. Line fluxes and equivalent widths (EWs) are given in Table 2.
Besides obvious similarities in the general shape of the N-band spectra (Fig. 3) there are some remarkable differences from previous observations of the same regions by ISO (Fig.1 in Mirabel et al.,, 1998) and Spitzer (Brandl et al, in preparation). The most striking contrast is the strength of the PAH features. Where the ISO and Spitzer spectra of the region around complex 1 show a pronounced 11.3 m PAH-feature, the VISIR spectrum only shows a slight indication of it.
4. PAH emission
| Species | line flux | EW | |
|---|---|---|---|
| (m) | (10-14 erg s-1 cm-2) | (m) | |
| Source 1a | |||
| Ar iii | 8.99138 | 3.9 0.9 | 0.033 0.009 |
| S iv | 10.5105 | 7.6 0.9 | 0.057 0.011 |
| PAH | 11.3 | 14.0 3.8 | 0.057 0.017 |
| Ne ii | 12.8136 | 49.6 6.2 | 0.092 0.018 |
| Source 2 | |||
| Ar iii | 8.99138 | 4.2 0.7 | 0.051 0.011 |
| S iv | 10.5105 | 10.3 2.3 | 0.078 0.019 |
| PAH | 11.3 | 25.0 4.2 | 0.127 0.029 |
| Ne ii | 12.8136 | 30.2 4.5 | 0.111 0.023 |
One of us (BRB) is leading a GTO program to observe the Antennae with Spitzer-IRS. The results will be published in a subsequent paper (Brandl et al. in preparation). These observations include observations of both complex 1 and source 2.
Comparison of the VISIR spectrum of source 1a published here with the Spitzer spectrum of the same region shows considerable differences. The continuum flux density measured by VISIR is roughly three-quarters of that observed by Spitzer. Of the total emission in the 11.3 m PAH feature VISIR measures a much smaller fraction, only approximately one-quarter of the emission seen in the Spitzer spectrum. This large difference indicates that the region of PAH emission is significantly more extended than that of continuum emission.
Because of its wider slit Spitzer is expected to collect more flux than VISIR in case of extended sources (47 and 075 respectively). Indeed, VISIR finds a lower flux density than Spitzer at all wavelengths, but the relative fraction is different for the various spectral features. The EW of the 11.3 m PAH feature found with VISIR is over three times smaller than the EW measured within the larger apertures of both Spitzer and ISO (Mirabel et al.,, 1998). The total flux in the PAH feature in the VISIR spectrum of source 1a is (1.4 0.4) erg s-1 cm-2. The remaining three-quarters of PAH emission that is “missing” compared to the Spitzer data originate from a more extended region. If we assume that this (4.2 0.8) erg s-1 cm-2 of PAH emission is homogeneously distributed and has a surface brightness just below the detection limit of our data (2 is 2.56 erg s-1 cm-2 arcsec-2), the emission must originate from a region of at least 215 25 pc radius.
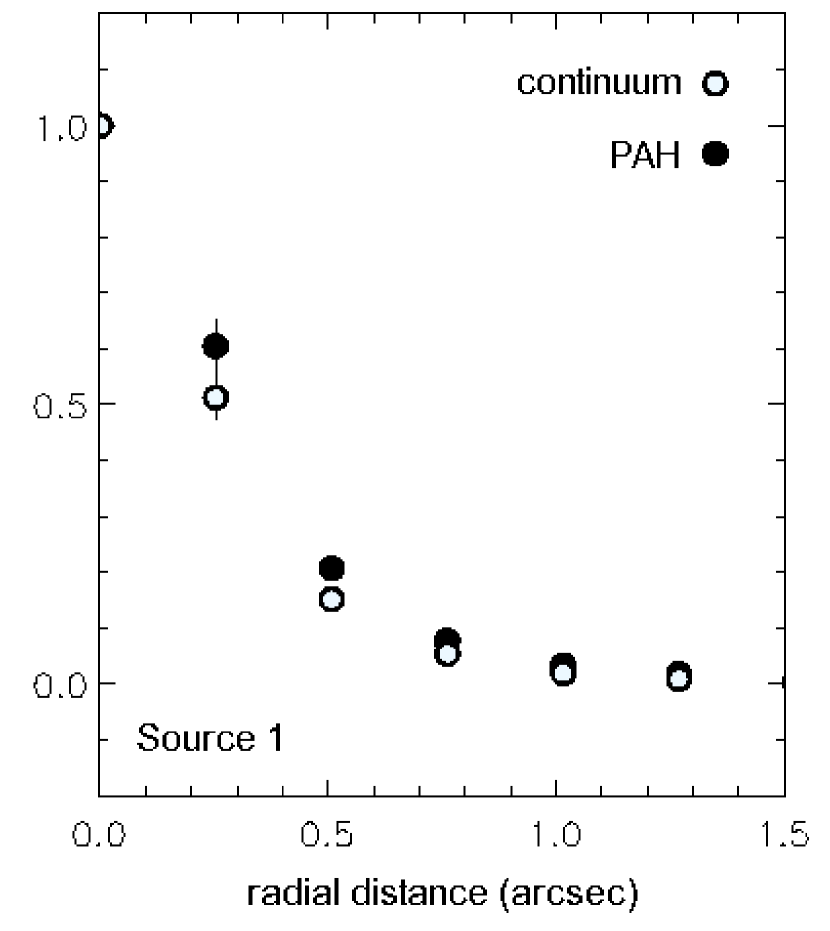
While this faint emission cannot directly be detected in our data, indications for more extended PAH emission are also found by close examination of the radial profiles in both the PAH and the reference continuum filter where a slightly softer drop-off of the profile in the PAH filter is found (see Fig. 4).
These results indicate that an extended PAH emission component below the VISIR surface brightness detection limit is present that accounts for the discrepancy of the VISIR with the ISO and Spitzer data. Spitzer IRAC images indeed show indications of widespread PAH emission (Wang et al.,, 2004).
For source 2 there are no ISO data available, but comparing the VISIR and Spitzer data leads in a similar way to the conclusion that extended PAH emission must be present. The VISIR spectrum of this source shows a more pronounced PAH feature. The EW is roughly two times smaller than that measured in the Spitzer spectrum and of the total PAH flux one-third is measured by VISIR. Compared to source 1a we measure a smaller fraction of the total continuum flux, only two-thirds of the continuum flux density measured by Spitzer. The smaller fraction of the continuum measured and the smaller discrepancy between the VISIR and Spitzer EWs reflects the extended structure of the underlying rich cluster complex. In contrast to the case with the relatively simple morphology of source 1, here a smaller fraction of the spatially extended structure is covered by the narrow VISIR slit. Although the morphology of source 2 is simple in our imaging data, the fact that we only measure half of the continuum compared to Spitzer indicates that a more extended component must be present below the VISIR detection limit. Taking this into account the PAH emission must still originate from a more extended region than the continuum.
These results indicate that VISIR is resolving the H ii/PDR complexes. While the ionized gas and continuum emission, and thus the hard radiation field of the most recent star formation, are much more concentrated, a large fraction of the PAH emission originates from a region more extended than 215 pc around the clusters. This could be explained by the presence of a (slightly) more evolved, less massive and more widespread population of field stars by which the PAH molecules are excited. This population can consist of the original, pre-merger disk stars or can be the result of dissolution of clusters formed in previous episodes of star formation. The timescale of the latter process is estimated to be a few 10 Myr in the Antennae (Mengel et al.,, 2005). In this scenario a large fraction of the PAH emission is not directly associated with the currently observed super star clusters and therefore does not trace the very most recent star formation. PAH emission has been detected in less UV-rich environments before (Uchida et al.,, 1998). Li & Draine, (2002) argue that it does not necessarily take hard UV radiation to excite PAHs and produce the observed emission bands in the 6–12 m range. Another possible explanation is the destruction of PAH molecules by hard UV photons up to large distances from the ionizing clusters, which is also claimed to be seen in other starburst galaxies (Tacconi-Garman et al.,, 2005; Beirão et al.,, 2006). However, source 2 shows the strongest PAH emission and has the highest [S iv]/[Ne ii] ratio (0.15 0.02 and 0.34 0.04 for sources 1a and 2 respectively). This significantly higher ratio, indicative of a harder radiation field, would argue against the PAH destruction scenario in this case.
5. Future work
The VISIR N-band observations of the Antennae overlap region presented in this letter show the power of a ground-based mid-infrared instrument mounted on a large telescope. Due to the unprecedented spatial resolution in the mid-infrared, which space observatories lack, VISIR is an excellent tool to use in detailed studies of nearby starburst galaxies. Structures on the scale of giant molecular clouds (80 – 105 pc) are resolved, each hosting one or a number of star clusters.
In order to further investigate the excitation of PAHs in starburst environments, we are currently studying a number of starburst galaxies with a range in age and luminosity.
References
- Beirão et al., (2006) Beirão, P., Brandl, B. R., Devost, D., Smith, J. D., Hao, L. & Houck, J. R., 2006, ApJ 643, 1
- Brandl et al., (2005) Brandl, B. R. et al. 2005, ApJ 635, 280
- Cohen et al., (1999) Cohen, M., Walker, R. G., Carter, B., Hammersley, P., Kidger, M. & Noguchi, K., 1999, AJ 117, 1864
- Gilbert et al., (2000) Gilbert, A. M. et al. 2000, ApJ 533, L57
- Hummel & Van der Hulst, (1986) Hummel, E. & Van der Hulst, J. M., 1986, A&A 155, 151
- Lagage et al., (2004) Lagage, P. O. et al. 2004, ESO Messenger No. 117, 12
- Li & Draine, (2002) Li, A. & Draine, B. T., 2002, ApJ 572, 232
- Mathis, (1990) Mathis, J. S., 1990, ARA&A 28, 37
- Mengel et al., (2005) Mengel, S., Lehnert, M. D., Thatte, N. & Genzel, R., 2005, A&A 443, 41
- Mirabel et al., (1998) Mirabel, I. F. et al. 1998, A&A 333, L1
- Neff & Ulvestad, (2000) Neff, S. G. & Ulvestad, J. S., 2000, AJ 120, 670
- Rubin et al., (1970) Rubin, V. C., Ford, W. K. J. & D’Odorico, S., 1970, ApJ 160, 801
- Saviane et al., (2004) Saviane, I., Hibbard, J. E. & Rich, M. R., 2004, AJ 127, 660
- Tacconi-Garman et al., (2005) Tacconi-Garman, L. E., Sturm, E., Lehnert, M., Lutz, D., Davies, R. I & Moorwood, A. F. M., 2005, A&A 432, 91
- Toomre & Toomre, (1972) Toomre, A. & Toomre, J., 1972, ApJ 178, 623
- Uchida et al., (1998) Uchida, K. I., Sellgren, K. & Werner, M., 1998, ApJ 493, 109
- Vigroux et al., (1996) Vigroux, L. et al. 1996, A&A 315, L93
- Wang et al., (2004) Wang, Z. et al. 2004, ApJ 154, 193
- Whitmore & Schweizer, (1995) Whitmore, B. C. & Schweizer, F., 1995, AJ 109, 960
- Whitmore et al., (1999) Whitmore, B. C., Zhang, Q., Leitherer, C., Fall, M. S., Schweizer, F. & Miller, B. W., 1999, AJ 118, 1551
- Whitmore et al., (2005) Whitmore, B. C. et al. 2005, AJ 130, 2104