Enhancing the Pierre Auger Observatory to the to eV Range: Capabilities of an Infill Surface Array
Abstract
The Pierre Auger Observatory has been designed to study the highest-energy cosmic rays in nature ( eV). The determination of their arrival direction, energy and composition is performed by the analysis of the atmospheric showers they produce. The Auger Surface Array will consist of 1600 water Cerenkov detectors placed in an equilateral triangular grid of 1.5 km spacing. The aim of this paper is to show that the addition of a “small” area of surface detectors at half or less the above mentioned spacing would allow a dramatic increase of the physical scope of this Observatory, reaching lower energies at which the transition from galactic to extragalactic sources is expected.
keywords:
Cosmic rays, Surface Detectors Array, Pierre Auger Observatory, Enhancement.PACS:
96.50.S , 95.55.Vj , 29.40.Ka , 98.70.Sa, , , , and ,
1 Introduction and Motivations
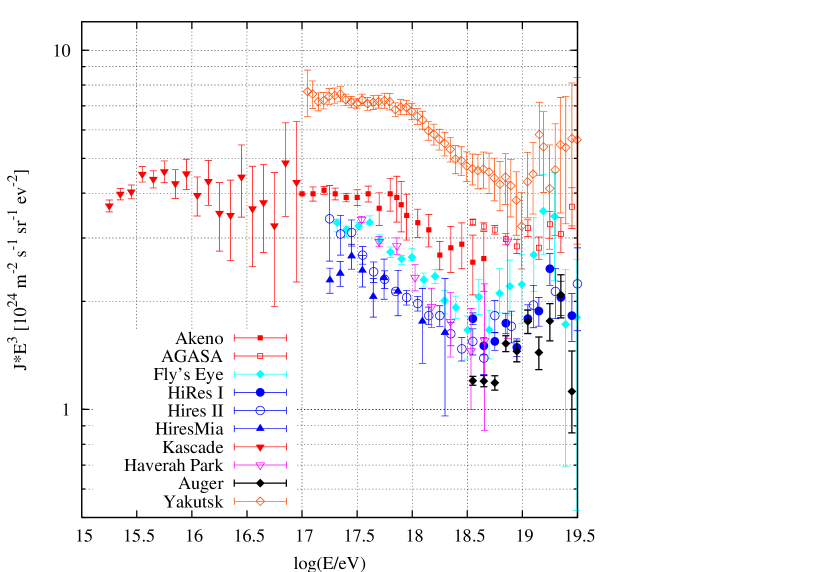
Cosmic rays are observed in a wide range of energies spanning more than eleven decades, from energies below 1 GeV up to more than eV. At lower energies the spectrum follows a simple power law with an exponent equal to -2.7, compatible with galactic supernova remnant acceleration of charged nuclei. The spectrum slope becomes steeper at eV, a feature known as the knee, where the spectral index changes from -2.7 to -3.1. A spectrum compilation from eV (just below the knee) to the highest detected energies is shown Fig. 1. This figure clearly depicts a large systematic uncertainty in energy calibration of among the different experiments (and even larger for the Yakutsk data). Still, when the different experimental data are energy-renormalized there is fair agreement in shape up to eV.
The KASCADE experimental results [1, 2, 3] show evidence that the first knee is essentially caused by a decreasing flux of light primaries: as the atomic number increases, each element-associated knee moves to a higher energy. The KASCADE data in Fig. 1 show that the experiment is finely designed to inspect the knee region, i.e. in the eV energy range. Although it collects data above this energy and up to eV, it does it with larger statistical uncertainties as it operates on the verge of its acceptance.
In the region from to eV the spectrum is reported to show two further traits: a break, called the second-knee, and a broad feature known as the ankle. The second-knee feature has been suggested to be a realization of the knee for the heaviest stable elements, i.e., Fe (see for example [4], [5]). It may represent the end of the efficiency of supernova remnant shock waves as accelerators or a change in the diffusion regime inside our Galaxy. Fig. 1 tells that AKENO [6], Yakutsk, with its latest analysis [7], and Fly’s Eye stereo observe a clear second-knee-like feature. The figure also shows that KASCADE, Haverah Park, AGASA, HiRes and Auger have not enough acceptance at the second-knee region. HiRes/MIA is at the limit of its acceptance, but there is still a hint of the second knee in its data.
This acceptance gap will be filled by KASCADE-Grande, which will have an exposure area ten times larger than Kascade and will attain good statistics up to close to eV by 2009, with composition studies up to (0.7 - 0.8) eV [8]. If so, it will bridge the undoubtedly very important energy range from the first to the second knee, and hopefully cast light on primary cosmic ray composition.
As already mentioned, the second knee might be the end of the stable elements of the cosmic ray Galactic component dominance [4, 5, 9]. Therefore, at higher energies an additional component would be required to account for the observed flux. In Refs. [10, 11] it is conjectured that this additional component arises from extragalactic protons, together with some galactic heavy nuclei to conform a broad second knee feature.
At energies beyond the second-knee feature, the spectrum clearly exhibits a broad depression, called the ankle. As shown in Fig. 1, the ankle has been observed around eV by Fly’s Eye [12, 13, 14], Haverah Park [15], HiRes [16], and it is not contradicted by Auger [17] at its preliminary stage. These results have been confirmed by Yakutsk [7][18] and AGASA [19] but they locate it at a higher energy, around eV. There are at least two physical interpretations of the ankle, intimately related to its nature: it may be the transition between the Galactic and extragalactic components [20, 21, 22] or the result of pair creation by extragalactic protons in the cosmic microwave background [10, 23]. In the former model it is assumed that heavy nuclei are accelerated to the ankle energy within the Galaxy, whereas in the latter only up to the second knee and therefore the importance is not laid on the ankle but on the broad trait which is interpreted as a pair-production dip. It has also been suggested that the ankle is the result of diffusive propagation of extragalactic nuclei through cosmic magnetic fields [24, 25]. To pinpoint the correct model both a reliable, high quality spectrum with a well calibrated absolute energy and a detailed composition study are required, as the pair-production dip model relies on cosmic rays being essentially protons beyond the second-knee [11, 22].
In any case, the energy region spanning from to very likely comprises the transition from Galactic to extragalactic cosmic rays.
1.1 The Pierre Auger Observatory
As of today the forefront experiment in the ultra-high energy cosmic ray arena is the Pierre Auger Observatory [26], that aims at building two observatories, one in each hemisphere. The construction of the Southern Observatory started in 2000. It is already taking data and approaching completion. It is located in the region called “Pampa Amarilla”, close to Malargüe, at the south of the Province of Mendoza in Argentina (), therefore having a full view of the Galactic center and its surroundings. Auger’s two distinctive features are its exceptional size and its hybrid nature. It spans over an area of 3000 km2 and is constituted by a surface array of 1600 water erenkov detectors placed on a 1.5 km triangular grid plus 24 fluorescence detector telescopes placed in 4 buildings on the Surface Detector (SD) array periphery and overlooking it. Consequently, it will provide a large number of events with low systematic uncertainties.
Pertaining to this work is the Auger surface detector array. It has a versatile trigger system [27] designed to operate in a wide range of primary energies and arrival directions. Apart of the customary Signal-over-Threshold (ST) trigger, Auger bases its SD local trigger system on a Time-over-Threshold (ToT) trigger, which requires the signal to be above the ToT threshold (which is much lower than the ST threshold) during at least 325 ns in a 3 s interval. The array trigger requirement is satisfied when at least 3 surface detectors in a compact configuration detect a local trigger in coincidence. With this set of conditions the Southern Observatory is fully efficient above eV [28]. For energies below this value, the detection efficiency decreases rapidly and is composition dependent. Also, the shower’s parameters (i.e. energy, zenithal angle, and core position) reconstruction is degraded since an average of three tanks does not suffice to convincingly sample the shower lateral distribution function (LDF). Detection efficiency also becomes fluctuating with atmospheric conditions (temperature and pressure), introducing unknown uncertainties in sky coverage.
1.2 The Graded Infill
In this paper it is proposed to enhance the Auger acceptance down to eV by means of a graded infill of surface detectors deployed at smaller distances, over an area much smaller than Auger because of the much higher flux at lower energies. This infill array would use the same technology of Auger surface detectors and benefit from the existing knowledge and infrastructure at the site (detector design, data acquisition, analysis tools, etc.). Such an extension would allow: (a) to make a reliable measurement with low reconstruction uncertainty of the energy spectrum from the second knee to the ankle, (b) to make more accurate anisotropy measurements at lower energies avoiding the many spurious effects like the temperature dependence of the event rate and the composition dependent efficiency, and (c) to bridge with a sizeable overlap the data between KASCADE-Grande and Auger, thus increasing the reliability of the results obtained.
An infill would also give an experimental handle on fluctuations at the verge of Auger acceptance, i.e. eV, as it will allow event reconstructions with two or more non-overlapping subsets of detectors at 1500 m distance. In a similar fashion it would permit a very precise experimental determination of the acceptance of the full array, which will also serve to validate detector simulation packages. Additionally, the infill could contribute to a better primary discrimination through a comparison with the dependence of the acceptance on composition.
Three different infill configurations are considered, which can be obtained by adding surface detectors to the Auger grid, which has a spacing of 1500 m. These infills give new triangular arrays with spacings between neighbouring detectors of, respectively, 866, 750, and 433 m. In order to assess the impact of such an enhancement, we study by means of simulations the dependence of the resolution for different shower parameters (arrival direction, core position, lateral distribution of shower particles, energy, etc.) on detector spacing, for different primary energies, composition, and zenith angles. We will conclude that in order to reach the above mentioned energy range with unitary efficiency, a graded infill is required, i.e, an array with a 750 m-grid and, in an even smaller area, an infill of this infill, with a spacing of 433 m between SD s.
This paper is organized as follows: section 2 describes the simulations of showers and detector response, as well as the analysis methods used. Section 3 contains our acceptance calculation for different infill configurations. In sections 4 to 6 the improvement on reconstruction of shower parameters is analyzed. Some considerations about the possible contribution to composition studies are given in section 7; conclusions are presented in section 8.
2 Simulations
For this work we generated a library of extensive air showers using the Monte Carlo simulation code Aires 2.6.0 [29] (see also [30]). Two types of primaries (proton and iron) were considered, arriving with three characteristic zenith angles: , and , with five different energies: eV, eV, eV, eV and eV. For each energy, zenith angle and primary composition, 100 showers were simulated with a uniform azimuthal distribution. With each of these showers, 5 events were generated by triggering the surface array at random impact points.
Using the code SDSim (v3r0) [31], the response of an Auger-like surface array was simulated, consisting of 37 detectors covering a hexagonal area of 52 (see Fig. 2, top left). Three different infill configurations were added to this 1.5 km triangular grid of detectors:
-
•
a) One detector at the center of each triangle of 1500 m, resulting in a triangular grid with a spacing of 866 m (Fig. 2, top right)
-
•
b) Detectors at half the distance between Auger detectors, resulting in a triangular grid with a spacing of 750 m (Fig. 2, bottom left)
-
•
c) Detectors at the center of each triangle of 750 m from grid b), resulting in a triangular grid with a spacing of 433 m (Fig. 2, bottom right)
All Auger trigger levels [27] with their relevant signal thresholds have been used in these simulations. After all trigger requirements are met, a full reconstruction of the arrival direction and the lateral distribution function is performed using the event reconstruction package Er(v3r4) provided by the Central Data Acquisition Group of the Auger Observatory [32]. Reconstructions invoke a Lateral Distribution Function (LDF) parameterization which describes the expected integrated signal at a distance from the shower core. We chose the functional form:
| (1) |
where =1000 m and , and are parameters to be adjusted.
At the lowest energy considered ( eV) the number of showers that are able to trigger the Auger 1500 m-array is marginal and, correspondingly, the determination of the resolution of shower parameters is physically meaningless.
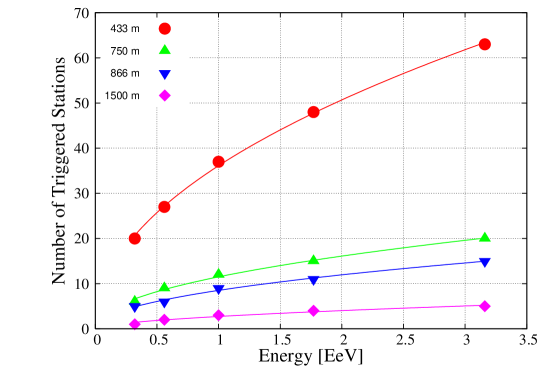
The array acceptance and the arrival direction and LDF reconstruction accuracy depend strongly on the number of stations with signal above threshold. Fig. 3 shows the number of triggered stations versus primary energy for different infill spacings. It is seen that, as the shower area on the ground increases with increasing energy, the number of triggered detectors gets correspondingly larger. For a given detector spacing, this number is expected to be proportional to , where is the slope of the LDF. The values and fits shown in Fig. 3 correspond to iron primaries.
3 Acceptance Determination
The shower detection efficiency of a surface array depends crucially on the spacing between detectors and on the trigger configuration, i.e., the number of detectors that are required to have signal above a certain threshold for the event to be recorded. The surface detector array of the Pierre Auger Observatory, with a spacing of 1500 meters between neighbouring detectors, is nearly fully efficient for showers of more than 3 EeV, if a 3-detector trigger configuration is required [27]. This value has been obtained by Monte Carlo simulations of the detector response.
The instantaneous acceptance of the surface array is given by:
| (2) |
where is the probability of having a positive trigger with at least detectors for a shower of energy hitting the ground in the position , with zenithal arrival direction . In the full acceptance regime, i.e. when , the acceptance of an array of area , and for a maximum zenith angle of , is . For what follows, is set to 60∘.
To calculate the probability , we need to consider the local trigger probability for a single detector (say, the i-th detector of the array). To a good approximation, this probability is determined solely by the total expected integrated signal of the station. Thus, if the -th local station is located at and has an expected signal , its trigger probability is given by
| (3) |
Here we are making the general assumption that the expected signal at a certain distance from the shower core can be modelled by a Lateral Distribution Function (LDF) (see section 1).
To obtain , a set of showers in the 1016 - 1019 eV energy range with zenith angles up to 60∘ were simulated, together with the corresponding detector response to obtain the signals in the detectors. These simulated signals, which include the fluctuations both in the shower development as well as in the detector response, are used to reconstruct the shower core position, energy and incidence angle by adjusting an LDF to the signals in the triggered detectors.
From a large number of simulated showers with different core positions the can be inferred as
| (4) |
where is the number of triggered stations with an expected signal , and is the total number of active stations in that signal bin. Given this , the integral (2) can be calculated numerically.
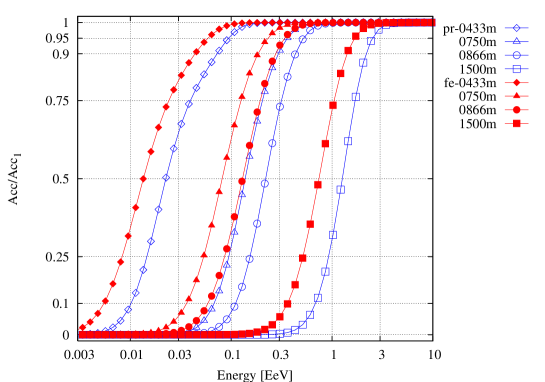
Fig. 4 shows the resulting relative acceptance as a function of energy, for protons (open symbols) and iron (closed symbols) and for the different detector spacings under consideration. It can be observed that a separation of 750 m between detectors guarantees a detection efficiency of 95 for proton (iron) showers with an energy of eV ( eV). With a detector spacing of 433 m, a similar acceptance can be obtained for showers of as low as eV and eV for proton and iron primaries, respectively. According to this calculation, at 3 EeV the Pierre Auger array would attain full acceptance for a 3-detector trigger, irrespective of composition, in agreement with ref. [28].
Considering a differential flux of cosmic rays following a power law with spectral index as quoted by Auger in [17]:
| (5) |
the number of expected events in one year, for events with energy larger than with a zenith angle below , for a detector of area is given by:
| (6) |
Consequently, an infill with an effective area of 20 (for well-contained events), which would comprise a total of 64 surface detectors separated by 750 m, could accumulate a statistically significant number of events with a relatively small effort: only 44 detectors beyond the regular Auger array would be required, which amounts to less than 3 of the full Auger Observatory. These detectors would operate in an energy region in which Auger ceases to be fully efficient (which renders the reconstruction not reliable), down to energies in which the regular Auger array does not trigger any more.
As already mentioned, to detect showers with full efficiency at energies as low as eV, a denser infill, with a detector spacing of 433 m, is required. A statistically significant number of events can be recorded with the addition of only 10 detectors with such a spacing, covering an effective area of 1.6 .
4 Angular Resolution
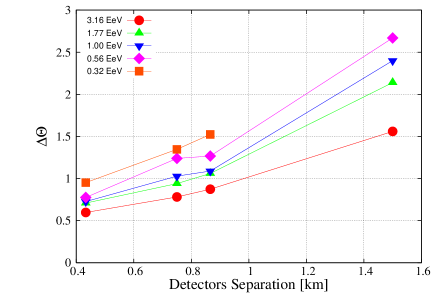
The accuracy in the determination of the arrival directions of cosmic rays is fundamental in the search for their origin and in the study of anisotropies, although it is noted that only neutral particles are not deflected during their propagation in magnetic fields. We define the angular reconstruction uncertainty as the space angle subtended by the real () and reconstructed () directions, being .
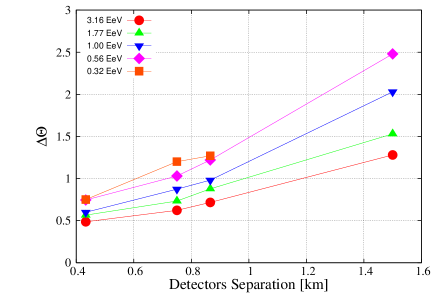
In Fig. 5 we present the 68 confidence level for the arrival direction reconstruction uncertainty, , as a function of detector spacing and shower energy. Results are presented for iron (left) and proton (right) at different injected energies. It can be seen that the angular resolution for events detected by a 750 m infill array will be 2 times better than for a 1500 m-array, giving values close to for proton and iron at eV.
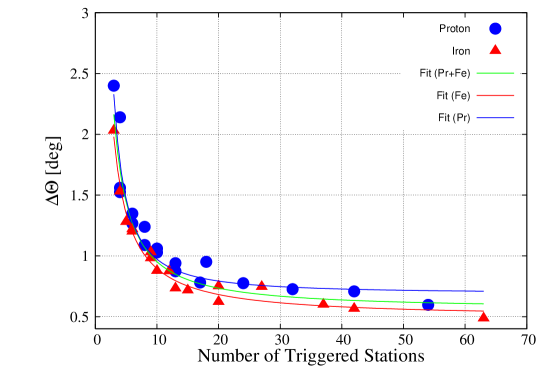
It is worth analyzing the dependence of on the number of triggered detectors , as shown in Fig. 6 for proton and iron primaries and for all considered values of primary energy and detector spacing. As expected, as the average number of triggered stations participating in the reconstruction increases, the resolution of the arrival direction improves. This behavior is seen for both primaries considered. The full lines represent a fit to the data for proton (blue), iron (red) and for both (green). The best fit for the complete set of data is given by .
As the trigger conditions used in our simulations are the same as for the Auger surface detector [27], the dependence of the angular resolution on the number of triggered stations for the 1500 m-array may be compared to that obtained by the Auger SD [35]: the values of corresponding to 3, 4 and 5 stations (, and , respectively) are in good agreement with the results presented in [35], where it is found that for the 3-fold events, Auger has an angular resolution of about , for 4-fold events of and for 5-fold events of .
It is worth comparing the obtained angular resolution with that quoted by other experiments designed to operate in a similar energy range. The 750 m-infill is expected to give an arrival direction resolution of at eV while AKENO achieves a pointing accuracy of [36]. At eV, Kascade-Grande [4] is expected to have an angular resolution of and IceTop [37] claims an accuracy of . These values should be compared to the proposed 433 m-infill which will operate in this energy region and will have an angular resolution smaller than .
5 Core Position Resolution
A very important parameter for the reconstruction of shower geometry and energy is the core position, i.e. the intersection point of the shower axis with the ground. A first estimation is given by the barycenter of the 3 highest-signal detectors. This value is used as input for an iterative fitting process in which the lateral distribution of the detector’s signal is adjusted.
To estimate the expected uncertainty on core reconstruction for different configurations, we evaluate the difference between the real and reconstructed core positions:
| (7) |
where , are the coordinates of the shower core (on the array plane) obtained from the full reconstruction process, and , are the input values for each of the simulated showers. We define the core position resolution (for each energy, angle and primary type considered) as the value at which the integral of the distribution is 68% of the total integral.
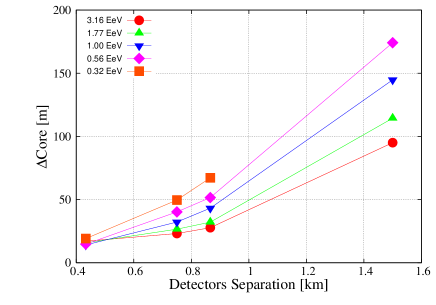
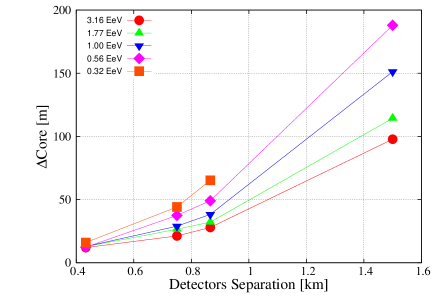
The main results of this section are shown in Fig. 7. Since the lateral distribution function decreases rapidly with distance, the presence of stations near the core plays a fundamental role in its position determination. This situation is favored with smaller spacings between detectors: as the distance between detectors decreases, the core position is better determined. Note that for the Auger spacing of 1500 m the empirical RMS value found in [33] is 102 m, which is in good agreement with our results. Shower development for proton primaries present more fluctuations than iron and this is reflected producing bigger errors. Almost the same behavior as depicted in Fig. 7 for showers with was observed for vertical and more inclined () showers.
At 433 m spacing, the number of triggered detectors is large enough ( 20, see Fig. 3) to have a core resolution of 15 m irrespective of the considered energy and primary type. Regarding the 750 m infill, it is seen that the core position resolution improves by a factor of 4 with respect to Auger. This will have an important impact on the reconstruction, giving a better angular and energy resolution, as the LDF fitting is also more accurate.
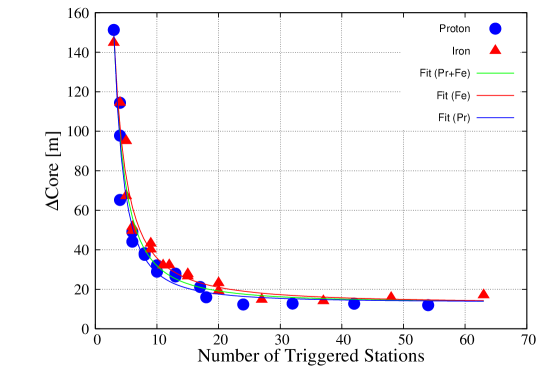
Fig. 8 shows the core position resolution as function of the average number of triggered detectors, for both primary types, and all considered energies and spacings, at . The lines represent the best fit to the values obtained for the different primaries (blue for proton and red for iron) and for both (green). The core position dependence with the average number of triggered stations can be adjusted by 820 m m.
6 S(600) Determination
For the events registered by a ground array of surface detectors, the determination of the energy consists of two steps. First, an energy dependent parameter called is assigned to a given shower. This parameter is the time-integrated signal expected in a surface detector placed at a distance from the shower axis. Its value is obtained by fitting an empirical LDF, with a predefined functional form, to the observed lateral signal distribution and interpolating its value at the distance from the core. The second step involves an energy calibration of . In a hybrid detector such as Auger this can be performed either by resorting to hybrid events, for which both the fluorescence and surface data can be well reconstructed independently [32], or by obtaining the conversion function from Monte Carlo simulations.
The choice of the parameter for the energy conversion is directly related to detector spacing and primary energy considered. It has been proven [33] that 1000 m is the optimal value for a grid with 1.5 km spacing and for energies larger than eV. However, since our goal is to reach lower energies with a smaller detector spacing, the chosen parameter is instead , i.e., the time-integrated signal expected in a detector at 600 meters from the shower core.
The accuracy in the determination of the parameter depends on the detector resolution and on sampling fluctuations. Additionally, this accuracy has also a strong dependence on shower to shower fluctuations which are intrinsic to the shower development and can not be eliminated, as well as on shower direction and relative core position [33]. Moreover, the non-linear interpolation used in the determination of increases even further its uncertainty. It was found empirically [34] that for the Auger grid the statistical uncertainty on reaches 10 (corresponding to an error of 50 m for the core location), the same order of magnitude as the sampling contribution. These values were obtained for showers with E eV.
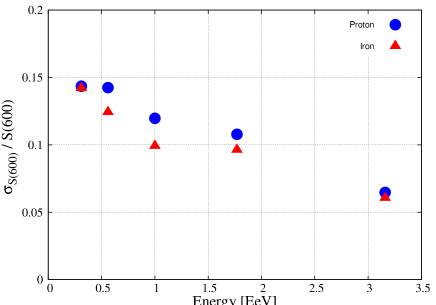
In Fig. 9 we plot the ratio , where is the dispersion of the reconstructed S(600) distribution, for both primaries: iron (triangles) and proton (circles), for different injected primary energies. When the distance between detectors is reduced by a factor of two, the accuracy of the new energy parameter S(600) for eV is for iron primaries whereas for protons this value is about 13 .
7 Primary Composition
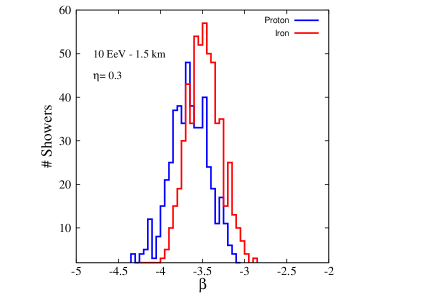
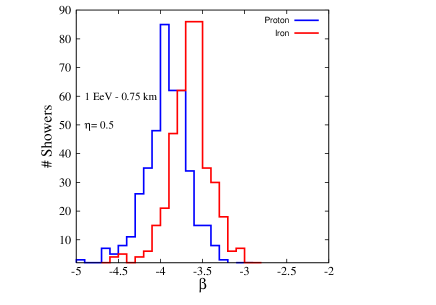
In the same way as the cosmic ray’s energy and arrival direction are better determined using the information provided by an infill array, it is expected that other variables carrying information about the identity of the primary particles would behave similarly. For example, for surface detectors, it is known that the number of muons at a certain distance of the shower core, the slope of the LDF, the arrival time profile of shower particles, and the radius of curvature of the shower front can be employed as indicators of the primary composition [38]. The infill allows not only a more precise shower reconstruction as shown in the previous sections, but also helps towards composition analyses down by another decade in energy, completely covering the second knee and the ankle. As an example, we studied the distribution of the LDF slope and the shower front curvature for different characteristic energies and both primary types, with shower and detector simulations for .
An estimator of the power to discriminate different primaries is given by the parameter defined as:
| (8) |
where and are the medians of the distributions for proton and iron respectively, are the dispersions of the distributions [38].
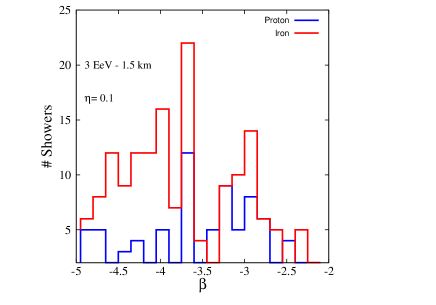
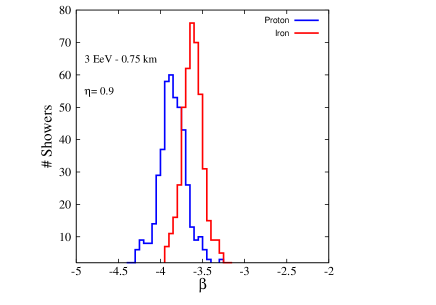
Fig. 10 (top) shows the distribution of the slope of the LDF function (see Eq. (1)), for both primaries and for two different spacings: 1500 m (left) and 750 m (right), at a primary energy of 3.0 EeV, i.e. at the lower limit of Auger full trigger efficiency. An inspection of this top panel shows that is quite inappropriate for primary discrimination for the current Auger spacing but it seems useful for the 750 m infill array.
Fig. 10 (bottom) shows the distributions for eV showers on the Auger surface array (left) and eV showers on the 750 m infill array (right). This bottom panel shows that the 750 m infill has a similar discrimination power as the full Auger array, but at an energy one order of magnitude lower.
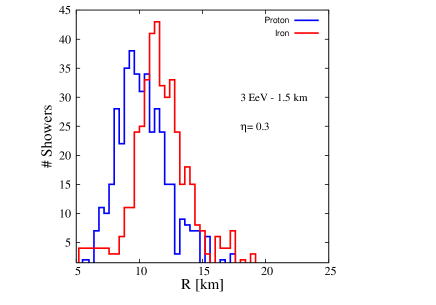
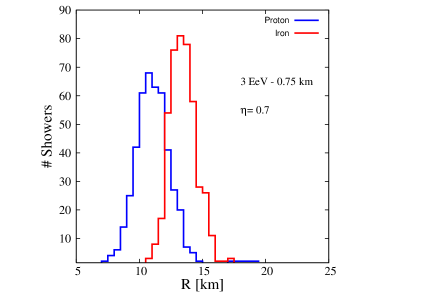
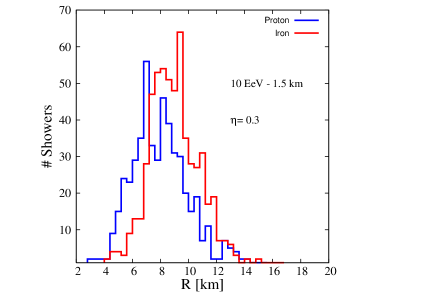
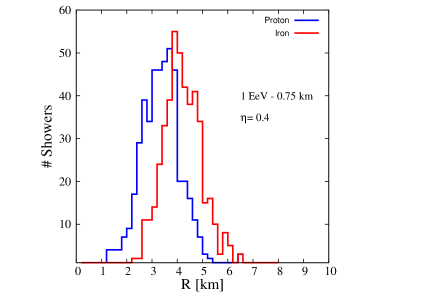
Performing the same kind of analysis with the radius of curvature of the shower front, R, yields similar results. In Fig. 11 (top) the distributions for eV are presented. Once again, at this energy the infill array helps to statistically discriminate between proton and iron, whereas this is seriously compromised for the Auger spacing. The bottom panel shows that the power of discrimination at eV using the infill information is slightly better than that of the present Auger spacing for eV.
The improvement in these parameters gives a clear hint that composition studies would greatly benefit from the information provided by an infill array. Moreover, a multiparametric analysis as suggested in [38], which weights in a large number of variables, would allow a much more precise composition resolution.
8 Conclusions
In this work we showed that enhancing the Pierre Auger Observatory by increasing the density of surface detectors in a small area (20 of the total 3000 ) would bring considerable advantages to the study of high energy cosmic ray physics, at a relatively low cost (3 of the complete Auger SD). From the operational point of view, such an enhancement could be smoothly integrated to the existing surface array.
With an infill array much could be gained in shower reconstruction at the lower limit of Auger energies: a better LDF fitting due to a larger number of triggered detectors, a 2 and 4 improvement in arrival direction and core position resolution respectively and a relative uncertainty of less than 15% in determination.
Also, an infilled array with 750 m spacing is equivalent to 3 superimposed Auger-like arrays of 1500 m spacing. Single events can then be reconstructed with 3 different subsets of detectors at Auger spacings, allowing a direct study of fluctuations and uncertainties. The data coming from an infill array would thus serve to check the behavior of the original array and to validate further the end-to-end simulation and reconstruction processes.
The extension of the detector’s full efficiency interval down to eV to englobe completely the second knee and the ankle regions would be difficult to overestimate, allowing to test in an unprecedented way competing models of Galactic and extragalactic cosmic ray production and propagation. To this end, better composition analyses could be performed since distinctions among theoretical models largely depend on the primary type. Furthermore, an additional independent cross-check could be achieved by overlapping with KASCADE-Grande in the lower energy region.
Acknowledgements
We thank the Department of Mecánica Computacional of Centro Atómico Bariloche for providing us with the computing facilities for shower simulations. This work is partially supported by CNPq and FAPESP (Brasil) and CONICET, CNEA and IB (Argentina). We thank Dennis Allard for providing us data for Fig. 1.
References
- [1] Kampert K. H. et al.(KASCADE Coll.), astro-ph/0405608.
- [2] Aglietta M. et al. (EAS-TOP and MACRO Coll.), Astrop. Phys. 20 (2004) 641.
- [3] Antoni T. et al. (KASCADE Coll.), Astropart. Phys. 24 (2005) 1-25, astro-ph/0505413.
- [4] Haungs A. et al. (KASCADE-Grande Coll.), astro-ph/0508286.
- [5] Hoerandel J. R., Astrop. Phys. 19 (2003) 193-220.
- [6] Nagano N. et al., J. Phys. G 18 (1992) 423.
- [7] Glushkov A. V. et al., Proc. 28th Int. Cosmic Ray Conf. (Tsukuba, Japan) (2003) 389.
- [8] Haungs A., private communication.
- [9] Hoerandel J. R. et al., astro-ph/0508015.
- [10] Berezinsky V. S., Gazizov A. Z. and Grigorieva S. I., Phys. Lett. B 612 (2005) 147 and astro-ph/0502550.
- [11] Berezinsky V. S., astro-ph/0509069.
- [12] Abu-Zayyad T. et al., Astrophys. J. 557 (2001) 686.
- [13] Bird D. J. et al., Phys. Rev. Lett. 1 (1993) 3401.
- [14] Bird D. J. et al., Astrophys. J. 441 (1995) 144.
- [15] Ave M. et al., Proc. 27th Int. Cosmic Ray Conf. (Hamburg, Germany) 1 (2001) 381, astro-ph/0112253.
- [16] HiRes Collaboration, Phys. Rev. Letters 92 (2004) 151101.
- [17] Auger Collaboration, First Estimate of the Primary Cosmic Ray Energy Spectrum Above 3 EeV from the Pierre Auger Observaotry, 29th Int. Cosmic Ray Conf. (Pune, India) (2005), astro-ph/0507150.
- [18] Ivanov A. A., Knurenko S. P. and Sleptsov I. Ye., Nucl. Phys. B (Proc. Suppl.) 136 (2004) 3-11.
- [19] Takeda M. et al., Astrop. Phys. 19 (2003) 447-462.
- [20] Hillas A. M., Nucl. Phys. B (Proc. Suppl.) 136 (2004) 139.
- [21] Wibig T. and Wolfendale A. W., J. Phys. G 31 (2005) 255.
- [22] Allard D. et al., astro-ph/0505566.
- [23] Aloisio R. and Berezinsky V. S., Astrophys. J. 625 (2005) 249.
- [24] Kalmykov N. N. et al., Proc. 26th Int. Cosmic Ray Conf. (Salt Lake City, USA) 4 (1999) 263.
- [25] Ogio S. and Kakimoto F., Proc. 28th Int. Cosmic Ray Conf. (Tsukuba, Japan) 1 (2003) 315.
- [26] Auger Collaboration, Nucl. Inst. Methods 523 (2004) 50. See also http://www.auger.org.ar.
- [27] Allard D. et al., The Trigger System of the Pierre Auger Surface Detector: Operation, Efficiency and Stability, 29th Int. Cosmic Ray Conf. (Pune, India) (2005).
- [28] Allard D. et al., Aperture Calculation of the Pierre Auger Observatory Surface Detector, 29th Int. Cosmic Ray Conf. (Pune, India) (2005).
- [29] Sciutto S. J., AIRES: A System for Air Shower Simulations 2.6.0 (2002), http://www.fisica.unlp.edu.ar/auger/aires/.
- [30] Knapp J., Heck, D., Sciutto S. J., Dova M. T. and Risse M., Astrop. Phys. 19 (2003) 77.
- [31] Dagoret-Campagne S., http://lpnhe-auger.in2p3.fr/Sylvie/WWW/AUGER/DPA/.
- [32] CDAS, Central Data Acquisition System, Pierre Auger Collaboration, private communication.
- [33] Auger Collaboration, Statistical and Systematic Uncertainties in the Event Reconstruction and S(1000) Determination by the Pierre Auger Surface Detector, 29th Int. Cosmic Ray Conf. (Pune, India) (2005).
- [34] Barnhill D. et al., Measurement of the Lateral Distribution Function of UHECR Air Showers with the Pierre Auger Observatory, 29th Int. Cosmic Ray Conf. (Pune, India) (2005).
- [35] Auger Collaboration, Angular Resolution of the Pierre Auger Observatory, 29th Int. Cosmic Ray Conf. (Pune, India) (2005).
- [36] Hayashida N., et al. Astrop. Phys. 10 (1999) 3031311.
- [37] Stanev T., astro-ph/0501046.
- [38] Supanitsky A. D. et al., 29th Int. Cosmic Ray Conf. (Pune, India), arg-supanitsky-DA-abs1-he14-poster (2005).
- [39] Bird D. et al., Astrophys. J. 424 (1994) 491.
- [40] Abbasi R. U. et al. (HiRes Coll.), Phys. Lett. B 619 (2005)271.
- [41] Kalmykov N. N. and Ostapchenko S. S., Phys. Atom. Nucl. 56 (1993) 346.