Cosmic Rays: Recent Progress and some Current Questions
Abstract
A survey of progress in recent years suggests we are moving towards a quantitative understanding of the whole cosmic ray spectrum, and that many bumps due to different components can hide beneath a smooth total flux. The knee is much better understood: the KASCADE observations indicate that the spectrum does have a rather sharp rigidity cut-off, while theoretical developments (strong magnetic field generation) indicate that supernova remnants (SNR) of different types should indeed accelerate particles to practically this same maximum rigidity. X-ray and TeV observations of shell-type supernova remnants produce evidence in favour of cosmic-ray origin in diffusive shock acceleration at the outer boundaries of SNR. There is some still disputed evidence that the transition to extragalactic cosmic rays has already occurred just above eV, in which case the shape of the whole spectrum may possibly be well described by adding a single power-law source spectrum from many extragalactic sources (that are capable of photodistintegrating all nuclei) to the flux from SNRs. At the very highest energy, the experiments using fluorescence light to calibrate energy do not yet show any conflict with an expected GZK “termination”. (And, in “version 2”,) Sources related to GRBs do not appear likely to play an important role.
1 Introductory overview
Because cosmic rays span such a huge range of energy, it is natural to start from a very deceptive broad view of the cosmic ray spectrum, such as that shown in figure 1, due to Gaisser ([2005]), which shows the flux reaching the Earth, in the form of the energy carried by particles per unit interval of , or , where is the number of particles arriving per unit interval of time, area, solid angle and kinetic energy, E.
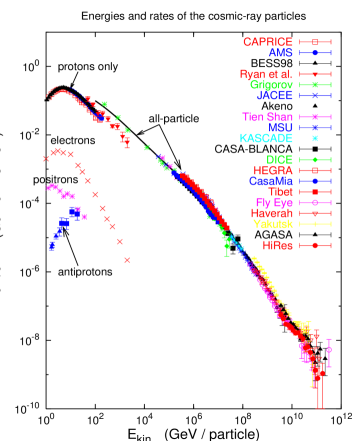
At the lowest energies, the fluxes of different nuclei can be measured, protons being the most numerous, and other common nuclei having practically the same shape of spectrum as a function of rigidity (momentum/charge energy/charge at these relativistic energies). To identify the particles clearly, they have to be detected before they are broken up in the atmosphere, in detectors carried by balloons or satellites, and the flux is too low for this above about GeV ( eV): beyond here the total flux of all particle types can be recorded by air shower experiments. The well-known power-law spectrum, holds to a good approximation before the “knee”, the downward bend near eV, the fall-off below 10 GeV being a very local effect within the solar system. For 3 decades of energy above the knee the flux continues to fall somewhat more steeply, to the “ankle”, where the rate of fall briefly becomes less steep again, until statistics and possibly flux peter out near Gev ( eV). At energies of several GeV there is good evidence from gamma rays produced in nuclear collisions (e.g. Hunter et al. [1997]) that the cosmic rays originate in the Galaxy, and diffuse out; and the belief that the major source is acceleration at the outer shock boundaries of expanding supernova remnants (SNR) has strengthened recently in several ways, outlined below.
It now seems likely that this bland shape masks a superposition of bumps and variations which each tell their own story, though few of them can yet be disentangled clearly, so this field of diagnosing the components is still very active.
Recent experimental work at Karlsruhe (discussed in section 2) has made it seem very probable that the individual nuclear components each fall off rather steeply at a magnetic rigidity near V (i.e. at energies eV for protons, eV for helium nuclei, extending to eV for iron, the heaviest common nucleus). Assuming this to be right, even though the point of turn-down for iron is just beyond the range of this experiment, the main Galactic component is made up of elemental components each extending to an energy near eV (where e is nuclear charge), beyond where the fluxes turn down much more sharply than does the total flux that is plotted in figure 1. Despite the separate bends, the total flux looks deceptively smooth after steepening a little at the knee, as shown in figure 1, at least as far as eV.
Beyond eV questions arise. The more extended gradual fall-off between the knee and the ankle has long been puzzling. Does some Galactic source (magnetars?) extend the spectrum of local particles well beyond eV (presumably highly-charged particles to allow them to be disoriented by Galactic magnetic fields)? A widespread view had been that some such additional component partly trapped within our galaxy eventually fell below the level of cosmic rays circulating throughout the universe, and originating in rarer far more energetic sources. The “ankle” might then mark the point where such extragalactic cosmic rays became dominant, but this is not necessarily so, as will appear from the discussion in section 4.
One much older view of the knee-to-ankle region had been that the Galactic sources might accelerate particles to much higher energies than eV, and the extended slightly steeper slope beyond the knee marked an increasingly rapid escape of particles from Galactic magnetic fields at higher energy, a view the present author mistakenly used when discussing anisotropies in a review 22 years ago ([1984]), when it appeared that there was an increasing anisotropy reflecting such a decreasing residence time. However, with much greater counting statistics, we now see no clear anisotropy apart from a small one in the region to eV. Unless there is indeed a high-Z flux generated by Galactic magnetars, it now seems that the extragalactic component becomes very important at a much lower energy than previously thought. If, then, there are no low-charge galactic particles above eV, the failure to find convincing anisotropies would be explained. These topics, and the particles of extreme energy, are discussed below.
Cosmic-ray electrons will be mentioned only briefly. Figure 1 shows that at a given energy they are much less numerous than protons — 1–2% around a GeV and even less at higher energies — though their strong synchrotron radiation makes their presence in distant regions much easier to detect than that of protons and nuclei. The electrons may originate in SNR as we believe do the hadrons, or in plerions (e.g. the Crab Nebula), but if termination shocks of ultrarelativistic winds produce the acceleration in the latter, they probably accelerate an electron-positron medium, and the low relative abundance of cosmic-ray positrons indicates that plerions do not form a major source.
2 The upper end of the main Galactic component of cosmic rays
Figure 2 shows an enlarged view of the spectrum from to eV, by plotting .

Above eV, the plotted data points come from mature air shower experiments selected to represent several different techniques used for obtaining the shower energy — density of particles at the ground, number of particles near shower maximum, Cherenkov or fluorescent light measuring the energy deposition in the atmosphere, or very detailed measurements of many particle components — and all using very similar quark-gluon-string (QGS) hadronic interaction models to make detailed predictions of the observed shower parameters. (References to the experiments in Hillas [2005], [2004]) Up to eV, such selected experiments are seen to be in very good agreement, though there are two high-exposure experiments at the highest energies which revealed discrepancies still to be understood, and which the Auger project was designed to clarify: the Akeno-AGASA spectrum seems to drift gradually above the others, and the Yakutsk spectrum seems to assign systematically higher energies. The region above eV will be discussed in section 4. At energies below the knee, some measurements of proton, helium, CNO and iron nuclei made above the atmosphere are shown, though most helium points are omitted for clarity because of wide scatter.
The point of this diagram is to show that air shower measurements fit well on to the direct measurements made above the atmosphere, so we can try to understand the whole spectrum in detail. In particular, the slight steepening of the spectrum from knee to ankle was not understood. One anticipated that accelerators would be able to accelerate each type of ion to the same magnetic rigidity, indeed with very similar rigidity spectra, except insofar as different accelerators (SNR) perhaps had expanded into gas of different composition.
In the air shower domain, where direct identification of the primary particles is not possible, two methods of making rough estimates of the primary particle’s mass have been attempted for a long time: (a) estimation of , the depth ( in ) in the atmosphere at which the shower reaches its maximum number of particles; or (b) measurement of the proportion of muons in the shower when it reaches the observing level (“”). Both depend on the fact that with a primary particle of energy , containing nucleons, each nucleon to a first approximation makes its own shower of energy (coaxial with the others); and that the number of shower multiplication steps taken (and the mass of air traversed) for the particles to fall to the critical energy, at which multiplication ceases, increases logarithmically with (), and hence falls with , for showers of a given . The backbone of the shower is a hadron cascade, in each step of which 1/3 of the pions decay instantly to drain off energy into the electromagnetic shower, so the more cascade steps that are required before the charged pion energies get down to tens of GeV, at which decay to muons can occur, (i.e. the higher is ), the less is the fraction of energy left for muon production.
Both approaches have provided unclear indications that the mean mass starts to rise beyond the knee, but the observable effects are not large, a situation which is not surprising if the mean mass changes gradually, as one element after another becomes less prominent. In the present author’s opinion, a notable advance has been made in recent years, after several decades of inconclusive observations in this difficult area. If one wants to do better in elucidating the composition, and separate the showers of different primary mass, , the approach would give better resolution (separation of curves for different mass groups, relative to shower-to-shower fluctuation), than the — but only if a very extensive area of muon detectors is available to make statistically excellent measurements in individual showers. In the KASCADE array at Karlsruhe, a very densely packed array of electron and muon detectors was set up for this purpose, and figure 2 shows how their attempted analysis of the cosmic rays into mass groups lines up with the direct measurements at lower energies. Despite the results looking somewhat confusing, they are the best we have, and deserve some scrutiny.
The dotted lines starting at eV indicate the original preliminary unfolding of the spectrum into components H, He, CNO and Fe (Haungs [2003]), and are shown only to demonstrate the nature of the pattern, with individual knee energies consistent with a proportionality — a magnetic effect which could be related to the dimensions of the accelerator. The KASCADE workers would not wish any emphasis to be placed on this earlier version, but it gives an orientation to the reader not very familiar with this field, as their later analysis is harder to assimilate. In their more detailed attempt to unfold the spectrum into even more components (Antoni et al. [2005]) the results became somewhat unstable in the centre of the mass range, since the distributions for different mass groups overlap greatly, and where changing from a QGSJET hadron interaction model to a SIBYLL model changed the predicted a little. The upper and lower edges of the hatched regions in figure 2 correspond to the flux deduced to correspond to H (or He or Si-Fe) when using one or other of these models. In the particular case of the SIBYLL curves, the “effective maximum energy” for particular nuclei may be taken, say, as the energy at which the flux has fallen by half a decade from its peak value, near its knee, and is at about 6, 11, 34 and eV for H, He, CNO, and Fe — quite consistent with proportionality to Z (=1, 2, 7, 26). For clarity, the very uncertain CNO fluxes are not shown: at eV, the slight model differences cause SIBYLL to attribute the majority of the flux to CNO, whilst QGSJET labels it as He. So one cannot yet distinguish all these nuclear groups in the middle of the range; but the interesting features are that (a) the individual elemental fluxes appear probably to fall sharply above a certain magnetic rigidity — E near eV) — though only separated clearly for the case of hydrogen; (b) even before eV, the proton flux may indeed have been falling a little more steeply than the others, so that protons do not dominate at the knee; and (c) the flux of the heaviest nuclei — Si-Fe, and possibly CNO — may rise distinctly immediately before the knee. This rise may largely be an artefact of the analysis (and difficulty in including Ne-Mg components), though it might be a first indication of the additional acceleration and release of newly-synthesised elements from the exploding star itself, in the very early life of the SNR — perhaps injected at the inner shock.
These elemental components add up to an all-particle flux matching the data points as far as eV, but then falling steeply, somewhat as shown by the line TG (total Galactic) if the iron does indeed have a steep rigidity turn-down like the lighter elements.
In summary, there is reasonably good initial evidence that the spectra of individual nuclear components do turn down much more sharply than would be guessed from the slightly-bent knee of figure 1. Why does the superimposed output from many SNR of different mass and in different environments yield a distinct “maximum” energy? And why does the flux not drop more steeply above eV, like the line TG? Does the overall Galactic component indeed turn down rather sharply here? Evidence for a change in the nature of the particles above eV, through further well-calibrated measurements of shower properties here will be welcome.
Before describing work on the high-energy extension of the spectrum, developments in theoretical understanding of the source of Galactic cosmic rays and the distinct maximum near eV, and relevant new observations of SNR will be discussed.
3 Further support, and questions, for the model of origin of Galactic cosmic rays at the boundaries of expanding SNR
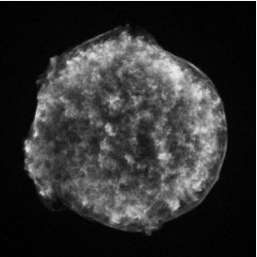
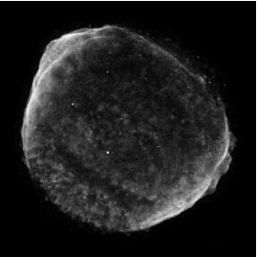
Radio telescopes have for long drawn attention to supernova remnants (SNR) as principal sources of multi-GeV electrons, through their synchrotron radiation, but high-energy X-ray images of supernova remnants, especially by CHANDRA [2005], have revealed fresh detail. Figures 3 and 4 show an extremely narrow smooth shell of synchrotron radiation at the outer edge of SN1006 and Tycho’s SN, outside the thermal heavy-element gas. The extreme thinness is consistent with the very short radiative cooling lifetime of extremely relativistic electrons ( eV) in magnetic fields of several hundred microgauss (Völk, Berezhko & Ksenofontov [2005], Ballet [2005]) — very persuasive evidence that this SNR outer boundary is indeed where the relativistic electrons do gain their energy, rather than, for instance, in the highly turbulent region generated from the contact discontinuity, clearly seen in the Tycho image, which was once considered as a possible site of acceleration. In Cas A a very thin outer emitting layer is also seen, but is much less smooth, evidently because of the disturbance of the expansion while passing through a shell of wind-compressed gas that was shattered en route (leaving behind the famous clumpy knots).
The model of diffusive shock acceleration at the boundaries of SNR provides much the most persuasive theoretical basis for interpreting Galactic cosmic rays, but as the complex details of particle-plasma interactions are far from fully understood yet, an optimistic simple-minded approach will be taken, to assess progress. The main features of this model are that, to a first approximation at least, it naturally (a) produces an extended power-law energy spectrum of about the right slope, (b) is such an efficient energy converter that it is hard to find a convincing rival model, (c) it explains several features of the elemental composition of cosmic rays, and (d) now seems likely to explain a distinct spectral knee (for SNR sources) at the observed position, which was not the case a few years ago. Consideration of the relationship between these basic aspects will reveal some of the remaining questions. The features (a) to (d) will be discussed in turn.
(a) At an over-simple sharp shock, where no pressure can be transmitted ahead of the shock, the density jumps by a factor 4, there is correspondingly a sudden change in bulk gas velocity across the shock, and some individual particles diffusing in the gas can cross back-and-forth, gaining energy by the well-known Fermi process of bouncing between two relatively convergent gas masses. The resulting momentum spectrum behind the shock is , where is between 2, for highly supersonic flow, and about 3 when the speed has slowed down to a mildly supersonic level. In a SNR, most of these particles remain trapped (new ones being constantly accelerated while those previously accelerated are gradually adiabatically decelerated by the expansion), until some stage when the old remnant condenses, breaks up, and releases them. It is unclear just what is the spectral exponent at the break-up stage. To produce Galactic cosmic rays with a spectrum , as seen over most of their energy range, one would need if their residence time in the Galaxy , as for Kolmogorov scattering, which most probably governs their propagation. (Nuclear spallation studies at low energies gave an apparent dependence of residence time within the Galactic gas, but this was distorted by effects of moderate energy changes during scattering, and would in any case have led to abnormally large anisotropy near eV.) The variation of the spectrum within a SNR up to the time of release still needs a careful study to check that this is reasonable. Inside a young SNR, would be close to 2. However, the cosmic rays themselves must broaden the shock, as shown below, so that numerical studies of particle acceleration in SNR have predicted a departure from a simple power law, with a steeper slope at very low energies (GeV), and a flatter slope () within 1 or 2 decades of the maximum energy. There is as yet no sign of such a general upturn in the cosmic-ray spectrum, so we must look to TeV telescope arrays such as HESS, VERITAS and MAGIC to seek this upturn in young SNRs such as Tycho.

(b) One needs a very efficient accelerator for cosmic rays, for the rate of supply of cosmic ray energy in the Galaxy needed to compensate for leakage out is W, or about 1/6 of the erg of kinetic energy (excluding neutrinos) supplied 3 times per century by exploding supernovae (see e.g. Hillas [2005]). (The assumption of 3 SN per century is perhaps the most uncertain number involved here.) The underlying reason why this process is so efficient is illustrated in figure 5, a schematic section through a small part of the shock, seen in the rest frame of the hot compressed gas C behind the shock. Unshocked gas enters at speed from the external medium A, and is stopped (in this frame) by the pressure of the hot gas behind the shock. But, in this frame, this pressure does no work, so the bulk motion stops, but the incoming particles retain their kinetic energy and their speed , though their directions are randomised in a very narrow transition layer. If the layer B of compressed gas has been added in the last second, the shock has receded by this distance: it has a recession velocity upwards. However, the particles are moving around with speed , where is the compression ratio across the shock: the particle speed is thus considerably greater than the shock recession speed , and a large proportion of the particles can readily scatter (diffuse) back to re-cross the shock (thick random-walk line in the diagram) and start on the repeated “bouncing” process of Fermi acceleration. Potentially, most particles can get injected into the acceleration process, and steal all the available energy. Presumably the thin transition layer will have to adjust until there is no catastrophe. A considerable reduction of the gas temperature will be required, and as a crude representation of this one may expect that about half the internal energy of the shock-heated gas is taken by the “cosmic rays”. (It seems that this should rightly be referred to as “the other Fermi gas”, having a modification to the classical thermal momemtum distribution at high momenta quite different from the truncation seen in the well-known quantum “Fermi gas”, but of a form also deriving from Fermi.) Even if half the energy is in the Fermi tail, this may represent only to of the particles. Then, as a result of the accompanying adiabatic expansion of the SNR gas, one would expect the SNR’s energy to be divided about equally between bulk kinetic energy of outflow, ordinary thermal energy and relativistic “cosmic-ray energy”, for a long time during the evolution. More detailed simulations by Berezhko, Ksenofontov and collaborators (e.g. Berezhko et al. [1997]) are roughly in line with this.

However, there is a question of suppression of injection. Where magnetic field lines (inside the SNR) cross the shock front at a large angle to the shock normal, ions guided by the field will be constrained to move towards the front at a rate less than (example X in figure 5), and the re-crossing process could never start. Völk [2006] uses an estimate that 20% of the front would be an active accelerator for this reason. The ASCA and CHANDRA images of SN1006 (figure 4) may indeed exemplify this. However, Tycho and other SNR show activity over a large proportion of the front (perhaps where the field has become more turbulent). If, then, one crudely takes the average proportion of the SNR surface over which injection is not magnetically suppressed to be about 50%, one is left with 1/6 of the SNR energy being present in cosmic rays, which is in good agreement with what is required to account for Galactic cosmic rays.
But the cosmic rays around the shock (figure 5) have gained their energy by bouncing from the incoming gas (zone A). They have taken their energy from this inflow, hence slowing it down just before it reaches the shock. Figure 6 shows schematically the gas velocity plotted against distance from the shock — this time, velocity relative to the shock. As a consequence of this “precursor” structure, the most energetic cosmic rays, which diffuse further around the shock during their “bouncing”, experience a greater velocity jump, and gain more energy at each excursion; so the spectral exponent should be less than 2 (say, 1.8) for the upper 2 energy decades or so (see e.g. Völk et al. [2002]). This seems an inevitable consequence of efficient acceleration, and it now seems surprising that the observed cosmic ray spectrum is as “straight” as is generally observed! One consequence of cosmic rays stealing a large fraction of the internal energy of the hot gas is that the usual hydrodynamic models of SNR will be inaccurate, especially regarding the gas temperature (Ellison et al. [2004]). It has been noted that the compressed shell shown in the CHANDRA image of Tycho is thinner than expected from a hydrodynamic approach omitting cosmic rays (e.g. Warren et al. [2005]).
(c) The elemental composition of the accelerated particles should be that of the gas swept up by the outer shock. In figure 5 these ions all enter at the same speed, , and the Fermi acceleration builds up a power-law momentum spectrum starting from this initial velocity: the result is that the different types of accelerated particle should have the same proportions as in the gas if measured at the same velocity or Lorentz factor — i.e. at the same , as observed — a trade mark of the shock injection. Observed preferences for certain elements have been modelled as effects of the modified shock structure (figure 6) which gives some increased energy gain to particles of higher mass-to-charge ratio as they penetrate a little further ahead of the shock while bouncing, especially for those ions which on entry are initially bound inside charged interstellar grains (Meyer et al. [1997] and Ellison et al. [1997]). (This model re-interprets abundances supposedly related to an atom’s first ionization potential as instead reflecting its condensability into grains.) It has become standard doctrine that atoms from the external medium, and not the supernova ejecta, are thus accelerated, and the explanation of the elemental composition is one of the main strengths of the shock acceleration model. However, during the early phase of the SNR expansion, the ejected SN material sweeps into the compressed shell through its inner shock, and there seems to be no reason why its ions should not be accelerated there. Normally, this body of accelerated supernova gas would then suffer great adiabatic cooling during the huge expansion of the SNR before release, and so would make a very small contribution to cosmic rays, but there may perhaps be an exception at the knee, mentioned in paragraph (e), below.
(d) It was long believed that diffusive shock acceleration would yield a maximum energy near eV (Lagage and Cesarsky [1983]) — or a factor 10 higher if one overruled Lagage and Cesarsky’s objections to Bohm scattering in the internal magnetic fields. Lucek and Bell ([2000]), however, have reported numerical simulations of interactions between ions streaming in a magnetic field (as happens where cosmic rays diffuse just ahead of a shock) and the plasma carrying the magnetic field, showing that Alfvén-like magnetic disturbances grew very rapidly to magnetic amplitudes much greater than the initial magnetic field, and Bell and Lucek ([2001]) went on to consider the likely magnitude of highly contorted magnetic field that would be generated just ahead of the SNR shock by the particles being accelerated. Their result can be expressed in the following formula (S.I.units) for the r.m.s. magnetic field strength arising only from Fourier components within one e-fold range around the wavelength resonating with particles of any particular energy
| (1) |
where . Here is the velocity of the shock advancing into a medium of density , and is the pressure of accelerated particles in one e-fold range. The quantity in an efficient shock. (Although this magnetic energy is proportional to the ram pressure, it is less than equipartition strength.)
This dependence will change the systematics of the maximum energy of the spectrum of accelerated particles in SNR. Firstly, is attained very early, well before the sweep-up time “”, and the most energetic particles then very soon escape, as the field weakens. Secondly, the dependence of introduces a similar factor into the rate of gain of energy, which almost cancels a dependence , coming from the time available for energy gain, found in previous models for where was constant; and Hillas ([2005]) found with a “toy model” for spectrum generation, that several different kinds of SNR placed in different external environments generated spectra terminating in sharp downward bends all very close to V rigidity. Other theoretical studies have examined the effect of various other wave-field-damping processes and nonlinear wave interactions, to expand the treatment of Bell and Lucek. Ptuskin and Zirakashvili ([2006]) quote model energy spectra with a knee near the same place, and remark on the very steep fall above the knee. Marcowith et al. ([2006]) expect to get a maximum energy near the observed knee, and also expect to get a cosmic-ray spectral index steepened to (for explosions into the warm phase of the ISM) because of energy losses by the bouncing particles when forming the strong magnetohydrodynamic turbulence. Bell did not expect this effect to be significant, though. Clearly there is much to do before we understand sufficiently fully these strong ion-plasma interactions, but if the prescription of Bell and Lucek is about right, one may well be able to account for a distinct knee in the superimposed spectra of many different SNR — virtually at the observed position. There is some observational evidence that the magnetic field in SNR has reached levels of several hundred microgauss, some of it from the rapidity of the cooling of relativistic electrons behind the front (Völk et al. [2005], Ballet [2005], Vink).
(e) If it is true that the most energetic particles are generated early, especially when a fast shock ploughs through a dense fossil stellar wind, and these particles are soon released as the magnetic field weakens, it seems possible that heavy elements from the supernova ejecta may be accelerated to knee-energies at the inner shock, and allowed out very early, before they are adiabatically cooled. This may perhaps make some contribution to the Si-Fe component in the KASCADE elemental unfolding shown in figure 2.
The beautiful CHANDRA pictures show only radiation by relativistic electrons, and are blind to protons. We now look to TeV gamma rays to show us the hadrons in SNR., when doubts about the TeV contribution from inverse-compton scattering of electrons are clarified. Up to now, excellent images from HESS reveal striking shells in cases of complex dense environment that provide a massive target for the cosmic rays to interact with, but are hard to analyse quantitatively (especially RX J1713.7–3946, Aharonian et al.[2004]). However, these TeV gamma rays are most probably due to hadrons rather than electrons ([2005]), and if in SNR is indeed larger than previously thought, there must be fewer electrons present to make the observed synchrotron radiation, so the problem of electron background in TeV SNR images may be receding. The instrumental sensitivity is still not adequate to study SN1006, a very clean system but in a region of very low gas density. Before long, Tycho’s and Kepler’s SNRs and Cas A should be measurable.
This has been an optimistic assessment of the SNR scheme for cosmic ray generation, but observational challenges should be taken seriously. Plaga ([2004]), for instance, has emphasised two problem areas. Firstly, the absolute TeV luminosity of certain SNRs or SNR features is well below what has been reasonably expected if they are efficient hadron accelerators; and secondly, the Galactic distribution of cosmic-ray protons has not appeared compatible with a much more centrally concentrated supernova distribution. As regards the first point, we should soon have more sensitive measurements to examine. As regards the second, I believe that the deduction of cosmic-ray radial distribution beyond kpc from the Galactic Centre from gamma ray maps is, so far, inherently wildly inaccurate, as one can see by comparing the very different distributions obtained by different methods (e.g. Strong and Mattox, [1996], Bloemen, [1984], Hunter et al., [1997]).
4 Extragalactic cosmic rays
Above eV the magnetic field in the vicinity of the Galaxy would not trap very effectively even the very heaviest nuclei; but there is still little clear evidence of anisotropy, so the flux here is presumed to originate much further away, most probably in systems dominated by jets from active galactic nuclei in order to provide the necessary exceptional energy source. In this case, the flux is expected to drop sharply above eV (the GZK effect) due to energy losses accompanying pion production reactions between nucleons and cosmic microwave background photons (CMBR), which would greatly attenuate the flux originating much beyond the local Virgo supercluster (depending on the exact energy). If the sources were stronger in the past, behaving somewhat like the rate of massive star formation (as for gamma ray bursts), there would also be a (less severe) flux drop near eV, due to pair-production by CMBR on protons (or nuclei at a higher energy) as distant regions of the universe would dominate at energies below the threshold for energy losses — in effect an earlier part of the GZK fall.
At the highest energies, beyond the ankle, the cosmic ray fluxes reported by different experiments did not agree so well. Here, widely spaced detector arrays sampling the outer fringes of showers had to be used until the technique of measuring the fluorescent light emitted by very distant showers gradually became well developed. A few very extended arrays of shower detectors had failed to find evidence of the expected fall near eV (see the AGASA points in Figure 2), stirring up hypotheses concerning decay of long-lived super-massive particles supposedly clustering near the Galaxy, and generating secondaries of eV, or failure of normal relativistic energy relationships in collisions at extreme Lorentz factors. The Auger project was established to clarify the spectrum at these extreme energies — using both particle detectors on the ground and recording fluorescent light in the atmosphere to check the shower energies — and to record enough cosmic rays above eV (where energy loss rates should make the distances to detectable sources small) to see which exceptional objects they were coming from.

The spectrum reported by the partly-built Auger array (Sommers [2005]) is only preliminary, and results from a short initial exposure. It agrees quite well in shape with the last of the previous fluorescence detectors, HiRes (Thomson [2004]), and with the shape of the spectrum from the very early large array at Yakutsk (Egorova et al. [2004]). These three spectra are shown in figure 7, with the energy scales adjusted to bring the fluxes () into alignment below eV, so that they fit onto the several concordant experiments shown in figure 2. To achieve this, energies were multiplied by the factors 1.11 and 0.64 for Auger and Yakutsk respectively.
These measurements appear to be compatible with the expected GZK fall near eV, although this should become much better defined after another 2 years of exposure. Their shapes are also suggestive of the effect of the earlier CMBR-pair-production-induced fall near eV.
Supposing that diffusive shock acceleration again converts a huge available gas kinetic energy into an extended power-law spectrum of particles made up of the locally available ions, one can calculate the characteristic large changes imposed on the spectrum by interactions mainly with the CMBR while travelling to the Earth, and compare with the observed cosmic ray spectrum. There are several free parameters available to fit the data on spectral shape — spectral energy exponent, and maximum energy, , at the source, source composition, and variation of source power with cosmic time, even without supposing the sources are unevenly distributed in space (which is significant only above eV or below eV) — and of course there could be different types of source. In view of this, the consequences of just the simplest natural assumptions will be illustrated, without optimising the fits through wide-ranging variations.
If we adopt the most plausible assumption that these very powerful high-energy extragalactic sources depend on shock acceleration powered by AGN jets , we still do not know how far from the AGN the shocks form, and what is the source of the ions swept into the shock. If the matter has passed close to the AGN after having gained an initial energy boost, it might be pure hydrogen as a result of photodisintegration of other nuclei at source. If acceleration occurred near the termination of the jet, at the typical large radio lobes, the injected matter might be H and He, similar to primordial composition. Or its composition might be not unlike galactic matter. Starting with the same rigidity spectrum for each type of ion, the spectrum at Earth would be changed by photodisintegration and energy losses en route, due to the CMBR and light from stars, mostly infrared. Illustrated in figure 7 are the simplest fits based on different types of source composition just mentioned.
(a) ‘EGAL p’ is a pure proton source, , and a source strength evolving like the star formation rate (Porciani and Madau SFR2 [2001]). The higher curve (above eV) has set at eV, the lower at eV: it makes little difference below eV. (Note that below eV the flux gives the appearance of rising with increasing energy merely because it has been multiplied by for plotting.) This differs a little from the form advocated by Berezinsky, Gazizov and Grigorieva ([2002]), essentially in assuming the time-evolving source power. They assumed a constant source (which is certainly a possibility for such jets), which necessitated a more steeply falling spectrum ( to ). But with stronger sources in the past, there are more long trajectories to suffer energy loss when pair-production sets in above eV: without this evolution in production rate, a more steeply-falling source spectrum is needed to give the same slope seen in the data in this region. (With their steeper spectrum, Berezinsky et al. introduce a bend in the source spectrum to suppress low-energy particles in order to avoid too high an energy integral.) However, is quite close to the deduced spectrum required from SNR.

(b) ‘EGAL H+He’ is a “primordial” hydrogen-helium mixture, with source spectrum , close to the expected form for acceleration at an ultrarelativistic shock (Achterberg et al. [2001]), and sources evolving as before. If is set at eV it lowers the proton component flux by essentially the same amount as in case (a). The proton part of the flux is shown by the line ‘p in HHe’. Here, the helium component becomes unusually important at a few EeV, because pair production starts at the same Lorentz as for protons, which is at an energy 4 times higher.
(c) Normal elemental composition at source. Allard et al ([2005]) have discussed such a composition (as well as the pure proton case), which results in many other nuclei surviving to Earth at around eV, in addition to the helium seen in case (b), so the characteristic “valley” seen at the ankle is lost: see the dotted line ‘EGALmixed’. The ankle would in this case indeed mark the point where an extended Galactic spectrum falls well below a much harder extragalactic flux. Their source spectrum has the form , and no evolution of source strength.
Of these three extragalactic variants, the proton composition (a), advocated for some time by Berezinsky and associates, is probably the most physically plausible. Subtracting this flux from the observed total cosmic ray flux requires that all other contributions to cosmic rays at Earth match the curve marked “Total – egalP” in figure 7, which is in excellent agreement with the hatched band indicating the probable total Galactic cosmic ray flux, assuming that the most massive nuclei (Si-Fe) in the KASCADE flux unfolding (figure 2) do have a rigidity spectrum terminating like that of light elements, so their flux falls away above eV as shown.
It may appear to be a remarkable accident that this steeply falling Galactic flux (presumed from SNRs) and the unrelated rapidly emerging extragalactic flux, add together to give a relatively smooth seamless total spectrum between the knee and the ankle. The position of the extragalactic flux emergence is governed by the threshold of the pair-production reactions between protons and CMBR photons, of course, and has not been adjusted to make a smooth fit here. Figure 8 shows that one could alter the level of the extragalactic component considerably without providing a visible clue to the join point in the overall spectrum. The smoothness of the total spectrum can hide large bumps in individual components: indeed when the extragalactic part is increased tenfold (top curve), the usual knee due to the rigidity limit of Galactic accelerators has become imperceptible! So the appearance of a smooth total spectrum can easily completely hide major disappearances and appearances of individual components. A smooth continuation from Galactic to extragalactic cosmic rays is, surprisingly, quite natural.
In the case of Hillas’s ([2005]) H+He version of the extragalactic flux, there has to be a higher Galactic contribution at 0.1 to 0.4 EeV, which he tentatively attibuted to a high-speed part of the type II SNs, following Bell and Lucek ([2001]). These would have provided a low-level extension to the rigidity spectrum beyond the normal of SNR cosmic rays. However, the present KASCADE analysis has not so far suggested any such tail after the initial sharp drop at the knee.
An important point is that in both cases (a) and (b), the extragalactic component becomes a major part of the flux not far above eV, at which energy heavy nuclei still leak only slowly from the Galaxy, so very little anisotropy is to be expected at any energy above the knee, thus providing a surprising explanation of the lack of progress in the long search with larger and larger exposures for directional clues to the origin of cosmic rays. Composition (c) on the other hand produces a later transition to extragalactic particles, and a correspondingly greater Galactic component to be found to fill the gap between the hatched region (end of the SNR component) and the ankle.
The elemental composition just below eV will provide a test between the alternatives. Evidence from measurements from the Stereo Fly’s Eye and Yakutsk gave no indication of the emergence of a light component in this region (e.g. see Allard et al. [2005]), but HiRes on the contrary indicated a rapid change near here (Abu-Zayyad et al.[2000], Abbasi et al. [2005]). If this version is confirmed, it supports the pure proton model (a), and, presumably, injection in a region of very intense photon flux. Lateral distribution of shower particles has potentially equally good resolution in searching for a double-peaked composition (Fe + H). At present the Haverah Park data (Ave et al. [2003]) have suggested a modest proton component, as in model (b), but a re-analysis of other closely-spaced detector array results might be useful.
The most important clue to the sources at very high energy should come from the long exposure of the Auger project, when several particles above eV have been recorded: such particles cannot have travelled more than about 50 Mpc, so magnetic deflections should not be large, and there should be few candidate sources within range in the directional error boxes.
5 Some proposed cosmic-ray sources not reviewed above: connection with gamma ray bursts (GRB); cannonballs?
This section has been added, in “version 2” of this paper, in response to questioners (but does not appear in the conference proceedings). The present review has focused on the attempt to understand most cosmic rays without “new physics”, being strongly guided by theoretical expectations. I have concentrated on what seems much the most probable scenario, in order to seek a quantitative understanding of the principal features of cosmic rays, omitting consideration of other sources which may make some contribution in particular energy domains. Other sources not discussed above, which may contribute at the few percent level, include high-energy stellar winds, pulsars, magnetars, microquasars, shocks outside galactic discs and gamma-ray-burst phenomena. (Of course, the specific sites within AGN environments for the extragalactic sources have not been examined either.) Thus pulsars/plerions appear to be sources of relativistic electrons, but probably at the few-percent level, as argued in section 1. Only the particular case of the GRB-related phenomena will be taken up here, to explain why they were not considered above as major contributors to observed cosmic rays.
GRBs excited considerable interest in relation to particle acceleration as they gave evidence of explosive events ejecting matter in narrow cones with Lorentz factors , and probably involving kinetic energy somewhat larger than that released in ordinary supernova explosions — up to 30 f.o.e. ( erg). The difficulty of finding a site where protons could be accelerated to eV (Hillas [1984]) could be greatly alleviated if the accelerator were sited within, or comprised, a jet (or “plasmoid”) moving with a large Lorentz factor, , as the maximum energy of particles released into the environment from an accelerator of given could be increased by a factor . (An additional helpful factor can appear when considering the limit set by a small value of ahead of the shock if the inflow to the shock is ultrarelativistic.) AGN jets are favoured sites for acceleration of the most energetic cosmic rays for this reason of course (together with the large available kinetic energy), but GRBs might have even higher . The “long GRBs” are the relevant ones, thought to be most probably a variety of supernova explosion that generates ultrarelativistic ejecta, probably arising from the collapse of a star of initial mass to a black hole (the more massive type Ic SN).
The reason why GRBs had not been considered here as a promising main source is that their summed power does not seem to compete with the sources discussed earlier. Woosley and Heger ([2006]) use the statistics of GRB detection to estimate that they represent less than 1% of core-collapse SN, and interpret them as resulting from an unusual form of collapse of massive stars of high spin rate. More quantitatively, one can ask whether GRBs could supply the energy in the extragalactic cosmic rays described in the previous section. Taking the preferred proton component (“EGAL p” in figure 7), the local energy density in this flux above 300 GeV is . (If we make use of gases moving with Lorentz factors 300-1000 and then slowing, the output might effectively start at GeV.) Today’s local flux is equivalent to the output of sources of present-day strength added over yr, after integrating over the evolving source strength (Porciani and Madau SFR2) and allowing for red shift. Hence the present-day sources have to supply . The local rate of GRBs, after correcting for beaming, is estimated by Guetta et al. ([2003]) as ; and taking their average kinetic energy f.o.e. and a 1/6 acceleration efficiency, their relativistic particle production would be — too low by a factor . The alternative choice of the “EGAL H+He” flux in figure 7 reduces the energy deficit above 300 GeV to a factor . This is very different from the conclusion of Vietri, De Marco and Guetta ([2003]) that the power required to supply the most energetic cosmic rays is less than the GRB output. The main reason for the difference is that Vietri et al. consider only the energy needed to supply cosmic rays from eV upwards, arguing that particles below eV cannot escape from the front of the ultrarelativistic GRB. However, the Fermi acceleration generates a full spectrum from injected energy upwards, behind the shock, and the bulk of the energy provided resides in the particles below eV (observed energy). This is the major part of the energy budget. (Although it is now suspected that weak bursts (X-ray flashes) may be more frequent than standard GRBs by an order of magnitude (e.g. Soderberg et al., [2006]), these put little energy into only mildly relativistic shocks.) All this deserves a fuller treatment, of course.
In particular, a supernova-related model is unattractive for explaining extragalactic cosmic rays, as our galaxy would dominate the local flux, on geometrical grounds (Hillas [2004]) if the accelerators were found in all galaxies. Of course, the local flux arising from infrequent outbursts could suffer large fluctuations about the average, accentuated if the output were strongly beamed, but Galactic magnetic fields should provide some smoothing for moderately heavy nuclei before the ankle, if the outbursts were not much below 1% of the regular supernova rate. This is why one looks for exceptionally powerful sources not found in normal galaxies at the highest energies.
Quite unlike Woosley and Heger, Dar and De Rújula have presented the hypothesis that essentially all core-collapse SN, rather than , produce the ultrarelativistic ejections that generate GRB phenomena, but which would only be seen directly in an exceedingly narrow observing cone. As an unusual basis for explaining GRB and afterglow phenomena, these authors propose that most core collapse supernovae eject several “cannonballs” of plasma over a few days, having Lorentz factors clustered near 1000, carrying in total an energy f.o.e.. The authors have gone on to estimate (most fully in Dar and de Rújula [2006]) that these objects would also naturally account for the generation of virtually all cosmic rays as a consequence of their motion through the interstellar gas. However, I can give no credence to this model. Firstly, the vital properties of the cannonball (CB) are its Lorentz factor, , which determines the energy of the particles it emits, and its transverse radius, , which determines the rate at which particles are swept up and the CB slows down. A quite false effect is employed (Dado, Dar and De Rújula [2001]) in calculating that the expansion of is quickly slowed down from (when emitted from an accreting neutron star) and that almost stabilises at m, expanding thereafter at (in the standard stellar frame). The swept-up particles, which have a very high individual energy in the CB reference frame, and which are supposed to diffuse out of the CB, are said to exert an inward pressure, opposing lateral expansion, supposedly because of momentum reaction when they leave, whereas the opposite is true: near the edges, where the net particle flow is outwards, a net outward force (pressure gradient) would be exerted by the diffusing particles on the CB material. Secondly, the authors suppose that particles can simply leave the CB’s surface, without Fermi “bouncing”, whereas Achterberg et al. ([2001]) show that particles entering a plasma advancing with ultrarelativistic speed, and scattered back out of it, cannot escape: even a small external magnetic field retards them sufficiently that they are recaptured, and a Fermi acceleration process is set up that dominates the spectrum. (If were as small as the normal Galactic field they would still be recaptured within the CB radius until their rigidity exceeded V.) The CB authors do wish to use Fermi acceleration to get particles to V, however, but seem to misinterpret the reports of Frederiksen et al. [2004], [2003], as showing that relevant acceleration of ions will occur entirely behind the shock, so they considered motion entirely there (with a field strength ). Frederiksen et al., did note, though, that the magnetic field in the external medium was required for significant energy gain by ions.
6 Conclusions
Cosmic ray physics is perhaps becoming less exciting for seekers of the exotic. There is as yet no necessity for new physics at the highest energies; and we may be approaching the situation where the mysteriously bland spectrum between the knee and the ankle is resolved into the sum of perhaps only two major kinds of source. If this interpretation is correct (notably the proton source model of Berezinsky et al.), the transition from Galactic to extragalactic cosmic rays has occurred at a much lower energy than was usually believed, and has left virtually no obvious sign in the flux level at the join point. Nevertheless, a rapid change in shower characteristics should occur here, and measurements of double-peaked distributions may be possible. The detection of a class of air showers of very uniform structure near eV, attributale to the most energetic Galactic cosmic rays, and rapidly diminishing in proportion as energy rises, would help to establish clearly whether proton-only acceleration occurs at the highest energies.
Such an interpretation, and the demonstration of sharp sub-knees in the Galactic spectrum by the KASCADE experiment, have presented a lesson that the simplicity of a smooth spectrum, close to a power law, can be very deceptive. Cosmic-ray physicists should resist the temptation to read much into the position of a “join point” between two straight lines drawn through flux data points. The absence of obvious concavity in cosmic-ray proton spectra before the knee, despite its prediction in diffusive shock acceleration, may be another instance of many sub-spectra adding to give the appearance of a close approximation to a power law in the total.
A much better understanding of the knee as a consequence of SNR development brings together theoretical and observational work very fruitfully.
The central part played in astronomy by detailed images (as well as spectra) is exemplified by wonderful CHANDRA X-ray images of SNRs, and TeV detectors are at the threshold of this capability..
Acknowledgements.
I am particularly grateful for the stimulation of discussions with Tony Bell, Venya Berezinsky, Tom Gaisser, Todor Stanev and Gaurang Yodh while preparing this material, and for much assistance by Jamie Holder and other colleagues — also for comments and questions from several fellow cosmic-ray enthusiasts which resulted in the addition of much material in section 5.References
- [2005] Abbasi R U et al. 2005, Astrophys. J. 622, 910
- [2000] Abu-Zayyad T et al. 2000, Phys. Rev. Lett. 84, 4276 All this deserves a fuller treatment, of course.
- [2001] Achterberg A, Gallant Y A, Kirk J G & Guthmann A W 2001, Mon. Not. R. Astron. Soc. 328, 393
- [2004] Aharonian F A et al. 2004, Nature 432, 75
- [2005] Aharonian F A et al. 2005 Astron. Astrophys. in press; arXiv:astro-ph/0511678
- [2005] Allard D, Parizot E & Olinto A V 2005, preprint arXiv:astro-ph/0512345
- [2005] Antoni T et al. 2005, Astropart. Phys. 24, 1
- [2003] Ave M et al. 2003, Astropart. Phys. 19, 61
- [2005] Ballet J 2005, preprint arXiv:astro-ph/0503309
- [2001] Bell A R & Lucek S G, 2001, Mon. Not. R. Astron. Soc. 321, 433
- [1997] Berezhko E G and Völk H J 1997, Astropart. Phys. 7, 183.
- [2002] Berezinsky V, Gazizov A & Grigorieva S 2002, arXiv:hep-ph/020435
- [1984] Bloemen J B G M et al., 1984, Astron. Astrophys. 135, 12
- [2005] CHANDRA web site //chandra.nasa.gov
- [2001] Dado S, Dar A & De Rújula A 2002, preprint arXiv:astro-ph/0107367 v4
- [2006] Dar Arnon & De Rújula A 2006, preprint arXiv:hep-ph/0606199
- [2004] Egorova V P et al. 2004, Nucl. Phys. B (Proc. Suppl.) 136, 3
- [1997] Ellison D C, Drury L O’C & Meyer J-P, 1997, Astrophys. J. 487, 197
- [2004] Ellison D C, Decourchelle A & Ballet J 2004, Astron. Astrophys. 413, 189
- [2004] Frederiksen J T et al. 2004, Astrophys J 608, L13
- [2003] Frederiksen J T et al. 2003, preprint arXiv:astro-ph/0303360
- [2005] Gaisser T K, 2005, private communication
- [2003] Guetta D, Piran T & Waxman E 2003, arXiv:astro-ph/0311488
- [2003] Haungs A 2003, J. Phys. G: Nucl. Part. Phys. 29, 809
- [1984] Hillas A M 1984, Ann. Rev. Astron. Astrophys. 22, 425
- [2004] Hillas A M 2004, Nucl. Phys. B (Proc. Suppl.) 136, 139
- [2005] Hillas A M 2005, J. Phys. G: Nucl. Part. Phys. 31, R95
- [1997] Hunter S D et al 1997, Astrophys. J. 481, 205
- [1983] Lagage P O & Cesarsky C J, 1983, Astron. Astrophys. 125, 249
- [2000] Lucek S G and Bell A R, 2000, Mon. Not. R. Astron. Soc. 314, 65
- [2006] Marcowith A, Lemoine A & Pelletier G, 2006, Astron. Astrophys. 453, 193
- [1997] Meyer J-P, Drury L O’C & Ellison D C 1997, Astrophys. J. 487, 182
- [2004] Plaga R 2001, preprint arXiv:astro-ph/0111555 v1
- [2001] Porciani C & Madau P 2001, Astrophys. J. 548, 522
- [2006] Ptuskin V S & Zirakashvili V N, 2006, Astron. Astrophys. submitted: preprint arXiv:astro-ph/0408025
- [2006] Soderberg A M et al. 2006, Nature 442, 1014.
- [2005] Sommers P et al. 2005, Proc. 29th Int. Conf. on Cosmic Rays, Pune
- [1996] Strong A W & Mattox J R, 1996, Astron. Astrophys. 308, L21
- [2004] Thomson G 2004, Nucl. Phys. B (Proc. Suppl.) 136, 28
- [2002] Völk H J et al. 2002, Astron. Astrophys. 396, 649
- [2003] Vietri M, De Marco D & Guetta D 2003, Astrophys. J. 592, 378.
- [2005] Völk H J, Berezhko E G and Ksenofontov L T 2005, Astron. Astrophys. 433, 229
- [2006] Völk H J 2006, preprint arXiv:astro-ph/0603502
- [2005] Warren J S et al. 2005, preprint arXiv:astro-ph/0507478
- [2006] Woosley S E & Heger A 2006, preprint arXiv:astro-ph/0604131