The highly obscured region around PKS 1343 – 601 – I. Galactic interstellar extinctions using DENIS galaxy colours
The highly obscured radio-bright galaxy PKS 1343 – 601 at Galactic coordinates of ) has been suspected to mark the centre of a hitherto unknown cluster in the wider Great Attractor region. As such it presents an ideal region for a search of galaxies in the near-infrared (NIR) and an in-depth study of their colours as a function of extinction. A visual search of a square-degree area centered on this radio galaxy on images of the NIR DENIS survey () revealed 83 galaxies (including two AGNs) and 39 possible candidates. Of these, 49 are also listed in the 2MASS Extended Source Catalog 2MASX. Taking the IRAS/DIRBE extinction values (Schlegel et al. 1998) at face value, the absorption in the optical () ranges from to over across the Galactic Plane. Comparing the detections with other systematic surveys, we conclude that this search is highly complete up to the detection limits of the DENIS survey and certainly surpasses any automatic galaxy finding algorithm applied to crowded areas.
The NIR galaxy colours from the aperture were used as a probe to measure total Galactic extinction. A comparison with the IRAS/DIRBE Galactic reddening maps suggests that the IRAS/DIRBE values result in a slight overestimate of the true extinction at such low Galactic latitudes; the inferred extinction from the galaxy colours corresponds to about 87% of the IRAS/DIRBE extinctions. Although this determination still shows quite some scatter, it proves the usefulness of NIR surveys for calibrating the IRAS/DIRBE maps in the extinction range of about .
Key Words.:
Galaxies: clusters: individual – Galaxies: fundamental parameters – Galaxies: photometry – extinction1 Introduction
Various extragalactic large-scale structures are hidden behind the dust and stars of the Milky Way, the so-called Zone of Avoidance (ZoA), resulting in a poor understanding of the dynamics of the nearby Universe; for a detailed overview see Kraan-Korteweg & Lahav (2000), Kraan-Korteweg (2005), and the conference proceedings “Nearby Large-Scale Structures and the Zone of Avoidance” (Fairall & Woudt 2005). The Great Attractor (GA), an extended mass overdensity in the nearby Universe, lies for instance close to the crossing of the Supergalactic plane and the Galactic plane. Its presence was inferred by the systematic large-scale flow of elliptical galaxies (Lynden-Bell et al. 1988). Applying the potential reconstruction method of the mass density field POTENT (Dekel 1994), Kolatt et al. (1995) found its centre at km s-1).
Close to the potential well of the GA lies the cluster ACO 3627 km s-1). A deep optical galaxy search (Woudt & Kraan-Korteweg 2001) revealed this cluster to be as massive and rich a cluster as the Coma cluster (Kraan-Korteweg et al. 1996, Woudt et al. 2005). It therefore most likely marks the centre of the potential well of the GA. However, the GA is an extended region of high galaxy density (about on the sky, see Kolatt et al. 1995), and other clusters (rich and poor) may well contribute substantially to this mass overdensity. Identifying them is a challenge as the central part of the wider GA area lies behind the thickest dust layer of the Milky Way.
About from the Norma cluster, at ), lies the galaxy PKS 1343 – 601 with a recession velocity of 3872 km s-1 (West & Tarenghi 1989). Near-infrared (NIR) observations revealed PKS 1343 – 601 to be a giant elliptical galaxy, which often reside at the centre of galaxy clusters. It is also one of the brightest radio sources in the sky (McAdam 1991): its flux density is only surpassed by Cygnus A, Centaurus A, Virgo A, and Fornax A. Two of these four radio sources are situated at the centre of a rich cluster, one in a smaller cluster, and one in a group of galaxies (Jones et al. 2001). This evidence motivated Kraan-Korteweg & Woudt (1999) to investigate by different means whether PKS 1343 – 601 points to another cluster in the Great Attractor region. Such a cluster would have a considerable impact on the local velocity field calculations.
Results are still controversial. A preliminary analysis of the systematic deep H I search for galaxies with the Parkes Multibeam receiver found a concentration of galaxies in redshift space around this radio galaxy (Kraan-Korteweg et al. 2005b). A deep NIR search () of half a degree radius and a deep -band survey of 2 degrees around PKS 1343 – 601 (Nagayama et al. 2004; Kraan-Korteweg et al. 2005a, respectively) have revealed a distribution of galaxies consistent with a (medium-sized) cluster around PKS 1343 – 601. X-ray observations with ASCA have only revealed diffuse emission from PKS 1343 – 601 itself (Tashiro et al. 1998, see also the discussion in Ebeling et al. 2002), which would rule out a rich cluster.
This paper presents the results of a search for galaxies based on the NIR DENIS survey (Epchtein et al. 1997) in a much larger but shallower area than the above ones. The advantages of using the NIR to search for galaxies in the ZoA are manifold: (i) the NIR is less affected by the foreground extinction than the optical (the extinction in the -band is about 10% of the extinction in the -band); (ii) the NIR is sensitive to early-type galaxies, tracers of massive groups and clusters (contrarily to far-infrared and blind H I surveys); (iii) the NIR shows little confusion with Galactic objects such as young stellar objects and cool cirrus sources.
In pilot studies, we have assessed the performance of the DENIS survey at low Galactic latitudes (Schröder et al. 1997; Kraan-Korteweg et al. 1998; Schröder et al. 1999; Mamon et al. 2001). We tested the potential of the DENIS survey to detect galaxies where optical and far-infrared surveys fail, i.e., at high foreground extinctions and in crowded regions; we established that the NIR colours of galaxies lead to values for the foreground extinction; and we cross-identified highly obscured galaxies detected in a blind H I search at . Overall, both systematic NIR surveys DENIS (; Paturel et al. 2003, Vauglin et al. 1999) and 2MASS (; Skrutskie et al. 2006, Jarrett et al. 2000a) have proven their effectiveness in penetrating the ZOA (Jarrett et al. 2000b, Rousseau et al. 2000, Schröder et al. 2000) – as long as the star density does not exceed a certain value (Kraan-Korteweg & Jarrett 2005).
In the following, we will introduce the DENIS survey and the implication of extinction on galaxy counts in general (Sections 2 and 3, respectively). We will then describe the search area and the quality of the DENIS data (Sect. 4), and the methods of galaxy and parameter extraction (Sect. 5). In Sect. 6 the catalogue data are described, Sect. 7 gives a detailed comparison with the data of other searches and catalogues in this area, and in Sect. 8 we investigate the extinction in this area using the derived NIR colours. Conclusions are presented in the final Sect. 9. Throughout the paper, we assume a Hubble constant of .
A second paper will provide a detailed discussion of the local environment of PKS 1343 – 601 using the local galaxy density, the velocity distribution, and the X-ray luminosity to assess its mass and contribution to the GA overdensity (Schröder & Mamon 2006, hereafter Paper II).
2 The DENIS survey
The DENIS survey (DEep Near-Infrared Survey of the southern sky) is a European joint program that simultaneously imaged the sky in the Gunn- (m, hereafter ), (m) and (m, hereafter ) passbands with a resolution of in and in and (Epchtein 1997, 1998). The observations were carried out between 1995 and 2001 with the dedicated 1 m ESO telescope at La Silla (Chile). About 92% of the southern sky () has been covered.
DENIS images have a field of view of . Exposure times per field and band are s. The observing mode consisted of step-and-stare scans of 180 images in declination, resulting in strips of . The overlap region between images are on each side. Any given slot in the sky was usually observed once and, depending on the quality of the images and/or weather conditions of the previous observations, repeated.
The reduction process of the DENIS images consisted in bias corrections and flat-fielding. The latter was done using an iterative fitting of the pixel response over the night relative to the mean over the image centre (Borsenberger 1997). The images were then smoothed with kernels the size of which is a function of the wavelength of the spectral waveband. Objects were extracted and measured with SExtractor (Bertin & Arnouts 1996). For the purpose of the analysis of the ZoA the star/galaxy separation was, however, performed visually.
To ensure homogeneous quality over the whole survey, the DENIS processing centre in Paris (PDAC) recently re-processed all strips with the latest software of the pipeline. The limiting magnitudes for point sources (at a sensitivity of about ) are , , for the -, -, and -bands, respectively, while the completeness limits for galaxy extraction at high Galactic latitudes are roughly , , and 111The DENIS -band limiting magnitude is bright because the background of the DENIS camera is high and dominated by thermal emission of the instrument. (Mamon 1998, 2000).
3 Extinction effects on galaxy counts
In the ZoA, number counts of galaxies decrease due to the increasing foreground extinction. This effect depends, however, on wavelength. Using the formula given in Cardelli et al. (1989), the extinction in the DENIS NIR passbands are
| (1) |
directly implying that the decrease in number counts as a function of extinction will be considerably slower in the NIR than in the optical. Figure 1 shows the predicted surface number density of galaxies as a function of Galactic foreground extinction, using the DENIS galaxy counts for their respective completeness limits as given in Mamon (1998), and for comparison the galaxy counts of Gardner et al. (1996) in unobscured regions at the detection limit of of the deep -band search in this area (Woudt & Kraan-Korteweg 2001).

Figure 1 indicates that – given the above number counts and completeness limits – the NIR becomes more efficient at than the optical in revealing galaxies in the ZoA. The -band seems the most efficient passband at intermediate extinctions (), whereas becomes superior to at . As Kraan-Korteweg (2000) and Woudt & Kraan-Korteweg (2001) have shown, their diameter-limited () optical ZOA surveys start to become incomplete at . Here, the - and -bands will allow a much deeper penetration of the ZoA as long as the star density does not swamp the fields.
These are very rough predictions and do not take into account any dependence on morphological type, surface brightness (NIR surveys are for instance not very sensitive to late and/or low surface brightness spirals), orientation and crowding, which may lower the number of actually detectable galaxies (e.g., Mamon 1994, Kraan-Korteweg & Jarrett 2005). One of the reasons we pursued this NIR in-depth study of galaxies behind the Milky Way was to investigate this further.
4 Characteristics of the DENIS data in the cluster area
The centre of our search area was put at the position of the giant elliptical PKS 1343 – 601 (RA , Dec , J2000). To assess the likelihood whether the to be identified galaxies form a cluster around PKS 1343 – 601, we have adopted a search radius that encompasses the equivalent of at least one Abell radius at the redshift distance of PKS 1343 – 601. The latter, defined as (Abell 1958), is for the radial velocity of km s-1 (West & Tarenghi 1989) of the radio galaxy.
We have searched 29 DENIS slots of 37 images each. The total areal coverage amounts to square degrees (cf. Fig. 3). Some of these slots have been observed more than once. In this case the best quality observation was selected for the visual examination, but coordinates and photometry was determined from all images that were of useful quality. Table 1 gives an overview of the observed slots and their characteristics.
| Slot | Strip | Date Obs. | R.A. (J2000) | Image Nrs | Bands | PSF () | Seeing | Weather | Astrom. | Prior. | ||
|---|---|---|---|---|---|---|---|---|---|---|---|---|
| (1) | (2) | (3) | (4) | (5) | (6) | (7) | (8) | (9) | (10) | (11) | ||
| 4638 | 7641 | 02/04/99 | 13 28 00.1 | IJK | 3.48 | 3.47 | 3.47 | 2 | 1 | 1 | 1 | |
| 4639 | 7659 | 05/04/99 | 13 29 20.3 | IJK | 2.73 | 3.10 | 3.32 | 1 | 1 | 1 | 1 | |
| 4640 | 7652 | 04/04/99 | 13 30 40.1 | IJK | 3.08 | 3.39 | 3.57 | 2 | 1 | 1 | 1 | |
| 4640 | 9426 | 27/04/00 | 13 30 40.0 | IJK | 2.62 | 3.14 | 3.15 | 1 | 4 | 1 | 2 | |
| 4641 | 3625 | 03/03/96 | 13 31 60.0 | IJK | 2.89 | 3.07 | 3.33 | 1 | 1 | 1 | 1 | |
| 4642 | 2018 | 10/03/95 | 13 33 04.9 | -JK | – | – | – | – | – | – | 3 | |
| 4642 | 3823 | 02/04/96 | 13 33 20.0 | IJK | 2.91 | 3.85 | 3.43 | 2 | 1 | 1 | 2 | |
| 4642 | 7747 | 18/04/99 | 13 33 20.1 | IJK | 2.92 | 3.14 | 3.19 | 1 | 1 | 1 | 1 | |
| 4643 | 3981 | 02/05/96 | 13 34 40.0 | IJK | 2.87 | 3.60 | 3.15 | 1 | 4 | 2 | 4 | |
| 4643 | 9461 | 03/05/00 | 13 34 40.0 | IJK | 3.68 | 3.93 | 3.96 | 3 | 1 | 1 | 2 | |
| 4643 | 9523 | 18/05/00 | 13 34 40.0 | IJK | 3.90 | 3.97 | 3.86 | 3 | 1 | 1 | 3 | |
| 4643 | 10626 | 10/04/01 | 13 34 40.4 | IJK | 2.88 | 3.20 | 3.26 | 1 | 1 | 1 | 1 | |
| 4644 | 3586 | 25/02/96 | 13 35 60.0 | IJ – | 2.89 | 3.02 | – | (1) | 2 | 2 | 2 | |
| 4644 | 6299 | 04/06/98 | 13 35 60.0 | I– K | 3.37 | – | 3.49 | (2) | 2 | 2 | 3 | |
| 4644 | 6371 | 01/07/98 | 13 35 59.3 | IJK | 2.47 | 3.03 | 3.52 | 1 | 1 | 1 | 1 | |
| 4645 | 7450 | 25/02/99 | 13 37 20.2 | IJK | 3.50 | 3.59 | 3.36 | 3 | 1 | 1 | 2 | |
| 4645 | 7462 | 27/02/99 | 13 37 19.9 | IJK | 2.52 | 3.22 | 3.21 | 1 | 1 | 1 | 1 | |
| 4646 | 3678 | 12/03/96 | 13 38 40.0 | IJK | 2.89 | 3.19 | 3.65 | 1 | 1 | 1 | 1 | |
| 4647 | 7514 | 08/03/99 | 13 40 00.0 | IJK | 3.07 | 3.31 | 3.29 | 1 | 1 | 1 | 1 | |
| 4648 | 4145 | 03/06/96 | 13 41 20.0 | IJK | 2.73 | 3.11 | 3.24 | 1 | 1 | 1 | 1 | |
| 4649 | 1970 | 27/02/95 | 13 42 23.1 | –JK | – | 3.09 | 3.55 | – | – | – | 3 | |
| 4649 | 3737 | 21/03/96 | 13 42 39.2 | IJK | 2.90 | 3.94 | 3.27 | 1 | 1 | 1 | 1 | |
| 4649 | 9418 | 26/04/00 | 13 42 40.0 | IJK | 3.40 | 3.61 | 3.66 | 3 | 1 | 1 | 2 | |
| 4650 | 2056 | 23/03/95 | 13 43 44.9 | –JK | – | 3.20 | 3.56 | – | – | – | 2 | |
| 4650 | 6306 | 07/06/98 | 13 43 59.4 | IJK | 2.80 | 3.34 | 3.36 | 2 | 1 | 1 | 1 | |
| 4651 | 4182 | 12/06/96 | 13 45 20.0 | IJK | 2.85 | 3.18 | 3.61 | 1 | 1 | 1 | 1 | |
| 4652 | 7527 | 10/03/99 | 13 46 40.1 | IJK | 2.92 | 3.03 | 3.14 | (1) | 1 | 2 | 1 | |
| 4653 | 7532 | 11/03/99 | 13 48 00.0 | IJK | 2.81 | 3.05 | 3.20 | 1 | 1 | 1 | 1 | |
| 4654 | 7503 | 06/03/99 | 13 49 21.0 | IJK | 3.00 | 3.16 | 3.25 | 2 | 1 | 1 | 1 | |
| 4655 | 2019 | 10/03/95 | 13 50 24.2 | –JK | – | 2.91 | 3.10 | – | – | – | 2 | |
| 4655 | 7497 | 05/03/99 | 13 50 40.6 | IJK | 3.09 | 3.25 | 3.43 | 2 | 1 | 1 | 1 | |
| 4656 | 7491 | 04/03/99 | 13 52 00.7 | IJK | 3.35 | 3.46 | 3.53 | 2 | 1 | 1 | 1 | |
| 4657 | 7484 | 03/03/99 | 13 53 20.1 | IJK | 3.02 | 3.11 | 3.32 | 1 | 1 | 1 | 1 | |
| 4658 | 6052 | 05/03/98 | 13 54 41.1 | IJK | 2.56 | 3.06 | 3.44 | (1) | 4 | 2 | 1 | |
| 4659 | 5514 | 24/03/97 | 13 55 59.9 | IJK | 3.24 | 3.84 | 4.37 | 2 | 1 | 1 | 1 | |
| 4660 | 4136 | 01/06/96 | 13 57 20.0 | IJK | 2.62 | 3.30 | 3.32 | 1 | 1 | 1 | 1 | |
| 4661 | 3960 | 27/04/96 | 13 58 40.0 | IJK | 2.72 | 3.14 | 3.35 | 1 | 1 | 1 | 1 | |
| 4662 | 3969 | 28/04/96 | 14 00 00.0 | IJK | 2.66 | 3.38 | 3.31 | (1) | 2 | 2 | 1 | |
| 4663 | 5391 | 27/02/97 | 14 01 20.5 | IJK | 3.15 | 3.30 | 3.32 | 1 | 1 | 1 | 1 | |
| 4664 | 3676 | 11/03/96 | 14 02 40.0 | IJK | 3.71 | 3.75 | 4.01 | 2 | 1 | 1 | 1 | |
| 4665 | 3976 | 29/04/96 | 14 03 60.0 | IJK | 2.83 | 3.92 | 3.35 | 1 | 1 | 1 | 2 | |
| 4665 | 8071 | 24/06/99 | 14 04 00.2 | IJK | 3.42 | 3.72 | 3.75 | 3 | 1 | 1 | 1 | |
| 4666 | 3952 | 26/04/96 | 14 05 20.0 | IJK | 2.48 | 3.28 | 3.29 | 1 | 1 | 1 | 1 | |
Column 1: Slot number (according to their designation in the sky).
Column 2: Strip number (observations of a given slot with a unique number according to the observing date). Strip numbers smaller than 3000 were part of the pre-survey (these have no -band counterparts and the exposure time was slightly larger); they were used for verification only since they are not astrometrically and photometrically calibrated.
Column 3: Date of observation (DD/MM/YY).
Column 4: Central Right Ascension of the strip (J2000) (recall that each image has a width of about ).
Column 5: Image numbers for the searched area (only the last three digits are given for the final image).
Column 6: Observed passbands.
Column 7: Half-flux radius as calculated by SExtractor multiplied by 2 (an equivalent to the point-spread function, PSF). The half-flux radii were determined from all stars in the magnitude ranges , , and that do not lie within 50 pixels of the image border.
The entries in the table are the geometric means of the median half-flux radii over the given images. When compared with the Full Width Half Maximum (FWHM) in arcseconds of the PSF calculated by PDAC, the two values compare well, but the here presented values are slightly larger than the calculated FWHM (about in ). This is mainly due to the pixelization of the image.
Column 8: Seeing quality as estimated from the photometry of stars (cf. Appendix A). 1 stands for good seeing (photometry not affected), 2 for medium seeing (7″-aperture photometry is affected), and 3 for bad seeing (all magnitudes affected). The numbers in brackets are an estimate of the seeing where the astrometry was insufficient for a statistical comparison of the photometry in the overlap regions.
Column 9: Weather conditions. 1 indicates no clouds, 2 unknown conditions, 3 possible clouds, and 4 clouds.
Column 10: Astrometric quality of the strips. The DENIS standard high accuracy of an rms of is indicated with a 1, lower accuracy with 2. For strips where astrometric calibration failed we determined the coordinates from the DSS222The STScI Digitized Sky Survey-red images (accuracy of about ).
Column 11: Order of quality of strips with more than one observation (1 indicates the best strip, higher numbers designate lower priorities).
All priority 1 strips, except strip 6052, had photometric weather conditions. Lower quality images will have a systematic effect on the search results. It is unlikely to result in a loss of large galaxies, but in an increase of uncertain galaxies due to the blurring of faint stars into patches similar in appearance to small and faint galaxies. The photometry of galaxies obtained under adverse seeing conditions will obviously also have larger uncertainties.
5 Galaxy Extraction and Parameters
Extended objects (‘nebulae’) in general are either galaxies or objects of Galactic origin (typically emission or reflection nebulae). In crowded areas we also find many stars that are blended into elongated objects, or groups of (unresolved) faint stars that form a diffuse nebula-like patch. This is usually the main reason why automatic searches for galaxies, like SExtractor, fail at low latitudes. The sharp gradient in surface brightness with radius can be used to distinguish blended stars from galaxies. But if the stars are very faint and in addition the seeing condition is not very good, this criterion becomes less distinct even to the eye.
We have visually examined all the images. This was done with the DENIS visualisation package Denis3d by E. Copet. It is optimally suited for such a search for extended objects: apart from the full image in a given band, it simultaneously displays the , , and zoomed-in images under the cursor. Using the zoom-windows each whole image was systematically scanned. The simultaneous inspection of an object in the 3 passbands facilitates the galaxy/star discrimination considerably as the relative appearance of highly-obscured galaxies in the three bands varies compared to stars (cf. Fig. 1). To ensure homogeneity of the search the same cut-values were applied to all images (min ADU and max ADU, conforming to values of typically to 10.8 in , to 16.0 in , and to 10.2 in ).
We compared our results closely to the deep -band catalogue by Woudt & Kraan-Korteweg (2001, hereafter WKK; ), i.e., our initial list of candidates was cross-correlated with the -band detections. We found that we had missed a few low surface brightness galaxies. These generally are very faint in the NIR, but we did recover them in hindsight. They were subsequently added to our list and classified as BG. Only one -band galaxy was not visible in the NIR.
We also identified various extended Galactic objects; they are discussed in more detail in Sect. 6.2. When classification as a galaxy was not clear-cut, we labelled the object as an uncertain galaxy.
The automatic extraction package SExtractor (Bertin & Arnouts 1996) was used to derive Kron-photometry for the visually detected galaxies. SExtractor computes total magnitudes (‘best’) as well as photometry in apertures of 3″, 5″, 7″, 10″, 20″, and 40″.
Colours were determined from the 7″-aperture magnitudes. This aperture was chosen to minimise contamination by superimposed stars on the one hand and the variation in seeing conditions on the other. Since the radial colour gradient is small in the NIR (e.g., Moriondo et al. 2001, Rembold et al. 2002), the effect of having different fractions of a galaxy within our fixed aperture will be small and will introduce less uncertainty in the colour than the increased star subtraction required for larger apertures.
By going back to the image, a careful analysis was made to test whether SExtractor has deblended all objects in the vicinity of the galaxy and whether all the parameters agree with each other. As a result we give quality parameters for the photometry in each band, depending on whether the 7″-aperture and/or the total magnitude are estimated to be uncertain or unreliable.
Although SExtractor computes semi-major and semi-minor axes of an object, we have decided – for uniformity reasons – to derive the diameters by other means since not all our galaxies were extracted by SExtractor and some were contaminated by not-deblended stars. We employed the contour facility in ds9 (Joye & Mandel 2003) to measure the semi-major axis out to isophotes of , , and in the -, -, and -bands, respectively. The isophotes were selected to be quarter integers close to values where the DENIS images in the search area have similar noise characteristics.

To compare our diameters with the parameters calculated by SExtractor we used the isophotal area parameter ISOAREA:
which is typically 2A (with an rms of ). Figure 2 shows the residuals () for each band. They agree well for and , while the -band shows a small but significant deviation:
Two objects in the -band fit show more than deviations from the fit (open circles). In both cases the object is partly blended with near-by stars which affects the automatic diameter extraction by SExtractor. If we exclude these outliers the fit will improve slightly to:
These comparisons indicate that the isophotes of the semi-major axes derived with ds9 agree well with the SExtractor limits in the - and -bands, whereas in the -band SExtractor goes slightly fainter than .
We have extracted magnitudes and diameters from all images where the respective object is visible (at a reasonable distance from the edge) and averaged those where the quality was acceptable.
We estimated the morphological types by visually inspecting all DENIS images as well as the DSS-red images. Fairly accurate classifications are possible at low extinctions (a comparison with the morphological types determined by WKK show good agreement). With increasing extinctions the outer spheroid becomes more and more truncated and a distinction between types more uncertain. At the highest extinction levels only the bulges of galaxies remain visible, making it impossible to distinguish between ellipticals and bulges of a spiral galaxies.
As a guide to the interpretation of the (absorbed) object parameters, the Galactic foreground extinctions have been determined from the IRAS/DIRBE maps by Schlegel et al. (1998). The colour excess has been converted to using , where , (Cardelli et al. 1989), and .
Note that the IRAS/DIRBE extinction maps are not properly calibrated at latitudes and therefore only provide an estimate. In Sect. 8, a first attempt was made at calibrating the IRAS/DIRBE maps based on the reddened colours of the galaxies detected in this survey. Moreover, Schlegel et al. (1998) note in their paper that far-infrared point sources have been removed where source lists exists to correct for overestimates. This was not done for our search region and we have taken care to check for possible point sources which could overestimate the local extinctions. No such source has been found in the here regarded area.
Cameron (1990) has shown that to correct highly absorbed isophotal magnitudes of galaxies it is necessary to apply both a correction to the magnitude as well as a correction for the fact that the angular diameter of an obscured object appears smaller and therefore the isophotal magnitude appears fainter. Cameron has determined the correction for diameters in the optical -band up to extinctions of . The effect of extinction on the SExtractor Kron magnitudes is more difficult to estimate: Kron ‘total’ magnitudes are computed within an elliptical aperture the size of which is equal to some constant times the 1st order moment computed within the detection (or analysis) threshold. The effect of extinction is to push the entire galaxy intensity profile down by some factor, which means that the detection isophote is smaller, hence the 1st order moment is smaller, hence the Kron aperture is smaller and the derived magnitude is fainter.
To analyse this effect in detail was beyond the scope of this paper, and we have not attempted a diameter correction for the magnitudes. Throughout the paper extinction-corrected magnitudes mean a correction for magnitudes only, unless noted otherwise. On the other hand, the colours given refer to a fixed aperture where a diameter correction is unnecessary for all galaxies larger than the aperture.
6 The catalogue
Table 2 lists all the galaxies and galaxy candidates in the searched area. The columns are as follows.
Column 1: Identity consisting of the lettering DZOA (for DENIS-ZOA) followed by the DENIS slot number and a consecutive number for each initial candidate.
Column 2: Total number of sightings of same galaxy (e.g., on overlap regions or repeat observations). A plus denotes an additional observation from the pre-survey (these observations were used for verification only).
Column 3: Right Ascension and Declination (J2000). A colon after the coordinates indicates a lower positional accuracy (cf. Table 1). They were determined from the DSS-red images.
Column 4: Galactic longitude and latitude in degrees.
Column 5: -band extinction as derived from the reddening values of the IRAS/DIRBE maps (Schlegel et al. 1998) using . Note that the extinction values are not calibrated for and may be unreliable. For the subsequent analysis, the extinctions in the NIR bands were calculated using eqs [1].
Column 6: Classification of the candidate: DG stands for DENIS galaxy; UG stands for an uncertain galaxy; BG indicates a galaxy that was identified after consulting the WKK catalogue. NG stands for a -band galaxy that was found to be non-galaxian with DENIS.
Column 7: Visibility of the galaxy in the -, -, -, and -bands respectively, where 1 stands for a positive identification and 0 for a non-detection.
| Ident. | N | R.A. (J2000) Dec. | Gal | Gal | Class | Visibil. | Type | Phot. | |||||||||||||||||
|---|---|---|---|---|---|---|---|---|---|---|---|---|---|---|---|---|---|---|---|---|---|---|---|---|---|
| [h m s] | [∘ ] | [∘] | [∘] | [mag] | [mag] | [mag] | [mag] | [mag] | [mag] | [mag] | [] | [] | [] | ||||||||||||
| (1) | (2) | (3a) | (3b) | (4a) | (4b) | (5) | (6) | (7) | (8) | (9) | (10) | (11) | (12) | (13) | (14) | (15) | (16) | (17) | (18) | ||||||
| DZOA4638-04 | 1 | 13 27 20.3 | -57 52 08 | 307.71 | 4.67 | 2.8 | DG | 0 1 1 1 | SM | 15.35 | 13.87 | … | … | 1.01 | … | … | … | … | 000 | 11 | 14 | 5 | |||
| DZOA4638-09 | 1 | 13 27 25.1 | -58 20 28 | 307.65 | 4.20 | 2.6 | DG | 0 1 1 1 | E/SE | 15.96 | 14.02 | 12.87 | 1.06 | 1.87 | 0.80 | 030 | 11 | 12 | 7 | ||||||
| DZOA4638-03 | 1 | 13 28 10.0 | -57 41 09 | 307.84 | 4.83 | 3.0 | DG | 0 1 1 1 | E/SE | 16.10 | 14.19 | 12.98 | 1.17 | 2.08 | 0.93 | 000 | 10 | 13 | 5 | ||||||
| DZOA4638-11 | 1 | 13 28 10.3 | -60 22 59 | 307.46 | 2.17 | 5.0 | DG | 0 1 1 1 | SM | 13.70 | 11.92 | 10.90 | 0.27 | 0.83 | 0.56 | 774 | 17 | 35 | 15 | ||||||
| DZOA4638-10 | 2 | 13 28 11.0 | -59 25 09 | 307.60 | 3.12 | 3.1 | DG | 0 1 1 0 | SM | 16.40 | … | … | … | … | … | … | … | … | … | … | 000 | 10 | 8 | … | |
| DZOA4638-06 | 2 | 13 28 15.4 | -57 55 21 | 307.82 | 4.60 | 2.7 | DG | 0 1 1 1 | SM | 15.64 | 14.19 | 12.65 | 0.88 | 1.83 | 0.95 | 000 | 10 | 12 | 6 | ||||||
| DZOA4638-01 | 2 | 13 28 37.1 | -57 42 19 | 307.90 | 4.81 | 2.9 | DG | 1 1 1 1 | SE | 13.96 | 12.02 | 10.78 | 0.98 | 1.90 | 0.91 | 000 | 22 | 25 | 17 | ||||||
| DZOA4639-07 | 3 | 13 28 44.4 | -58 03 32 | 307.87 | 4.46 | 2.8 | UG | 0 1 1 0 | SM | … | … | … | … | … | … | … | … | … | … | … | … | 000 | 7 | 8 | … |
| DZOA4639-06 | 1 | 13 28 49.7 | -58 03 21 | 307.88 | 4.46 | 2.7 | DG | 1 1 1 1 | SM | 15.48 | 14.05 | … | … | 1.02 | … | … | … | … | 330 | 10 | 12 | 7 | |||
| DZOA4639-19 | 2 | 13 29 00.3 | -58 55 30 | 307.77 | 3.59 | 2.6 | BG | 1 1 1 0 | SL | … | … | 15.27 | … | … | … | … | … | … | … | … | 000 | 6 | 9 | … | |
| DZOA4639-02 | 1 | 13 29 01.7 | -57 37 32 | 307.97 | 4.88 | 3.0 | DG | 0 1 1 0 | SM | 16.30 | 14.95 | … | … | 0.99 | … | … | … | … | 000 | 7 | 6 | … | |||
| DZOA4639-14 | 1 | 13 29 10.4 | -59 42 27 | 307.68 | 2.82 | 4.1 | UG | 0 1 1 0 | S | … | … | … | … | … | … | … | … | … | … | … | … | 000 | 6 | 7 | … |
| DZOA4639-01 | 1 | 13 29 14.7 | -57 37 06 | 308.00 | 4.88 | 3.0 | UG | 0 1 1 1 | E/SE | 16.93 | 14.71 | … | … | 1.07 | … | … | … | … | 000 | 9 | 13 | 7 | |||
| DZOA4639-03 | 1 | 13 29 16.1 | -57 39 56 | 307.99 | 4.83 | 2.9 | DG | 0 1 1 1 | SM | 15.79 | 13.60 | 12.99 | 0.95 | 1.77 | 0.81 | 030 | 12 | 15 | 6 | ||||||
| DZOA4639-05 | 2 | 13 29 17.7 | -57 56 03 | 307.96 | 4.57 | 2.7 | DG | 1 1 1 1 | E/SE | 14.30 | 12.20 | 11.20 | 1.02 | 2.04 | 1.02 | 040 | 20 | 22 | 14 | ||||||
| DZOA4639-10 | 1 | 13 29 25.8 | -59 07 11 | 307.80 | 3.39 | 2.6 | DG | 0 1 1 1 | E/SE | 15.51 | 13.53 | 12.61 | 0.98 | 1.92 | 0.94 | 000 | 10 | 10 | 7 | ||||||
| DZOA4639-09 | 1 | 13 29 33.2 | -58 50 54 | 307.86 | 3.66 | 3.0 | DG | 1 1 1 1 | SM | 14.25 | 12.39 | 11.39 | 0.93 | 1.57 | 0.65 | 330 | 17 | 25 | 11 | ||||||
| DZOA4639-08 | 1 | 13 29 40.9 | -58 49 30 | 307.87 | 3.68 | 3.1 | DG | 0 1 1 1 | SE | … | … | … | … | 12.65 | … | … | … | … | … | … | 000 | 15 | 13 | 7 | |
| DZOA4639-16 | 6 | 13 29 50.5 | -60 44 05 | 307.61 | 1.79 | 5.8 | UG | 0 1 1 1 | SM | 16.15 | 13.83 | 12.48 | 0.81 | 1.74 | 0.93 | 300 | 6 | 9 | 8 | ||||||
| DZOA4639-13 | 3 | 13 29 51.9 | -59 28 19 | 307.80 | 3.04 | 3.1 | DG | 1 1 1 1 | SM | 15.57 | 13.48 | 12.50 | 0.88 | 1.79 | 0.90 | 440 | 11 | 12 | 8 | ||||||
| DZOA4640-05 | 2 | 13 30 13.4 | -59 08 34 | 307.90 | 3.35 | 3.1 | DG | 0 1 1 1 | SE | 15.96 | 14.45 | … | … | 0.92 | … | … | … | … | 000 | 9 | 12 | 6 | |||
| DZOA4640-03 | 2 | 13 30 34.6 | -58 29 24 | 308.04 | 3.99 | 3.4 | DG | 1 1 1 1 | SE | 15.51 | 13.64 | 12.86 | 1.07 | 1.82 | 0.75 | 000 | 13 | 14 | 8 | ||||||
| DZOA4640-02 | 2 | 13 31 09.6 | -58 09 45 | 308.17 | 4.30 | 2.8 | DG | 0 1 1 1 | E | 14.35 | 12.69 | 11.79 | 0.95 | 1.74 | 0.79 | 740 | 17 | 18 | 12 | ||||||
| DZOA4641-01 | 1 | 13 31 33.3 | -57 50 04 | 308.27 | 4.62 | 2.7 | DG | 1 1 1 1 | SM | 13.53 | 11.52 | 10.70 | 1.16 | 2.19 | 1.04 | 000 | 40 | 42 | 21 | ||||||
| DZOA4641-04 | 1 | 13 31 36.6 | -60 22 37 | 307.88 | 2.11 | 5.8 | UG | 0 0 1 1 | SM | … | … | … | … | 12.22 | … | … | … | … | 0.79 | 074 | … | 10 | 6 | ||
| DZOA4641-02 | 1 | 13 31 43.7 | -57 53 11 | 308.28 | 4.57 | 2.8 | DG | 1 1 1 1 | E | 13.64 | 11.83 | 10.57 | 1.03 | 1.94 | 0.91 | 000 | 20 | 23 | 14 | ||||||
| DZOA4641-06 | 2 | 13 32 03.3 | -63 05 06 | 307.51 | -0.57 | 38.5 | UG | 0 0 0 1 | ? | … | … | … | … | 12.25 | … | … | … | … | … | … | 000 | … | … | 7 | |
| DZOA4642-04 | 2 | 13 33 11.8 | -58 49 22 | 308.32 | 3.61 | 4.0 | DG | 1 1 1 1 | SL | 16.22 | 14.26 | 12.57 | 0.84 | 2.02 | 1.18 | 000 | 10 | 14 | 8 | ||||||
| DZOA4642-01 | 2 | 13 33 39.2 | -57 47 42 | 308.55 | 4.62 | 2.8 | DG | 1 1 1 1 | SE | 13.50 | 11.47 | 10.13 | 1.04 | 1.95 | 0.91 | 000 | 28 | 30 | 19 | ||||||
| DZOA4642-06 | 2 | 13 33 47.6 | -59 03 07 | 308.36 | 3.37 | 4.0 | DG | 1 1 1 1 | SE/M | 16.13 | 14.24 | … | … | 0.63 | … | … | … | … | 030 | 9 | 9 | 6 | |||
| DZOA4642-02 | 6 | 13 33 58.2 | -58 00 29 | 308.56 | 4.40 | 3.2 | DG | 1 1 1 1 | SE | 14.16 | 12.97 | 11.22 | 0.85 | 1.83 | 0.98 | 330 | 27 | 33 | 22 | ||||||
| DZOA4644-04 | 14 | 13 35 26.0 | -59 14 38 | 308.54 | 3.15 | 4.1 | UG | 0 1 1 1 | SM | 15.60 | 14.13 | … | … | 0.36 | … | … | … | … | 000 | 12 | 13 | 7 | |||
| DZOA4644-02 | 6 | 13 35 30.1 | -57 53 47 | 308.78 | 4.47 | 3.3 | DG | 0 1 1 0 | SL | 15.97 | 14.33 | … | … | 0.94 | … | … | … | … | 000 | 9 | 8 | … | |||
| DZOA4644-01 | 3 | 13 36 08.1 | -57 37 48 | 308.91 | 4.72 | 2.7 | DG | 0 1 1 1 | SE | 16.29 | 15.02 | … | … | 1.01 | … | … | … | … | 300 | 7 | 9 | 6 | |||
| DZOA4645-01 | 2 | 13 37 05.0 | -58 02 40 | 308.96 | 4.29 | 3.1 | DG | 0 1 1 1 | SE | 15.89 | 14.08 | 12.29 | 1.05 | 2.04 | 0.98 | 000 | 11 | 11 | 6 | ||||||
| DZOA4645-14 | 2 | 13 37 15.2 | -57 37 11 | 309.06 | 4.71 | 2.7 | BG | 1 1 1 0 | SM/L | … | … | … | … | … | … | … | … | … | … | … | … | 000 | 4 | 5 | … |
| DZOA4645-13 | 2 | 13 37 20.7 | -63 28 12 | 308.03 | -1.05 | 24.3 | UG | 0 0 1 1 | ? | … | … | … | … | 10.44 | … | … | … | … | … | … | 006 | … | 8 | 15 | |
| DZOA4645-09 | 2 | 13 37 24.7 | -58 52 21 | 308.86 | 3.47 | 4.5 | DG | 1 1 1 1 | SE | 13.10 | 11.32 | 10.28 | 0.69 | 1.38 | 0.71 | 000 | 47 | 43 | 22 | ||||||
| DZOA4645-04 | 2 | 13 37 31.9 | -58 08 01 | 309.00 | 4.19 | 3.1 | DG | 0 1 1 1 | E | 16.59 | 14.59 | … | … | 1.15 | … | … | … | … | 000 | 9 | 9 | 6 | |||
| DZOA4645-08 | 2 | 13 37 32.8 | -58 50 04 | 308.88 | 3.50 | 4.5 | DG | 1 1 1 1 | SL | 15.00 | 12.65 | 12.38 | 0.78 | 1.35 | 0.57 | 003 | 17 | 22 | 10 | ||||||
| DZOA4645-10 | 4 | 13 37 32.9 | -58 54 14 | 308.87 | 3.44 | 4.5 | DG | 0 1 1 1 | SM | 14.29 | 11.87 | 10.56 | 1.41 | 2.71 | 1.30 | 000 | 24 | 30 | 18 | ||||||
| DZOA4645-03 | 2 | 13 37 44.1 | -58 06 37 | 309.03 | 4.21 | 3.0 | UG | 0 1 1 1 | E/SE | 16.75 | 14.82 | … | … | 1.19 | … | … | … | … | 000 | 7 | 6 | 4 | |||
| DZOA4645-05 | 2 | 13 37 44.3 | -58 13 26 | 309.01 | 4.10 | 3.5 | DG | 1 1 1 0 | SL | … | … | … | … | … | … | … | … | … | … | … | … | 000 | 9 | 15 | 5 |
| DZOA4645-02 | 2 | 13 37 51.3 | -58 00 59 | 309.06 | 4.30 | 2.9 | DG | 0 1 1 0 | S | 17.13 | … | … | … | … | … | … | … | … | … | … | 000 | 6 | 6 | … | |
| DZOA4645-07 | 3 | 13 37 59.2 | -58 30 55 | 308.99 | 3.81 | 4.7 | DG | 0 1 1 1 | SM/L | 15.82 | 12.52 | 11.11 | 1.04 | 2.08 | 1.04 | 030 | 12 | 20 | 13 | ||||||
| DZOA4646-01 | 6 | 13 38 03.3 | -58 14 27 | 309.05 | 4.08 | 3.5 | UG | 0 1 1 1 | SM | … | … | … | … | 13.33 | … | … | … | … | … | … | 000 | 7 | 9 | 5 | |
| DZOA4646-03 | 6 | 13 38 08.5 | -58 45 19 | 308.97 | 3.57 | 4.1 | DG | 0 1 1 1 | SE | 14.33 | 12.21 | 11.11 | 0.89 | 1.85 | 0.96 | 000 | 17 | 19 | 17 | ||||||
| DZOA4646-04 | 1 | 13 38 16.6 | -59 00 15 | 308.94 | 3.32 | 4.3 | DG | 0 1 1 1 | SE/M | 15.74 | 14.11 | 12.72 | 0.90 | 1.62 | 0.73 | 000 | 12 | 15 | 6 | ||||||
| DZOA4646-06 | 1 | 13 38 21.7 | -60 17 02 | 308.72 | 2.06 | 9.0 | DG | 0 1 1 1 | E/SE | … | … | 13.77 | 12.41 | … | … | … | … | 0.49 | 040 | 7 | 10 | 9 | |||
| DZOA4647-03 | 4 | 13 39 17.6 | -59 04 46 | 309.06 | 3.22 | 4.2 | UG | 0 1 1 1 | SM/L | 15.56 | 13.89 | 12.26 | 0.29 | 1.25 | 0.96 | 000 | 10 | 11 | 7 | ||||||
| DZOA4647-01 | 2 | 13 39 39.7 | -58 04 00 | 309.29 | 4.21 | 3.5 | DG | 0 1 1 1 | SM | 16.03 | 13.76 | 12.43 | 0.97 | 2.03 | 1.06 | 000 | 10 | 12 | 5 | ||||||
| DZOA4647-02 | 1 | 13 39 52.7 | -57 42 17 | 309.39 | 4.56 | 2.6 | DG | 1 1 1 1 | SE | 15.20 | 13.80 | … | … | 0.54 | … | … | … | … | 000 | 12 | 14 | 5 | |||
| DZOA4649-02 | 3+ | 13 41 54.8 | -58 48 28 | 309.44 | 3.42 | 3.9 | DG | 0 1 1 1 | SL | 15.86 | 13.32 | … | … | 0.61 | … | … | … | … | 000 | 25 | 25 | 6 | |||
| DZOA4649-07 | 3+ | 13 42 09.8 | -61 08 18 | 309.02 | 1.13 | 12.0 | DG | 0 0 1 1 | ? | … | … | … | … | … | … | … | … | … | … | … | … | 000 | … | 17 | 15 |
| DZOA4649-06 | 2+ | 13 42 29.6 | -61 01 23 | 309.08 | 1.24 | 13.0 | DG | 0 0 1 1 | SE | … | … | 13.69 | 11.31 | … | … | … | … | 1.11 | 000 | … | 14 | 13 | |||
| Ident. | N | R.A. (J2000) Dec. | Gal | Gal | Class | Visibil. | Type | Phot. | |||||||||||||||||
|---|---|---|---|---|---|---|---|---|---|---|---|---|---|---|---|---|---|---|---|---|---|---|---|---|---|
| [h m s] | [∘ ] | [∘] | [∘] | [mag] | [mag] | [mag] | [mag] | [mag] | [mag] | [mag] | [] | [] | [] | ||||||||||||
| (1) | (2) | (3a) | (3b) | (4a) | (4b) | (5) | (6) | (7) | (8) | (9) | (10) | (11) | (12) | (13) | (14) | (15) | (16) | (17) | (18) | ||||||
| DZOA4649-03 | 2+ | 13 42 35.6 | -59 33 18 | 309.38 | 2.67 | 6.7 | UG | 0 1 1 0 | SM/L | 16.98 | … | … | … | … | … | … | … | … | … | … | 000 | 5 | 6 | … | |
| DZOA4649-01 | 2 | 13 42 59.9 | -57 39 06 | 309.81 | 4.53 | 2.5 | DG | 1 1 1 1 | SM | 15.69 | … | … | … | … | … | … | … | … | … | … | 000 | 13 | 13 | 7 | |
| DZOA4650-09 | 1+ | 13 44 03.7 | -60 19 35 | 309.40 | 1.88 | 10.4 | DG | 0 1 1 1 | E/SE | 16.67 | 12.64 | 10.61 | 0.87 | 1.71 | 0.85 | 003 | 5 | 24 | 16 | ||||||
| DZOA4650-01 | 2+ | 13 44 36.5 | -58 13 10 | 309.90 | 3.93 | 3.9 | DG | 0 1 1 1 | SM | 14.98 | … | … | … | … | … | … | … | … | … | … | 377 | 18 | 20 | 11 | |
| DZOA4651-05 | 1 | 13 45 00.2 | -59 22 17 | 309.72 | 2.79 | 6.2 | UG | 0 1 1 0 | SM/L | … | … | … | … | … | … | … | … | … | … | … | … | 000 | 2 | 3 | … |
| DZOA4651-02 | 1 | 13 45 17.7 | -58 12 01 | 310.00 | 3.93 | 3.5 | DG | 0 1 1 0 | SL | … | … | 14.88 | … | … | … | … | … | … | … | … | 000 | 13 | 12 | … | |
| DZOA4651-08 | 1 | 13 45 25.3 | -60 29 14 | 309.54 | 1.69 | 11.9 | UG | 0 0 1 1 | ? | … | … | … | … | 11.80 | … | … | … | … | … | … | 003 | … | 12 | 12 | |
| DZOA4651-06 | 2 | 13 45 50.7 | -60 09 05 | 309.66 | 2.01 | 8.2 | DG | 0 1 1 1 | E/SE | … | … | … | … | 10.73 | … | … | … | … | … | … | 004 | 12 | 21 | 13 | |
| DZOA4652-01 | 1 | 13 46 40.3: | -57 39 50: | 310.29 | 4.42 | 2.3 | UG | 0 1 1 1 | SE/M | 16.16 | … | … | … | … | … | … | … | … | … | … | 000 | 9 | 8 | 5 | |
| DZOA4652-04 | 2 | 13 46 48.9: | -60 24 29: | 309.72 | 1.73 | 12.3 | DG | 0 1 1 1 | E | 15.74 | 11.62 | 9.11 | 0.67 | 1.40 | 0.74 | 000 | 12 | 38 | 32 | ||||||
| DZOA4652-02 | 1 | 13 46 57.3: | -58 10 19: | 310.22 | 3.91 | 3.3 | DG | 0 1 1 0 | SL | 17.26 | … | … | … | … | … | … | … | … | … | … | 000 | 5 | 7 | … | |
| DZOA4653-09 | 4 | 13 47 18.5 | -60 34 13 | 309.75 | 1.56 | 12.2 | DG | 0 0 1 1 | SE/M | … | … | 12.65 | 10.24 | … | … | … | … | 0.82 | 000 | … | 22 | 21 | |||
| DZOA4653-03 | 1 | 13 47 32.3 | -58 47 45 | 310.16 | 3.29 | 3.8 | UG | 0 1 1 0 | ? | … | … | … | … | … | … | … | … | … | … | … | … | 000 | 10 | 8 | … |
| DZOA4653-11 | 1 | 13 47 36.2 | -60 37 04 | 309.77 | 1.51 | 12.0 | DG | 0 1 1 1 | Sy 2 | 16.77 | 13.14 | 10.56 | 0.38 | 1.63 | 1.25 | 000 | 7 | 14 | 16 | ||||||
| DZOA4653-04 | 1 | 13 47 38.2 | -58 52 15 | 310.15 | 3.21 | 4.3 | UG | 0 1 1 0 | S | … | … | … | … | … | … | … | … | … | … | … | … | 000 | 4 | 2 | … |
| DZOA4653-01 | 1 | 13 47 44.1 | -58 26 38 | 310.26 | 3.62 | 3.8 | UG | 0 1 1 1 | SM | … | … | … | … | … | … | … | … | … | … | … | … | 000 | 15 | 17 | 10 |
| DZOA4653-07 | 1 | 13 48 27.5 | -60 11 47 | 309.97 | 1.89 | 10.7 | DG | 0 1 1 1 | S | 16.23 | 13.29 | 11.46 | 0.24 | 0.75 | 0.52 | 030 | 8 | 18 | 11 | ||||||
| DZOA4654-03 | 1 | 13 49 04.0 | -58 27 34 | 310.43 | 3.57 | 3.2 | UG | 0 1 1 1 | SM | 15.65 | 13.92 | 12.16 | 0.91 | 1.84 | 0.93 | 403 | 9 | 11 | 8 | ||||||
| DZOA4654-02 | 1 | 13 49 46.1 | -58 13 04 | 310.57 | 3.79 | 2.6 | DG | 1 1 1 1 | SM | 14.61 | 12.96 | 11.81 | 1.00 | 1.91 | 0.91 | 000 | 16 | 16 | 10 | ||||||
| DZOA4654-01 | 1 | 13 49 49.9 | -57 37 25 | 310.71 | 4.36 | 2.5 | DG | 1 1 1 0 | SL | 16.34 | 14.59 | … | … | 0.66 | … | … | … | … | 000 | 12 | 7 | … | |||
| DZOA4655-01 | 1+ | 13 50 21.3 | -58 17 12 | 310.63 | 3.70 | 2.9 | DG | 0 1 1 1 | SE | 14.91 | 13.15 | 12.51 | 1.07 | 1.82 | 0.75 | 330 | 14 | 14 | 8 | ||||||
| DZOA4655-04 | 1+ | 13 50 47.0 | -59 23 08 | 310.43 | 2.62 | 6.1 | DG | 0 1 1 1 | SM | 15.59 | 12.86 | 11.70 | 1.12 | 2.03 | 0.91 | 033 | 12 | 15 | 12 | ||||||
| DZOA4655-03 | 1+ | 13 50 55.3 | -59 08 29 | 310.51 | 2.85 | 4.1 | DG | 0 1 1 1 | SM/L | 15.70 | 13.82 | … | … | 0.80 | … | … | … | … | 000 | 12 | 9 | 8 | |||
| DZOA4655-02 | 1+ | 13 50 56.5 | -58 27 46 | 310.66 | 3.51 | 3.5 | DG | 0 1 1 1 | SM | 15.88 | … | … | 12.21 | … | … | 2.26 | … | … | 000 | 13 | 12 | 8 | |||
| DZOA4655-08 | 1+ | 13 51 03.5 | -57 47 15 | 310.83 | 4.17 | 2.5 | BG | 1 0 0 0 | SL | … | … | … | … | … | … | … | … | … | … | … | … | 000 | … | … | … |
| DZOA4656-01 | 1 | 13 51 31.9 | -58 23 01 | 310.76 | 3.57 | 3.0 | DG | 0 1 1 1 | SE | 15.75 | 13.64 | 12.85 | 1.04 | 2.12 | 1.07 | 000 | 8 | 12 | 7 | ||||||
| DZOA4656-04 | 1 | 13 51 33.9 | -60 07 17 | 310.36 | 1.88 | 9.2 | UG | 0 1 1 1 | S | … | … | 13.45 | 12.21 | … | … | … | … | 0.31 | 030 | 7 | 9 | 8 | |||
| DZOA4656-03 | 2 | 13 51 38.6 | -58 35 15 | 310.72 | 3.37 | 4.1 | DG | 1 1 1 1 | SE | 12.77 | 10.81 | 9.14 | 1.09 | 1.99 | 0.89 | 000 | 48 | 54 | 37 | ||||||
| DZOA4656-02 | 1 | 13 51 39.8 | -58 26 48 | 310.76 | 3.51 | 3.2 | UG | 0 1 0 0 | SM/L | … | … | … | … | … | … | … | … | … | … | … | … | 000 | 5 | … | … |
| DZOA4657-03 | 1 | 13 52 55.4 | -58 09 59 | 310.99 | 3.74 | 2.3 | UG | 0 1 1 1 | E/SE | 15.94 | 14.61 | … | … | 1.16 | … | … | … | … | 000 | 6 | 9 | 5 | |||
| DZOA4657-04 | 1 | 13 53 08.7 | -58 12 59 | 311.00 | 3.69 | 2.4 | UG | 0 1 1 0 | SL | … | … | … | … | … | … | … | … | … | … | … | … | 000 | 8 | 8 | 5 |
| DZOA4657-02 | 1 | 13 53 32.4 | -57 49 30 | 311.15 | 4.05 | 2.7 | DG | 0 1 1 1 | E/SE | … | … | … | … | … | … | … | … | … | … | … | … | 000 | 12 | 11 | 7 |
| DZOA4657-01 | 1 | 13 53 34.1 | -57 49 10 | 311.15 | 4.06 | 2.7 | DG | 0 1 1 1 | SE | 14.81 | 13.26 | 12.25 | 0.91 | 1.67 | 0.77 | 000 | 15 | 14 | 9 | ||||||
| DZOA4658-06 | 1 | 13 54 18.1: | -59 56 14: | 310.74 | 1.98 | 10.1 | UG | 0 1 1 0 | S | 17.69 | 14.28 | … | … | 0.57 | … | … | … | … | 999 | 4 | 8 | … | |||
| DZOA4658-04 | 1 | 13 54 23.1: | -58 06 30: | 311.19 | 3.75 | 2.5 | DG | 0 1 1 1 | SM | … | … | … | … | … | … | … | … | … | … | … | … | 999 | 9 | 12 | 8 |
| DZOA4658-03 | 1 | 13 54 27.3: | -58 07 35: | 311.19 | 3.73 | 2.6 | DG | 1 1 1 1 | SM | 14.68 | 12.69 | … | … | 1.49 | … | … | … | … | 999 | 14 | 15 | 12 | |||
| DZOA4658-01 | 1 | 13 54 38.5: | -57 41 11: | 311.32 | 4.15 | 2.3 | DG | 1 1 1 0 | SE | … | … | … | … | … | … | … | … | … | … | … | … | 999 | 4 | 6 | … |
| DZOA4658-05 | 1 | 13 54 39.5: | -58 31 07: | 311.12 | 3.34 | 3.4 | UG | 0 1 1 1 | SM | 17.48 | 14.38 | … | … | 1.42 | … | … | … | … | 999 | 6 | 9 | 3 | |||
| DZOA4659-13 | 2 | 13 55 18.4 | -58 05 32 | 311.31 | 3.74 | 2.8 | UG | 0 1 1 1 | E/SE | 15.84 | 14.48 | … | … | 1.03 | … | … | … | … | 000 | 9 | 9 | 5 | |||
| DZOA4659-11 | 1 | 13 55 29.0 | -57 38 59 | 311.44 | 4.16 | 2.4 | BG | 1 1 1 0 | SE/M | 15.80 | 14.48 | … | … | 0.95 | … | … | … | … | 300 | 6 | 13 | 3 | |||
| DZOA4659-10 | 1 | 13 55 29.5 | -57 35 26 | 311.46 | 4.22 | 2.4 | BG | 1 1 1 0 | S | … | … | … | … | … | … | … | … | … | … | … | … | 000 | 5 | 3 | … |
| DZOA4659-01 | 1 | 13 55 43.5 | -57 48 38 | 311.43 | 4.00 | 2.9 | UG | 0 1 1 1 | – | 15.99 | 13.04 | 11.50 | 1.24 | 2.39 | 1.15 | 060 | 4 | 8 | 5 | ||||||
| DZOA4659-02 | 1 | 13 56 07.7 | -58 52 21 | 311.22 | 2.95 | 3.8 | UG | 0 1 1 1 | ? | 14.75 | 13.21 | 13.09 | 0.52 | 0.88 | 0.37 | 664 | 11 | 17 | 6 | ||||||
| DZOA4659-05 | 1 | 13 56 09.7 | -59 46 14 | 311.00 | 2.08 | 8.1 | UG | 0 1 1 1 | S | 16.85 | 13.64 | 12.65 | 0.75 | 1.15 | 0.40 | 000 | 10 | 10 | 5 | ||||||
| DZOA4660-02 | 1 | 13 56 52.3 | -57 51 53 | 311.57 | 3.91 | 2.5 | DG | 1 1 1 1 | SM | 15.98 | 14.50 | … | … | 0.70 | … | … | … | … | 000 | 10 | 12 | 6 | |||
| DZOA4660-05 | 1 | 13 57 01.5 | -59 12 35 | 311.25 | 2.60 | 5.4 | DG | 0 1 1 1 | E/SE | 15.86 | 13.05 | 11.91 | 0.91 | 1.58 | 0.67 | 030 | 10 | 14 | 15 | ||||||
| DZOA4660-03 | 1 | 13 57 06.7 | -58 02 43 | 311.55 | 3.72 | 2.9 | DG | 0 1 1 1 | E/SE | 16.22 | 14.00 | 12.98 | 1.08 | 2.26 | 1.18 | 000 | 9 | 12 | 8 | ||||||
| DZOA4660-01 | 2 | 13 57 08.2 | -57 44 09 | 311.63 | 4.02 | 2.6 | UG | 0 1 1 1 | SE | 15.05 | 13.94 | 13.13 | 0.56 | 1.39 | 0.84 | 000 | 12 | 13 | 6 | ||||||
| DZOA4660-04 | 1 | 13 57 46.6 | -58 07 01 | 311.62 | 3.63 | 3.0 | DG | 0 1 1 1 | E | 15.51 | 13.98 | 12.20 | 0.99 | 2.22 | 1.22 | 000 | 9 | 10 | 9 | ||||||
| DZOA4661-03 | 2 | 13 58 52.6 | -59 45 47 | 311.33 | 2.00 | 8.9 | UG | 0 1 1 1 | S | 17.16 | 13.91 | 12.68 | 0.66 | 1.26 | 0.59 | 030 | 4 | 9 | 7 | ||||||
| DZOA4661-01 | 2 | 13 58 57.0 | -58 46 02 | 311.60 | 2.96 | 4.3 | DG | 1 1 1 1 | SM | 13.99 | 11.44 | 10.05 | 0.95 | 1.81 | 0.86 | 030 | 26 | 27 | 22 | ||||||
| DZOA4662-02 | 2 | 13 59 35.7: | -58 25 49: | 311.77 | 3.27 | 4.5 | UG | 0 1 1 1 | E/SE | 15.35 | 13.35 | 12.09 | 0.72 | 1.62 | 0.90 | 400 | 10 | 12 | 11 | ||||||
| DZOA4662-03 | 1 | 14 00 01.9: | -58 29 06: | 311.81 | 3.20 | 4.9 | UG | 0 1 1 0 | S | 16.71 | … | … | … | … | … | … | … | … | … | … | 000 | 10 | 7 | … | |
| DZOA4662-01 | 1 | 14 00 04.0: | -57 50 02: | 311.99 | 3.83 | 2.7 | DG | 1 1 1 1 | SM | 15.51 | 13.61 | 12.03 | 1.34 | 2.24 | 0.90 | 000 | 17 | 21 | 18 | ||||||
| DZOA4662-04 | 1 | 14 00 10.9: | -59 12 35: | 311.64 | 2.50 | 5.2 | UG | 0 1 1 0 | SM/L | 16.35 | … | … | … | … | … | … | … | … | … | … | 000 | 5 | 8 | … | |
| Ident. | N | R.A. (J2000) Dec. | Gal | Gal | Class | Visibil. | Type | Phot. | |||||||||||||||||
| [h m s] | [∘ ] | [∘] | [∘] | [mag] | [mag] | [mag] | [mag] | [mag] | [mag] | [mag] | [] | [] | [] | ||||||||||||
| (1) | (2) | (3a) | (3b) | (4a) | (4b) | (5) | (6) | (7) | (8) | (9) | (10) | (11) | (12) | (13) | (14) | (15) | (16) | (17) | (18) | ||||||
| DZOA4662-07 | 1 | 14 00 26.9: | -60 18 31: | 311.38 | 1.43 | 15.4 | UG | 0 0 1 1 | ? | … | … | 14.37 | 12.69 | … | … | … | … | 0.16 | 000 | … | 11 | 9 | |||
| DZOA4663-05 | 2 | 14 00 33.9 | -59 32 32 | 311.60 | 2.16 | 6.6 | DG | 0 1 1 1 | SE/M | 16.53 | 12.86 | 11.45 | 1.37 | 2.27 | 0.90 | 000 | 6 | 16 | 11 | ||||||
| DZOA4663-02 | 1 | 14 00 55.3 | -57 37 23 | 312.15 | 4.00 | 2.9 | DG | 0 1 1 0 | SM | 15.02 | 14.22 | … | … | 0.23 | … | … | … | … | 000 | 13 | 15 | … | |||
| DZOA4663-01 | 1 | 14 00 55.8 | -57 37 28 | 312.15 | 4.00 | 2.9 | DG | 0 1 1 0 | SM | 15.27 | 13.64 | … | … | 0.74 | … | … | … | … | 000 | 14 | 16 | … | |||
| DZOA4663-04 | 1 | 14 01 25.6 | -58 37 37 | 311.95 | 3.01 | 4.4 | DG | 0 1 1 1 | SE/M | 15.84 | 13.43 | 11.99 | 1.11 | 2.19 | 1.08 | 000 | 11 | 14 | 10 | ||||||
| DZOA4663-03 | 1 | 14 01 35.4 | -58 32 22 | 311.99 | 3.09 | 4.3 | UG | 0 1 1 0 | S | 16.38 | 15.39 | … | … | 0.04 | … | … | … | … | 000 | 7 | 8 | … | |||
| DZOA4664-02 | 1 | 14 03 11.2 | -58 06 20 | 312.31 | 3.45 | 3.5 | DG | 0 1 1 1 | SL | 15.03 | 13.46 | … | … | 0.83 | … | … | … | … | 000 | 15 | 15 | 6 | |||
| DZOA4665-02 | 2 | 14 03 13.8 | -58 07 13 | 312.31 | 3.44 | 3.6 | DG | 0 1 1 1 | SM | 14.50 | 12.61 | 11.67 | 0.81 | 1.66 | 0.85 | 030 | 18 | 21 | 12 | ||||||
| DZOA4665-03 | 1 | 14 03 57.5 | -58 09 49 | 312.40 | 3.37 | 4.0 | UG | 0 1 1 1 | SM/L | … | … | … | … | … | … | … | … | … | … | … | … | 000 | 8 | 15 | 6 |
| DZOA4665-01 | 2 | 14 04 21.0 | -57 43 33 | 312.57 | 3.77 | 2.9 | DG | 0 1 1 1 | E | 15.21 | 13.29 | 12.13 | 1.10 | 2.13 | 1.03 | 000 | 10 | 14 | 11 | ||||||
| DZOA4666-01 | 1 | 14 05 35.9 | -59 32 19 | 312.21 | 1.99 | 8.5 | UG | 0 1 1 1 | SM/L | 17.00 | 14.70 | … | … | 0.09 | … | … | … | … | 000 | 6 | 12 | 5 | |||
| -band galaxies found to be non galaxian with DENIS: | |||||||||||||||||||||||||
| DZOA4654-04 | 1 | 13 49 41.3 | -57 48 40 | 310.65 | 4.18 | 2.6 | NG | 1 1 0 0 | – | … | … | … | … | … | … | … | … | … | … | … | … | 000 | 4 | … | … |
| DZOA4655-07 | 1 | 13 50 51.8 | -57 43 02 | 310.82 | 4.24 | 2.6 | NG | 1 1 1 0 | – | … | … | … | … | … | … | … | … | … | … | … | … | 000 | 5 | 4 | … |
| DZOA4660-06 | 2 | 13 56 42.9 | -59 11 16 | 311.22 | 2.63 | 5.1 | NG | 1 1 1 1 | – | 15.95 | 14.62 | … | … | 0.08 | … | … | … | … | 000 | … | … | … | |||
| DZOA4661-04 | 1 | 13 58 40.7 | -58 18 13 | 311.69 | 3.42 | 3.5 | NG | 1 1 1 0 | – | … | … | … | … | … | … | … | … | … | … | … | … | 000 | … | … | … |
| DZOA4664-03 | 2 | 14 02 42.0 | -57 44 08 | 312.35 | 3.83 | 3.3 | NG | 1 1 0 0 | – | … | … | … | … | … | … | … | … | … | … | … | … | 000 | … | … | … |
Column 8: Morphological type of the galaxy as estimated from the appearance in all three NIR passbands as well as the DSS-red image. ‘E’: elliptical galaxy; ‘S’: spiral galaxy (with no possible differentiation between early- and late-type spiral); ‘SE’: early-type spiral; ‘SM’ medium-type spiral; ‘SL’: late-type spiral (including irregulars). A question mark is given if a distinction between an elliptical galaxy and the bulge of a spiral galaxy was not possible. A dash is used where the object is not a galaxy (class NG).
Columns 9 – 11: Total magnitudes and errors in , , and , as derived using SExtractor (with the MAG_AUTO parameter). Note that a galaxy may be visible in one of the NIR bands but have no magnitudes depending on the ability of SExtractor to detect or deblend the object from its neighbours.
Columns 12 – 14: The colours and errors obtained from the 7″-aperture magnitudes as derived using SExtractor and corrected for reddening using the DIRBE/IRAS extinction values: , , and .
Column 15: Quality of the photometry for the -band (first digit), -band (second digit), and -band (last digit): 0 means good photometry, 2 uncertainty in the 7″-aperture magnitude, 3 uncertainty in the total magnitude, and 4 uncertainty in both. 5 means the 7″-aperture magnitude is unreliable, 6 stands for unreliability in the total magnitude, and 7 means both are unreliable. A 9 indicates that the strip was non-photometric (strip 6052) and all photometry is unreliable (the estimated extinction due to the clouds in this case is ). Magnitudes with quality parameters 5 – 9 have been excluded in the further analysis.
Columns 16 – 18: The major diameters of the galaxies in , , and in arseconds, derived at an isophote of , , and , respectively. These isophotes have a comparable background noise in all three bands across the entire search area.
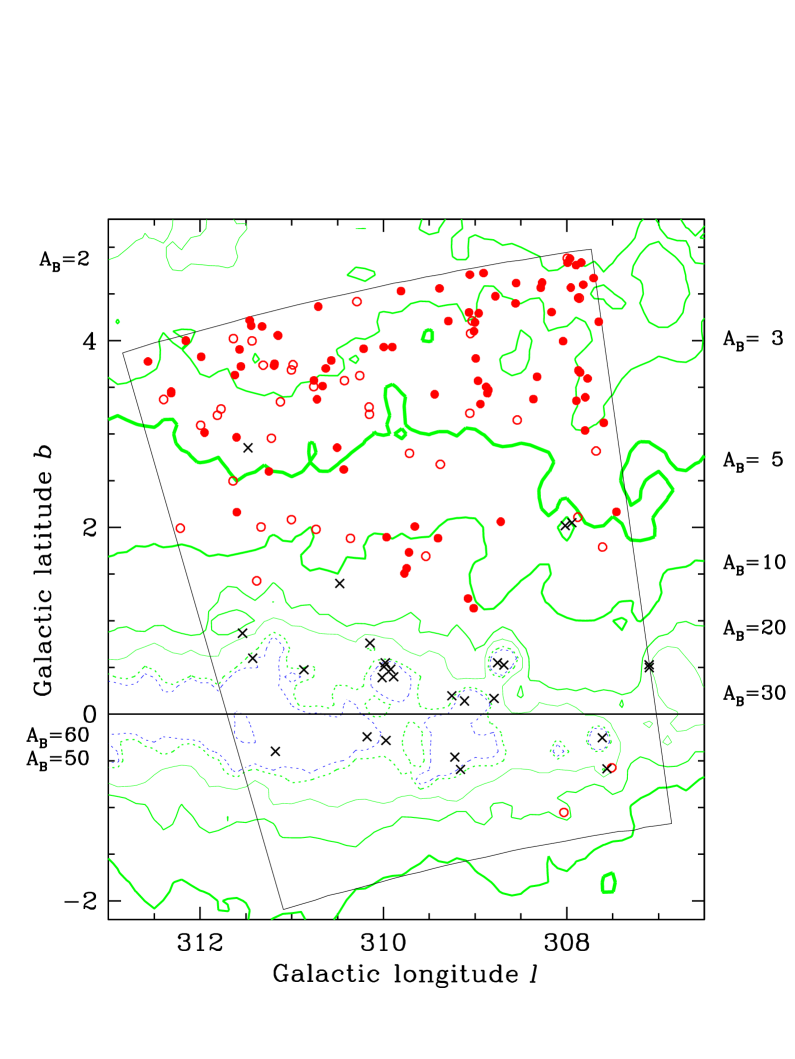
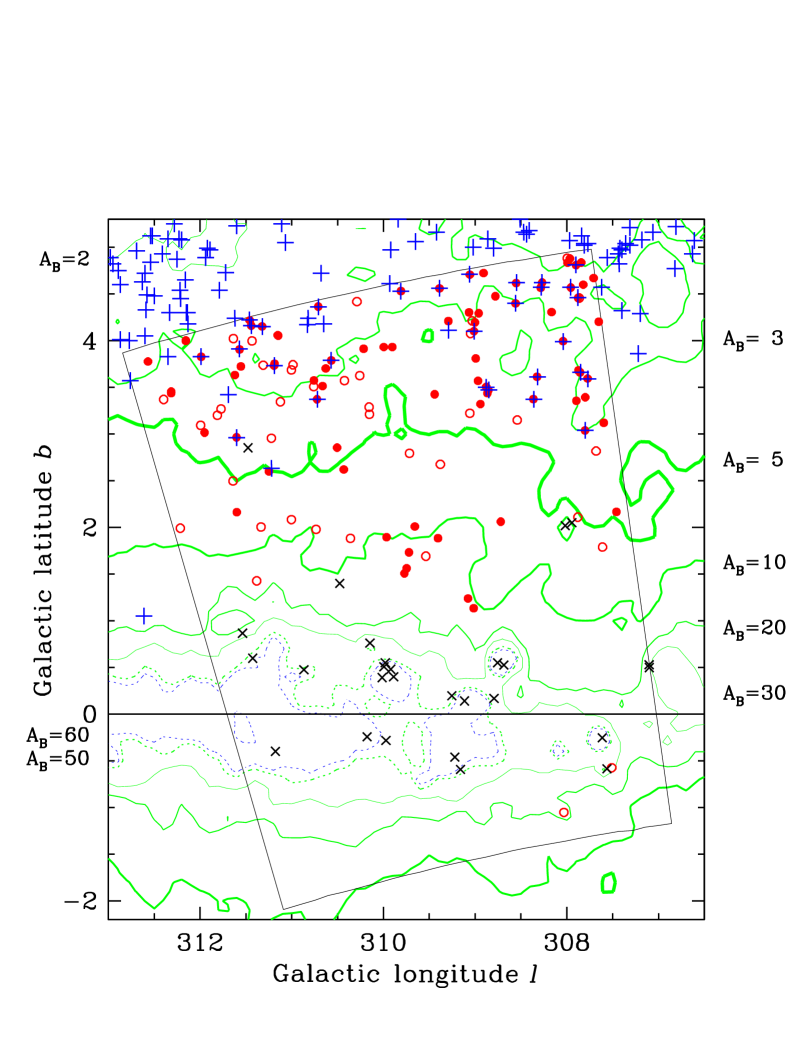
We discovered 83 galaxies (plus 38 uncertain candidates) on the 1073 searched images. 79 (33) of them are visible in the -band, 82 (35) in , and 67 (25) in . Figure 3 shows the distribution of the detected galaxies: filled circles stand for definite galaxies, open circles show uncertain candidates. Crosses denote Galactic objects. The contours depict the extinctions at , , 5m, , , , , and , as indicated.
6.1 Notes on individual objects
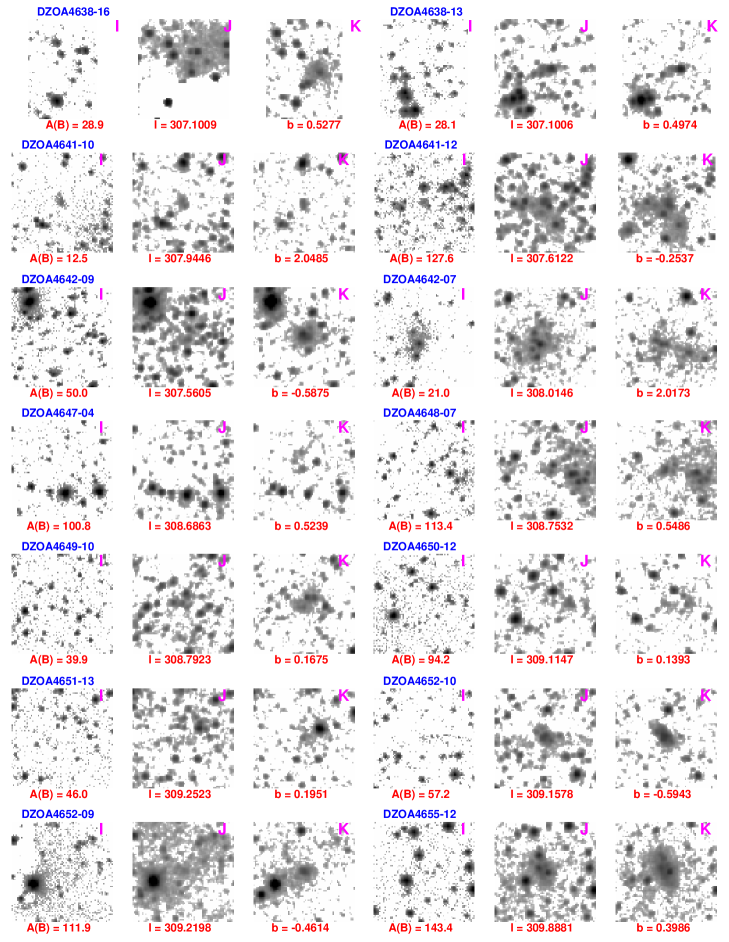
In this section we describe some particularly interesting galaxies. Thumbnail images of these galaxies are presented in Fig. 4 with the -, -, and -band image from left to right. The name of the galaxy is printed at the top and the -band extinction and Galactic coordinates at the bottom. The - and -band images have been smoothed, and the cut values have been calculated separately for each image in dependence of the background.
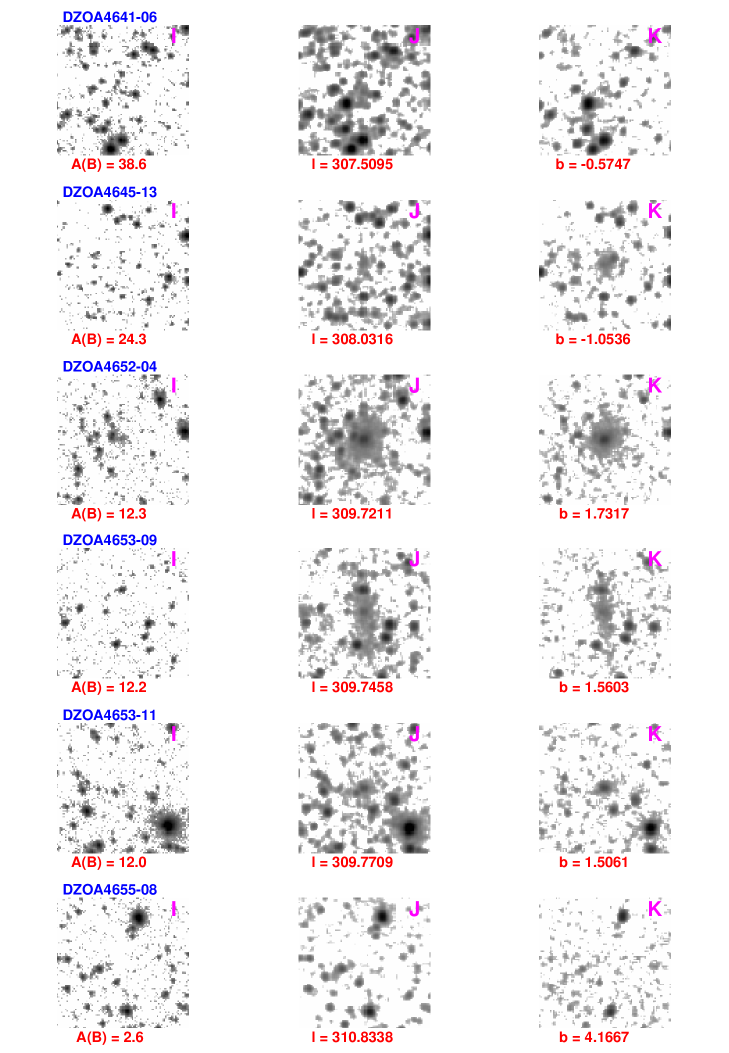
- DZOA4641-06 and DZOA4645-13:
-
Both these objects, classified as uncertain galaxies, have very high extinctions ( and , respectively). They are only visible in the -band and could be Galactic nebulae (e.g., H II regions). However, Galactic objects generally also have very red stars in the immediate surroundings (cf. images in Appendix B), which is not the case here. Moreover, an intrinsically bright galaxy at the cluster distance would indeed still be visible in the -band: the extinction-corrected magnitudes are and , respectively. For comparison, the central elliptical galaxy is only slightly brighter at , which would mean that these two galaxy candidates could lie at the distance of the cluster or closer.
The image of DZOA4645-13 indicates that it may even consist of a pair of galaxies; note, however, that the photometry refers to a single object.
- DZOA4652-04/PKS 1343 – 601:
-
The giant elliptical galaxy in the centre of the search area has an extinction corrected -band magnitude of and is the brightest galaxy (after extinction correction) in the whole search area. Since this galaxy is not visible on the ESO/SERC -band plates we have derived an extinction-free -band magnitude of using (Girardi et al. 2003) for elliptical galaxies.
Tashiro et al. (1998) present ASCA observations of the galaxy and its surroundings. They have also observed PKS 1343 – 601 with XMM. Both observations show a point-like emission from the galaxy centre, indicating it to have an active nucleus. A faint jet to the south-east in the direction of the radio lobes is clearly visible on the XMM and Chandra images. There is also faint diffuse emission connected with the galaxy. This is interpreted by Tashiro et al. as emission due to inverse Compton scattering in the radio lobes. It remains uncertain, whether part of the diffuse X-ray emission could actually be due to hot galaxy cluster gas. This will be discussed more deeply in Paper II.
To determine an X-ray flux for the galaxy, we used the XMM data from the three cameras (37 ks). We fitted a power law modified by absorption to the spectrum (it shows a negligible Fe line), and find a photon index of , and a hydrogen column density of cm-2. We derive an unabsorbed X-ray flux [ keV] of erg cm-2 s-1 with a reduced of 1.0. This leads to an integrated bolometric luminosity of . The latter is suggestive of a weak AGN (cf. DZOA4653-11 below). Adopting the above derived -band magnitude we find and . Note that this value depends on the adopted color (a change of leads to a change of 0.1 in ).
- DZOA4653-09:
-
This is the second largest galaxy within the cluster centre area. With an extinction corrected -band magnitude of it is about fainter than PKS 1343 – 601. The extinction for both galaxies is very similar, but while PKS 1343 – 601 is visible in all passbands, DZOA4645-13 is only visible in the - and -bands. This suggests a lower surface brightness than for elliptical galaxies. DZOA4653-09 is therefore more likely to be an early or medium type spiral: in the -band the bulge is quite distinct and shows an elongated faint halo.
This galaxy was not detected in the blind H I Parkes Multibeam survey of the ZoA (Schröder et al. 2005, Henning et al. 2005); it is therefore unlikely to be an H I-rich spiral at the cluster distance. On the other hand, being close to the centre of the suspected cluster, this galaxy may be H I-deficient.
- DZOA4653-11:
-
This galaxy was discovered in the Galactic Plane optical identification programme of XMM-Newton serendipitous sources carried out by the Survey Science Centre (Motch et al. 2003, Watson et al. 2001). It was identified as a highly obscured AGN by Michel et al. (2004) though a significant part of the extinction is Galactic. It also has an entry in the serendipitous 1XMM catalogue (XMM-Newton Survey Science Centre, 2003).
A deep -band image obtained for the optical identification programme shows a bright bulge and very faint halo, which implies an early type spiral galaxy (see Fig. 1 in Piconcelli et al. 2006). The optical spectrum shows a prominent H line. Together with the [N ii] lines () and [S ii] line () this provides a heliocentric velocity of km s-1, putting DZOA4653-09 right at the cluster distance (see also the velocity determinations in Schröder et al. 2005, Masetti et al. 2006, and Piconcelli et al. 2006).
The XMM-Newton spectrum is highly absorbed due to both intrinsic as well as Galactic absorption: using as a simple model a power law modified by absorption and a faint iron line (44 eV equivalent width), we found a photon index of and a hydrogen column density of cm-2. The Galactic column density at this point is only cm-2, hence there is significant intrinsic absorption (cf. PKS 1343 – 601).
Piconcelli et al. (2006) discuss this galaxy in more detail. They conclude that DZOA4653-09 is likely to be an intermediate Seyfert. Their more complex model gives an absorbed X-ray flux [ keV] of erg cm-2 s-1 with a reduced of 0.94. According to Elvis et al. (1994) the intrinsic hard band luminosity () is about 3% of the bolometric luminosity for quasars, but Gandhi & Fabian (2003) find a value closer to 10% for Seyferts. Using the latter we derive a bolometric luminosity of . We estimate the -band magnitude to be using the extinction-corrected -band magnitude of and the colour (Girardi et al. 2003) for early-type spiral galaxies which is corrected for Galactic extinction as well as internal absorption (we assume the internal absorption to be negligible in the -band). We find and , a typical value for AGNs.
- DZOA4655-08:
-
This galaxy is the only one in the entire search area that was found in the -band but is not visible on the DENIS images. For completeness reasons we have included it in our catalogue. DZOA4655-08 is a late type spiral and lies at a low extinction of . This is consistent with the predictions in Fig. 1 to find more galaxies in the optical than in the NIR at low extinctions levels (; note this limit depends quite strongly on morphological type and surface brightness).
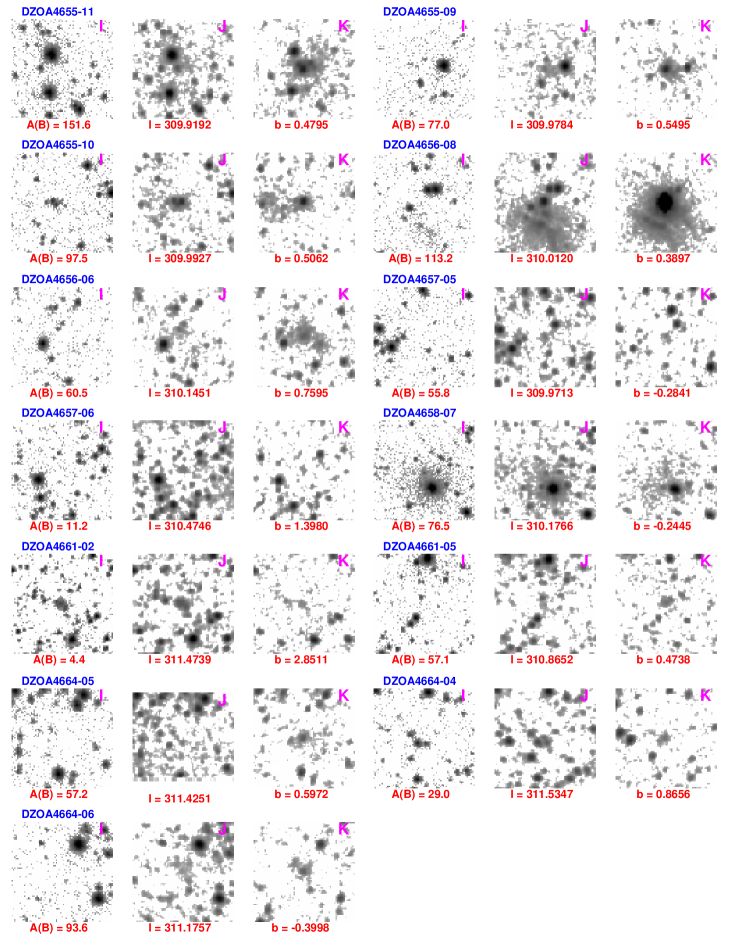
6.2 Galactic objects
| Ident. | N | R.A. (J2000) Dec. | Gal | Gal | Class | Visibil. | Other name | ||
|---|---|---|---|---|---|---|---|---|---|
| (1) | (2) | (3a) | (3b) | (4a) | (4b) | (5) | (6) | (7) | (8) |
| DZOA4638-16 | 1 | 13 27 08.5 | -62 03 17 | 307.10 | 0.53 | 28.9 | … | 0 0 0 1 | 2MASXJ13270813-6203201 |
| DZOA4638-13 | 2 | 13 27 10.4 | -62 05 05 | 307.10 | 0.50 | 28.1 | … | 0 0 1 1 | |
| DZOA4641-10333While this object shows two apparent point sources in the -band, the - and -bands clearly show an elongated compact extended emission with the brightest part positioned on one of the point sources. | 2 | 13 32 12.4 | -60 25 33 | 307.94 | 2.05 | 12.5 | … | 1 1 1 1 | |
| DZOA4641-12 | 5 | 13 32 30.9 | -62 45 06 | 307.61 | -0.25 | 127.6 | HII? | 0 1 1 1 | |
| DZOA4642-09 | 6 | 13 32 31.4 | -63 05 22 | 307.56 | -0.59 | 50.0 | HII | 0 0 1 1 | PMNJ1332-6305 |
| DZOA4642-07 | 3 | 13 32 48.8 | -60 26 44 | 308.02 | 2.02 | 21.0 | YSO | 1 1 1 1 | 2MASXJ13324576-6026565, AM1326-601 |
| DZOA4647-04 | 1 | 13 40 26.4 | -61 47 57 | 308.69 | 0.52 | 100.8 | YSO | 0 0 0 1 | |
| DZOA4648-07 | 1 | 13 40 57.6 | -61 45 44 | 308.75 | 0.55 | 113.4 | … | 0 0 1 1 | 2MASXJ13405761-6145447 |
| DZOA4649-10 | 3+ | 13 41 54.8 | -62 07 43 | 308.79 | 0.17 | 39.9 | … | 0 1 1 1 | |
| DZOA4650-12 | 4++ | 13 44 39.3 | -62 05 31 | 309.12 | 0.14 | 94.2 | HII | 0 0 0 1 | |
| DZOA4651-13 | 1 | 13 45 42.4 | -62 00 32 | 309.25 | 0.20 | 46.0 | … | 0 0 0 1 | |
| DZOA4652-10444This objects shows diffuse emission as well as clumps, and possibly a dust lane. It could be a PN or a YSO seen on edge. | 1 | 13 46 20.8: | -62 48 02: | 309.16 | -0.59 | 57.2 | … | 0 1 1 1 | 2MASXJ13462058-6247597 |
| DZOA4652-09 | 1 | 13 46 37.4: | -62 39 27: | 309.22 | -0.46 | 111.9 | HII? | 0 0 1 1 | 2MASXJ13463702-6239303 |
| DZOA4655-12 | 1 | 13 50 35.4 | -61 40 18 | 309.89 | 0.40 | 143.4 | YSO | 0 0 1 1 | 2MASXJ13503488-6140199, (PMNJ1350-6141) |
| DZOA4655-11 | 2 | 13 50 41.8 | -61 35 09 | 309.92 | 0.48 | 151.6 | YSO | 0 0 0 1 | |
| DZOA4655-09555Very faint, it seems to show comparable features to DZOA4652-10 and DZOA4656-08 | 1 | 13 51 02.6 | -61 30 15 | 309.98 | 0.55 | 77.0 | … | 0 0 1 1 | 2MASXJ13510266-6130150 |
| DZOA4655-10 | 2 | 13 51 14.7 | -61 32 35 | 309.99 | 0.51 | 97.5 | … | 0 0 1 1 | |
| DZOA4656-08666An extremely bright point source in the -band, is also shows diffuse and clumpy extended emission and possible a dust lane in all bands. | 1 | 13 51 37.9 | -61 39 07 | 310.01 | 0.39 | 113.2 | … | 0 1 1 1 | |
| DZOA4656-06 | 1 | 13 51 59.8 | -61 15 41 | 310.15 | 0.76 | 60.5 | HII? | 0 0 0 1 | 2MASXJ13515956-6115394 |
| DZOA4657-05 | 2 | 13 52 37.3 | -62 19 00 | 309.97 | -0.28 | 55.8 | … | 0 0 1 1 | |
| DZOA4657-06 | 2 | 13 53 23.3 | -60 33 48 | 310.48 | 1.40 | 11.2 | PN | 1 1 1 1 | |
| DZOA4658-07 | 1 | 13 54 15.9: | -62 13 46: | 310.18 | -0.24 | 76.5 | RN | 1 1 1 1 | KK2000-60 |
| DZOA4661-02 | 2 | 13 58 13.8 | -58 54 31 | 311.48 | 2.85 | 4.4 | PN | 1 1 1 1 | |
| DZOA4661-05 | 1 | 13 58 23.9 | -61 21 45 | 310.87 | 0.47 | 57.1 | … | 0 0 0 1 | |
| DZOA4664-05 | 2 | 14 02 36.2 | -61 05 44 | 311.43 | 0.60 | 57.2 | HII? | 0 0 1 1 | 2MASXJ14023620-6105450 |
| DZOA4664-04 | 1 | 14 02 52.9 | -60 48 27 | 311.54 | 0.86 | 29.0 | … | 0 0 1 1 | |
| DZOA4664-06 | 1 | 14 02 52.9 | -62 07 22 | 311.18 | -0.40 | 93.6 | HII? | 0 0 0 1 | |
Separating Galactic objects from galaxies at high extinction levels can be confusing: Galactic nebulae, like galaxies, can be bright at longer wavelengths, either because of the large extinction or because of their intrinsically very red colours (e.g., young stellar objects). Most of them are found at very low latitudes and very high extinctions () and because of this are unlikely to be galaxies, but some were found at lower extinctions. We used similarities in form and colour in comparison with other Galactic objects and definite galaxies to classify cases at medium extinctions. In addition, a couple of Planetary Nebulae were found at low extinctions. These can be usually recognised by their sharp and sometimes irregular edges.
We have listed all objects believed to be Galactic in Table 3, and thumbnail images of them are shown in Appendix B. Columns 1 – 7 are as described in Table 2. The coordinates are either the estimated centre of the nebulosity or indicate the most prominent feature connected with it. Note that the extinctions given in Column 5 are total extinctions along the line-of-sight through our Galaxy, i.e., the actual extinction for a Galactic object can be anywhere between zero and the total extinction. Where possible, the classification in Column 6 indicates Planetary Nebulae (PN), reflection nebulae (RN), H II regions, and young stellar objects (YSO) which show one or several very red stars and some diffuse emission connected with it. The visibility in the -band in column 7 refers to the SSS777The SuperCOSMOS Sky Survey (Hambly et al. 2001)-blue images. Column 8 gives the name in the literature as found with NED888the NASA/IPAC Extragalactic Database: 2MASX stands for the 2MASS999see http://irsa.ipac.caltech.edu/Missions/2mass.html all-sky extended source catalogue (Two Micron All Sky Survey team, PMN for Parkes-MIT-NRAO Radio Survey (Griffith et al. 1994), AM for Arp & Madore (1987), and KK for Karachentseva & Karachentsev (2000).
7 Comparison with other catalogues
We have searched NED for known galaxies in our search area. Apart from 2MASS and WKK counterparts only few others had been observed before, most of them in the radio. They are all listed in Table 4. For quick reference we repeat the DENIS-ID (Col. 1), coordinates (Col. 2), extinction (Col. 3), class (Col. 4), and visibility (Col. 5) from the columns 1, 3, 5, 6, and 7 in Table 2, respectively. Column 6 gives the 2MASS-ID from the extended source catalogue (Two Micron All Sky Survey team, 2003); Col. 7 gives the WKK name and the last column gives other IDs from other catalogues. These are IRAS for the IRAS Point Source Catalog (IRAS PSC; Joint IRAS Science Working Group 1988), PMN for Parkes-MIT-NRAO Radio Survey (Griffith et al. 1994), HIZOA for Juraszek et al. (2000), HIZSS for the H I Parkes ZoA Shallow Survey (Henning et al. 2000), NW04 for Nagayama et al. (2004), PKS for the Parkes Catalog of radio sources (Wright & Otrupcek, 1990) 4U for the Fourth Uhuru Catalog of X-ray Sources (Forman et al. 1978), and 1XMM for the First XMM-Newton Serendipitous Source Catalogue (XMM-Newton Survey Science Centre, 2003).
| Ident. | R.A. (J2000) Dec. | Class | Visibil. | 2MASX | WKK | Other names | |||
|---|---|---|---|---|---|---|---|---|---|
| (1) | (2a) | (2b) | (3) | (4) | (5) | (6) | (7) | (8) | |
| DZOA4638-04 | 13 27 20.3 | -57 52 08 | 2.8 | DG | 0 1 1 1 | J13272018-5752081 | |||
| DZOA4638-09 | 13 27 25.1 | -58 20 28 | 2.6 | DG | 0 1 1 1 | J13272507-5820282 | |||
| DZOA4638-03 | 13 28 10.0 | -57 41 09 | 3.0 | DG | 0 1 1 1 | J13280986-5741102 | |||
| DZOA4638-11 | 13 28 10.3 | -60 22 59 | 5.0 | DG | 0 1 1 1 | J13281021-6022580 | |||
| DZOA4638-10 | 13 28 11.0 | -59 25 09 | 3.1 | DG | 0 1 1 0 | ||||
| DZOA4638-06 | 13 28 15.4 | -57 55 21 | 2.7 | DG | 0 1 1 1 | ||||
| DZOA4638-01 | 13 28 37.1 | -57 42 19 | 2.9 | DG | 1 1 1 1 | J13283697-5742188 | WKK 2267 | ||
| DZOA4639-07 | 13 28 44.4 | -58 03 32 | 2.8 | UG | 0 1 1 0 | ||||
| DZOA4639-06 | 13 28 49.7 | -58 03 21 | 2.7 | DG | 1 1 1 1 | J13284958-5803228 | WKK 2271 | ||
| DZOA4639-19 | 13 29 00.3 | -58 55 30 | 2.6 | BG | 1 1 1 0 | WKK 2274 | |||
| DZOA4639-02 | 13 29 01.7 | -57 37 32 | 3.0 | DG | 0 1 1 0 | ||||
| DZOA4639-14 | 13 29 10.4 | -59 42 27 | 4.1 | UG | 0 1 1 0 | ||||
| DZOA4639-01 | 13 29 14.7 | -57 37 06 | 3.1 | UG | 0 1 1 1 | ||||
| DZOA4639-03 | 13 29 16.1 | -57 39 56 | 2.9 | DG | 0 1 1 1 | J13291609-5739562 | |||
| DZOA4639-05 | 13 29 17.7 | -57 56 03 | 2.7 | DG | 1 1 1 1 | J13291753-5756032 | WKK 2278 | ||
| DZOA4639-10 | 13 29 25.8 | -59 07 11 | 2.6 | DG | 0 1 1 1 | ||||
| DZOA4639-09 | 13 29 33.2 | -58 50 54 | 3.0 | DG | 1 1 1 1 | J13293316-5850552 | WKK 2281 | ||
| DZOA4639-08 | 13 29 40.9 | -58 49 30 | 3.1 | DG | 0 1 1 1 | ||||
| DZOA4639-16 | 13 29 50.5 | -60 44 05 | 5.8 | UG | 0 1 1 1 | ||||
| DZOA4639-13 | 13 29 51.9 | -59 28 19 | 3.1 | DG | 1 1 1 1 | WKK 2285 | |||
| DZOA4640-05 | 13 30 13.4 | -59 08 34 | 3.1 | DG | 0 1 1 1 | ||||
| DZOA4640-03 | 13 30 34.6 | -58 29 24 | 3.4 | DG | 1 1 1 1 | J13303446-5829247 | WKK 2292 | ||
| DZOA4640-02 | 13 31 09.6 | -58 09 45 | 2.8 | DG | 0 1 1 1 | J13310962-5809453 | |||
| DZOA4641-01 | 13 31 33.3 | -57 50 04 | 2.7 | DG | 1 1 1 1 | J13313318-5750054 | WKK 2300 | ||
| DZOA4641-04 | 13 31 36.6 | -60 22 37 | 5.8 | UG | 0 0 1 1 | ||||
| DZOA4641-02 | 13 31 43.7 | -57 53 11 | 2.8 | DG | 1 1 1 1 | J13314368-5753125 | WKK 2303 | ||
| DZOA4641-06 | 13 32 03.3 | -63 05 06 | 38.5 | UG | 0 0 0 1 | ||||
| DZOA4642-04 | 13 33 11.8 | -58 49 22 | 4.0 | DG | 1 1 1 1 | WKK 2327 | |||
| DZOA4642-01 | 13 33 39.2 | -57 47 42 | 2.8 | DG | 1 1 1 1 | J13333914-5747422 | WKK 2334 | ||
| DZOA4642-06 | 13 33 47.6 | -59 03 07 | 3.9 | DG | 1 1 1 1 | WKK 2336 | |||
| DZOA4642-02 | 13 33 58.2 | -58 00 29 | 3.2 | DG | 1 1 1 1 | WKK 2338 | |||
| DZOA4644-04 | 13 35 26.0 | -59 14 38 | 4.1 | UG | 0 1 1 1 | ||||
| DZOA4644-02 | 13 35 30.1 | -57 53 47 | 3.4 | DG | 0 1 1 0 | ||||
| DZOA4644-01 | 13 36 08.1 | -57 37 48 | 2.7 | DG | 0 1 1 1 | ||||
| DZOA4645-01 | 13 37 05.0 | -58 02 40 | 3.1 | DG | 0 1 1 1 | ||||
| DZOA4645-14 | 13 37 15.2 | -57 37 11 | 2.7 | BG | 1 1 1 0 | WKK 2386 | |||
| DZOA4645-13 | 13 37 20.7 | -63 28 12 | 24.3 | UG | 0 0 1 1 | ||||
| DZOA4645-09 | 13 37 24.7 | -58 52 21 | 4.5 | DG | 1 1 1 1 | J13372458-5852216 | WKK 2390 | ||
| DZOA4645-04 | 13 37 31.9 | -58 08 01 | 3.1 | DG | 0 1 1 1 | ||||
| DZOA4645-08 | 13 37 32.8 | -58 50 04 | 4.5 | DG | 1 1 1 1 | J13373272-5850056 | WKK 2392 | ||
| DZOA4645-10 | 13 37 32.9 | -58 54 14 | 4.5 | DG | 0 1 1 1 | J13373282-5854136 | IRAS 13342-5830 PMN J1337-5854 | ||
| DZOA4645-03 | 13 37 44.1 | -58 06 37 | 3.0 | UG | 0 1 1 1 | ||||
| DZOA4645-05 | 13 37 44.3 | -58 13 26 | 3.5 | DG | 1 1 1 0 | WKK 2397 | |||
| DZOA4645-02 | 13 37 51.3 | -58 00 59 | 2.9 | DG | 0 1 1 0 | ||||
| DZOA4645-07 | 13 37 59.2 | -58 30 55 | 4.7 | DG | 0 1 1 1 | J13375912-5830556 | |||
| DZOA4646-01 | 13 38 03.3 | -58 14 27 | 3.5 | UG | 0 1 1 1 | ||||
| DZOA4646-03 | 13 38 08.5 | -58 45 19 | 4.1 | DG | 0 1 1 1 | J13380855-5845197 | |||
| DZOA4646-04 | 13 38 16.6 | -59 00 15 | 4.3 | DG | 0 1 1 1 | ||||
| DZOA4646-06 | 13 38 21.7 | -60 17 02 | 9.0 | DG | 0 1 1 1 | ||||
| DZOA4647-03 | 13 39 17.6 | -59 04 46 | 4.3 | UG | 0 1 1 1 | ||||
| DZOA4647-01 | 13 39 39.7 | -58 04 00 | 3.5 | DG | 0 1 1 1 | J13393970-5804007 | |||
| DZOA4647-02 | 13 39 52.7 | -57 42 17 | 2.6 | DG | 1 1 1 1 | WKK 2435 | |||
| DZOA4649-02 | 13 41 54.8 | -58 48 28 | 3.9 | DG | 0 1 1 1 | IRAS 13386-5832 HIZOA J1341-58 | |||
| DZOA4649-07 | 13 42 09.8 | -61 08 18 | 12.0 | DG | 0 0 1 1 | ||||
| DZOA4649-06 | 13 42 29.6 | -61 01 23 | 13.0 | DG | 0 0 1 1 | HIZSS 082 HIZOA J1342-61 | |||
| DZOA4649-03 | 13 42 35.6 | -59 33 18 | 6.7 | UG | 0 1 1 0 | ||||
| DZOA4649-01 | 13 42 59.9 | -57 39 06 | 2.5 | DG | 1 1 1 1 | WKK 2483 | |||
| DZOA4650-09 | 13 44 03.7 | -60 19 35 | 10.4 | DG | 0 1 1 1 | J13440358-6019350 | |||
| DZOA4650-01 | 13 44 36.5 | -58 13 10 | 3.9 | DG | 0 1 1 1 | ||||
| DZOA4651-05 | 13 45 00.2 | -59 22 17 | 6.2 | UG | 0 1 1 0 | ||||
| DZOA4651-02 | 13 45 17.7 | -58 12 01 | 3.5 | DG | 0 1 1 0 | ||||
| DZOA4651-08 | 13 45 25.3 | -60 29 14 | 11.9 | UG | 0 0 1 1 | NW04-03 | |||
| DZOA4651-06 | 13 45 50.7 | -60 09 05 | 8.2 | DG | 0 1 1 1 | J13455154-6009067 | NW04-08 | ||
| DZOA4652-01 | 13 46 40.3: | -57 39 50: | 2.3 | UG | 0 1 1 1 | ||||
| DZOA4652-04 | 13 46 48.9: | -60 24 29: | 12.3 | DG | 0 1 1 1 | J13464910-6024299 | NW04-24 PKS 1343-601 Centaurus B | ||
| DZOA4652-02 | 13 46 57.3: | -58 10 19: | 3.3 | DG | 0 1 1 0 | HIZOA J1347-58 | |||
| DZOA4653-09 | 13 47 18.5 | -60 34 13 | 12.2 | DG | 0 0 1 1 | J13471848-6034133 | NW04-38 | ||
| DZOA4653-03 | 13 47 32.3 | -58 47 45 | 3.8 | UG | 0 1 1 0 | ||||
| DZOA4653-11 | 13 47 36.2 | -60 37 04 | 12.0 | DG | 0 1 1 1 | NW04-45 4U 1344-60 1XMM J134736.1-603704 | |||
| DZOA4653-04 | 13 47 38.2 | -58 52 15 | 4.3 | UG | 0 1 1 0 | ||||
| DZOA4653-01 | 13 47 44.1 | -58 26 38 | 3.8 | UG | 0 1 1 1 | ||||
| DZOA4653-07 | 13 48 27.5 | -60 11 47 | 10.7 | DG | 0 1 1 1 | NW04-51 | |||
| DZOA4654-03 | 13 49 04.0 | -58 27 34 | 3.2 | UG | 0 1 1 1 | ||||
| DZOA4654-04 | 13 49 41.3 | -57 48 40 | 2.6 | NG | 1 1 0 0 | WKK 2559 | |||
| DZOA4654-02 | 13 49 46.1 | -58 13 04 | 2.6 | DG | 1 1 1 1 | J13494605-5813040 | WKK 2562 | ||
| DZOA4654-01 | 13 49 49.9 | -57 37 25 | 2.5 | DG | 1 1 1 0 | WKK 2564 | |||
| DZOA4655-01 | 13 50 21.3 | -58 17 12 | 2.9 | DG | 0 1 1 1 | J13502126-5817121 | |||
| DZOA4655-04 | 13 50 47.0 | -59 23 08 | 6.0 | DG | 0 1 1 1 | J13504691-5923083 | |||
| DZOA4655-07 | 13 50 51.8 | -57 43 02 | 2.6 | NG | 1 1 1 0 | WKK 2586 | |||
| Ident. | R.A. (J2000) Dec. | Class | Visibil. | 2MASX | WKK | Other names | |||
|---|---|---|---|---|---|---|---|---|---|
| (1) | (2a) | (2b) | (3) | (4) | (5) | (6) | (7) | (8) | |
| DZOA4655-03 | 13 50 55.3 | -59 08 29 | 4.1 | DG | 0 1 1 1 | ||||
| DZOA4655-02 | 13 50 56.5 | -58 27 46 | 3.5 | DG | 0 1 1 1 | ||||
| DZOA4655-08 | 13 51 03.5 | -57 47 15 | 2.6 | BG | 1 0 0 0 | WKK 2589 | |||
| DZOA4656-01 | 13 51 31.9 | -58 23 01 | 3.0 | DG | 0 1 1 1 | ||||
| DZOA4656-04 | 13 51 33.9 | -60 07 17 | 9.2 | UG | 0 1 1 1 | ||||
| DZOA4656-03 | 13 51 38.6 | -58 35 15 | 4.1 | DG | 1 1 1 1 | J13513848-5835153 | WKK 2596 | IRAS 13483-5820 HIZSS 084 HIZOA J1351-58 | |
| DZOA4656-02 | 13 51 39.8 | -58 26 48 | 3.2 | UG | 0 1 0 0 | ||||
| DZOA4657-03 | 13 52 55.4 | -58 09 59 | 2.3 | UG | 0 1 1 1 | ||||
| DZOA4657-04 | 13 53 08.7 | -58 12 59 | 2.4 | UG | 0 1 1 0 | ||||
| DZOA4657-02 | 13 53 32.4 | -57 49 30 | 2.7 | DG | 0 1 1 1 | ||||
| DZOA4657-01 | 13 53 34.1 | -57 49 10 | 2.7 | DG | 0 1 1 1 | J13533399-5749098 | |||
| DZOA4658-06 | 13 54 18.1: | -59 56 14: | 10.1 | UG | 0 1 1 0 | ||||
| DZOA4658-04 | 13 54 23.1: | -58 06 30: | 2.5 | DG | 0 1 1 1 | J13542319-5806299 | |||
| DZOA4658-03 | 13 54 27.3: | -58 07 35: | 2.6 | DG | 1 1 1 1 | J13542749-5807328 | WKK 2660 | ||
| DZOA4658-01 | 13 54 38.5: | -57 41 11: | 2.3 | DG | 1 1 1 0 | WKK 2669 | |||
| DZOA4658-05 | 13 54 39.5: | -58 31 07: | 3.4 | UG | 0 1 1 1 | ||||
| DZOA4659-13 | 13 55 18.4 | -58 05 32 | 2.8 | UG | 0 1 1 1 | ||||
| DZOA4659-11 | 13 55 29.0 | -57 38 59 | 2.4 | BG | 1 1 1 0 | WKK 2684 | |||
| DZOA4659-10 | 13 55 29.5 | -57 35 26 | 2.4 | BG | 1 1 1 0 | WKK 2686 | |||
| DZOA4659-01 | 13 55 43.5 | -57 48 38 | 2.9 | UG | 0 1 1 1 | J13554342-5748384 | |||
| DZOA4659-02 | 13 56 07.7 | -58 52 21 | 3.8 | UG | 0 1 1 1 | ||||
| DZOA4659-05 | 13 56 09.7 | -59 46 14 | 8.2 | UG | 0 1 1 1 | ||||
| DZOA4660-06 | 13 56 42.9 | -59 11 16 | 5.1 | NG | 1 1 1 1 | WKK 2708 | |||
| DZOA4660-02 | 13 56 52.3 | -57 51 53 | 2.5 | DG | 1 1 1 1 | WKK 2714 | |||
| DZOA4660-05 | 13 57 01.5 | -59 12 35 | 5.4 | DG | 0 1 1 1 | J13570135-5912362 | |||
| DZOA4660-03 | 13 57 06.7 | -58 02 43 | 2.9 | DG | 0 1 1 1 | ||||
| DZOA4660-01 | 13 57 08.2 | -57 44 09 | 2.6 | UG | 0 1 1 1 | ||||
| DZOA4660-04 | 13 57 46.6 | -58 07 01 | 3.0 | DG | 0 1 1 1 | J13574653-5807028 | |||
| DZOA4661-04 | 13 58 40.7 | -58 18 13 | 3.6 | NG | 1 1 1 0 | WKK 2755 | |||
| DZOA4661-03 | 13 58 52.6 | -59 45 47 | 8.9 | UG | 0 1 1 1 | ||||
| DZOA4661-01 | 13 58 57.0 | -58 46 02 | 4.3 | DG | 1 1 1 1 | J13585694-5846014 | WKK 2764 | ||
| DZOA4662-02 | 13 59 35.7: | -58 25 49: | 4.5 | UG | 0 1 1 1 | J13593587-5825489 | |||
| DZOA4662-03 | 14 00 01.9: | -58 29 06: | 4.8 | UG | 0 1 1 0 | ||||
| DZOA4662-01 | 14 00 04.0: | -57 50 02: | 2.7 | DG | 1 1 1 1 | WKK 2785 | |||
| DZOA4662-04 | 14 00 10.9: | -59 12 35: | 5.3 | UG | 0 1 1 0 | ||||
| DZOA4662-07 | 14 00 26.9: | -60 18 31: | 15.4 | UG | 0 0 1 1 | ||||
| DZOA4663-05 | 14 00 33.9 | -59 32 32 | 6.6 | DG | 0 1 1 1 | ||||
| DZOA4663-02 | 14 00 55.3 | -57 37 23 | 2.9 | DG | 0 1 1 0 | ||||
| DZOA4663-01 | 14 00 55.8 | -57 37 28 | 2.9 | DG | 0 1 1 0 | J14005571-5737279 | |||
| DZOA4663-04 | 14 01 25.6 | -58 37 37 | 4.4 | DG | 0 1 1 1 | ||||
| DZOA4663-03 | 14 01 35.4 | -58 32 22 | 4.3 | UG | 0 1 1 0 | ||||
| DZOA4664-03 | 14 02 42.0 | -57 44 08 | 3.3 | NG | 1 1 0 0 | WKK 2872 | |||
| DZOA4664-02 | 14 03 11.2 | -58 06 20 | 3.6 | DG | 0 1 1 1 | J14031094-5806201 | |||
| DZOA4665-02 | 14 03 13.8 | -58 07 13 | 3.6 | DG | 0 1 1 1 | J14031384-5807141 | |||
| DZOA4665-03 | 14 03 57.5 | -58 09 49 | 4.0 | UG | 0 1 1 1 | ||||
| DZOA4665-01 | 14 04 21.0 | -57 43 33 | 2.9 | DG | 0 1 1 1 | J14042102-5743339 | |||
| DZOA4666-01 | 14 05 35.9 | -59 32 19 | 8.5 | UG | 0 1 1 1 | ||||
7.1 -band
The WKK catalogue lists 35 galaxies within our search area. One galaxy (WKK2589, DZOA4655-08) is not visible on the DENIS images. It is a small, very low surface brightness galaxy, probably Sm or Irr. Five -band galaxies, all classified as uncertain galaxies by WKK, were identified as (blended) stars with the higher spatial resolution of the DENIS -band images (they are classified as NG in Table 2). Figure 5 shows the WKK galaxies as plus signs overlaid over the plot shown in Fig. 3.
As expected from Fig. 1 most -band galaxies are found in the low extinction regions. The highest extinction for a -band galaxy in the searched area is (DZOA4641-07, WKK2301). The completeness limit for and of the WKK-catalogue is (Woudt & Kraan-Korteweg 2001).
The -band magnitudes are isophotal and comparable to the magnitudes. To derive (Galactic) extinction-corrected colours , , and for our galaxies we have therefore used the total -, -, and -band Kron-magnitudes. Note that these are more uncertain than colours from a fixed aperture due to problems with star subtraction. In addition, at high extinctions it is necessary to correct the diameters as well as the magnitudes (Cameron 1990). However, the diameter correction for NIR data has not been investigated to date (cf. Sect. 5); hence, we have only applied a magnitude correction. Since the diameter correction affects mainly the disk we have not attempted to derive colours for the SL-types.
| Type | |||||||||
| mean | n | mean | n | mean | n | ||||
| This work (with Galactic extinction correction only): | |||||||||
| E | 2.31 | 0.01 | 2 | 3.60 | 0.20 | 2 | 4.40 | 0.03 | 2 |
| SE | 1.70 | 0.74 | 7 | 2.63 | 0.93 | 7 | 3.53 | 1.21 | 6 |
| SM | 1.70 | 0.71 | 9 | 2.82 | 0.84 | 8 | 3.93 | 0.80 | 6 |
| Girardi et al. 2003 (with full corrections): | |||||||||
| E+S0 | 3.83 | 0.03 | 145 | ||||||
| S0+SE | 3.79 | 0.03 | 157 | ||||||
| SM | 2.98 | 0.03 | 507 | ||||||
| Moriondo et al. 2001 (with full corrections): | |||||||||
| E | 2.40 | 1 | 2.86 | 0.47 | 3 | 3.80 | 0.46 | 3 | |
| SE | 1.81 | 0.28 | 4 | 2.53 | 0.20 | 8 | 3.50 | 0.36 | 8 |
| SM | 1.41 | 0.38 | 15 | 2.23 | 0.32 | 17 | 3.07 | 0.34 | 17 |
| Moriondo et al. 2001 (with Gal. extinction correction only): | |||||||||
| E | 2.40 | 1 | 2.87 | 0.48 | 3 | 3.81 | 0.47 | 3 | |
| SE | 2.06 | 0.33 | 4 | 2.81 | 0.29 | 8 | 3.81 | 0.34 | 8 |
| SM | 1.69 | 0.30 | 15 | 2.59 | 0.32 | 17 | 3.49 | 0.35 | 17 |
The mean corrected colours, the standard deviation and the number of galaxies are given in Table 5 along with respective values taken from Girardi et al. (2003; field and group galaxies) and from Moriondo et al. (2001; galaxies in the Pisces-Perseus cluster), where the latter two are corrected both for Galactic extinction as well as for internal absorption. Since Moriondo et al. give only NIR photometry we have extracted the two correction terms as well as the corrected - and -band data from the LEDA101010the Lyon-Meudon Extragalactic DAtabase, see http://leda.univ-lyon1.fr. database. Both samples agree very well for (), despite the large difference in the number of galaxies.
We have not attempted to correct our data for internal absorption since the inclinations as well as the morphological classifications are uncertain at these high foreground extinction levels. We have therefore turned this correction off for the Moriondo et al. sample (see last entry in Table 5) to better compare it with our sample. The colours agree reasonably well within the errors, except for the sample of elliptical galaxies where only a couple of galaxies contribute to the mean value: the standard deviation for the two ellipticals in our sample is very small and they are clearly not representative.
The colours of our SM-sample are nominally redder than the colours of our SE-sample. On the other hand, the standard deviations of the two subsamples are at least twice as large as the ones for the Moriondo et al. samples. Obviously, this effect is partly due to the large uncertainties in morphological types of our sample. In addition, while for large samples the statistical mean is little affected by the (unknown) individual inclination-dependent corrections, small samples may be highly biased, and the statistical means as well as the scatter may vary widely solely due to a different distribution in inclinations.
Consequently, we can only say that the colours of these two (small) subsamples appear to be similar. For example, if we include the colours of one galaxy found south of our search area (WKK2503 at and ) to the SM-sample, we find instead of 1.70, instead of 2.82, and instead of 3.93, which agrees much better with the Moriondo et al. colours.
Furthermore, Monnier Regaigne et al. (2003) quote for a predominantly early-type sample and colours as blue as for infrared low surface brightness galaxies (while they corrected the -band data for Galactic extinction and internal absorption, the corrections for the -band data were assumed to be negligible). These values denote the large range of () colours that can be found for galaxies in general, which implies in turn that small subsamples are sensitive to any uncertainties in morphological types.
7.2 2MASS - and -band comparison
We have extracted all objects from the 2MASS all-sky extended source catalogue (Two Micron All Sky Survey team, 2003) within the region RA and Dec . There are 65 objects, 11 of which are just outside the searched DENIS area. Figure 6 shows the distribution of the extended 2MASS objects (diamonds) together with their extraction region with a dashed line.
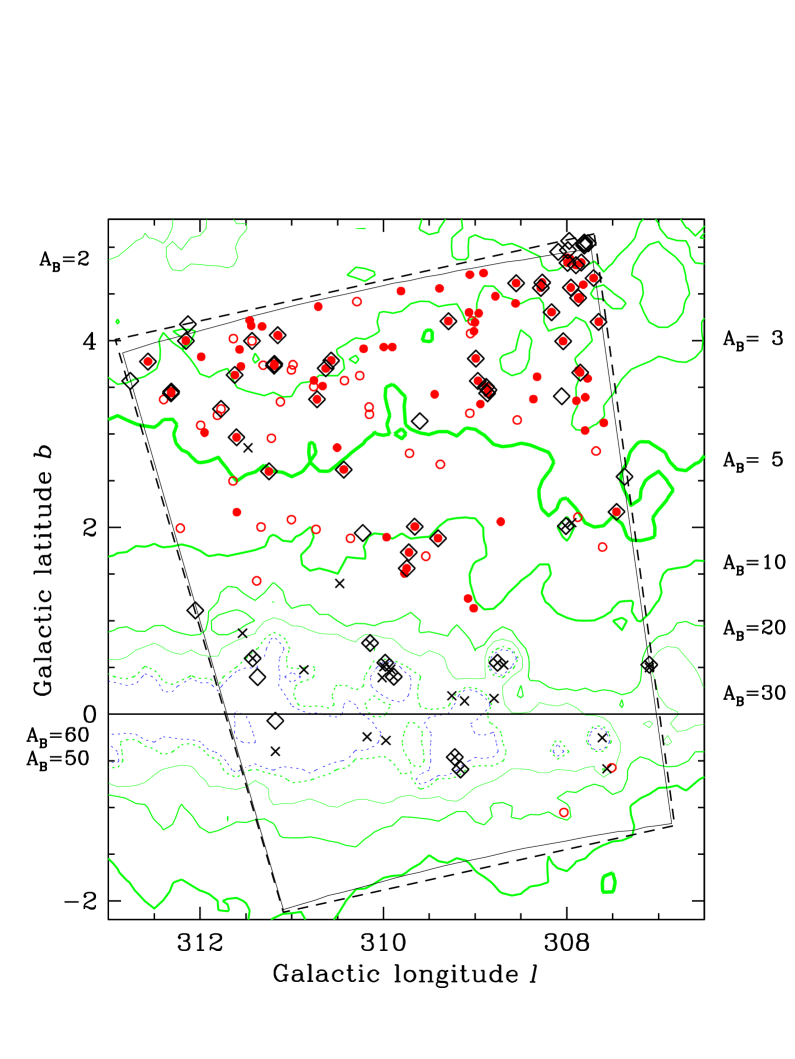
Forty nine objects are common in both data sets, and five 2MASS objects were not found with DENIS. Of the 49 objects in common, 9 are classified by us as Galactic objects, and two as an uncertain galaxy. Of the five 2MASS objects that were not found in the DENIS search, visual inspection of DENIS images indicates that two are at very high extinctions: one is very probably a Galactic object, while the other seems to be a small star very close to a bright star (this can also be seen on the 2MASS -band image). The third object is probably a faint double star with a very small spatial separation (it is slightly elongated but does not appear to be diffuse on the 2MASS images), while the last two are very small but bright galaxies that were not recognised as such in the DENIS search.
Of the 45 DENIS galaxies that were not in the 2MASS extended source catalogue most will be detected in the 2MASS point source catalogue, except for a few late type galaxies that are too faint in and and could only be found through the DENIS -band.
This gives a rough estimate of the reliability of 80% for the automatic 2MASS extraction for galaxies in this highly confused and obscured region, while the completeness of the 2MASS galaxy extraction in this area is slightly less than 50%.

We compare the - and -band magnitudes of the 2MASS galaxies with our magnitudes in Fig. 7. The upper panel shows the differences in the -band with a mean of and a standard deviation of . In the -band (middle panel) the mean of the differences is with a standard deviation of , which indicates that there is a substantial offset between the two catalogues in the -band. This offset can be explained by the large difference in magnitude limits of the two surveys: the sensitivity limit for extended sources with 2MASS are and for and , respectively (Jarrett et al. 2000a), while the much deeper extraction limit for extended sources with DENIS are only and , respectively (Mamon 1998, 2000). Note, though, that these limits refer to high Galactic latitudes only. If we use the 2MASS isophotal -band magnitudes (at per square arcsecond) instead, the mean of the differences is only with a standard deviation of (bottom panel).
We find a similar difference between the 2MASS major diameter at the -band -per-square-arcsecond isophote and the DENIS major diameter that we have derived with ds9 at the -band -per-square-arcsecond isophote in such a way that the 2MASS diameters are systematically larger, as expected given that their isophote is 2 magnitudes fainter. Hence, the 2MASS total magnitudes are indeed expected to be brighter than those we derive. In particular, we find
where the diameters are given in arcseconds. The rms difference is .
Using the 2MASS isophotal -band the change in offset is negligible (the mean is now with ; not shown) as expected by the smaller difference in limiting magnitudes. This means, that the DENIS -band photometry is very close to the isophotal magnitude at per square arcsecond.
7.3 -band
Nagayama et al. (2004) have obtained deep -band images of an area of around PKS 1343 – 601. Figure 8 shows this area as a dashed rectangle overlaid on Fig. 3. The plot does not show the detections by Nagayama et al. since the spatial density of these detections is very high due to the much deeper imaging. All six DENIS galaxies in this region (including one uncertain candidate) have been detected by them as well.
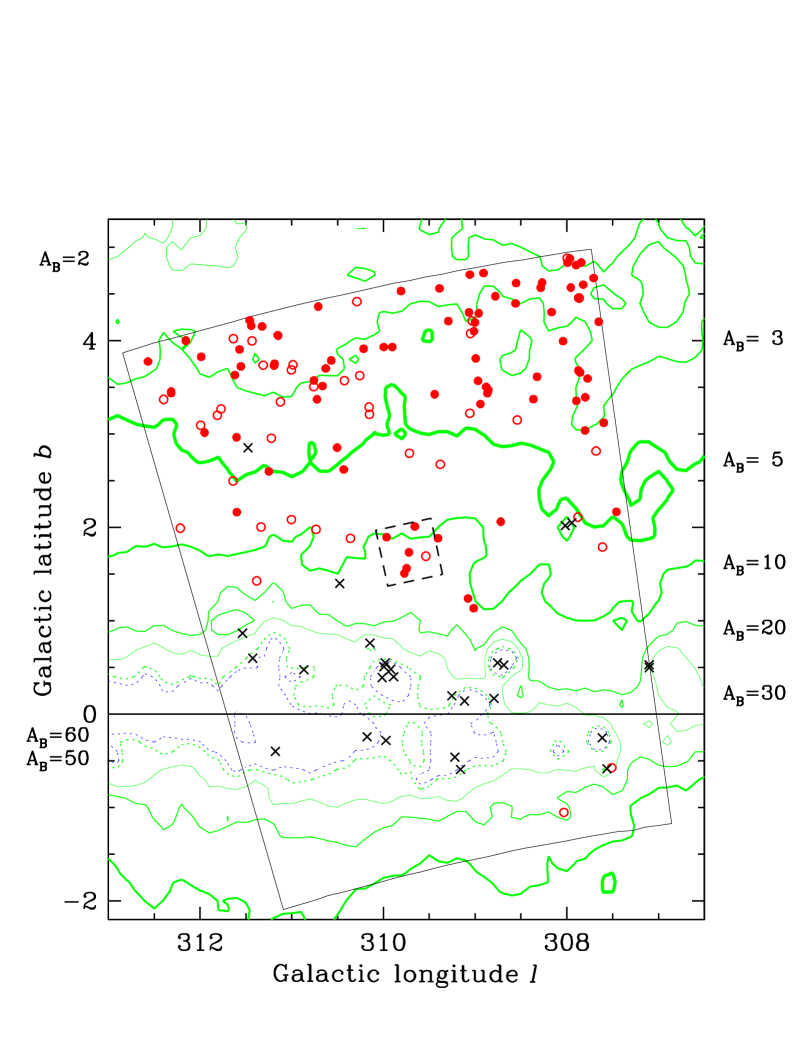
Comparing the -band photometry of these 6 objects we find an offset of with a standard deviation of ; excluding one outlier at the offset is reduced to with a standard deviation of . The large offset is mainly due to the fact that Nagayama et al. derive isophotal magnitudes at a surface brightness of per square arcsec (cf. previous section). In fact, their -band photometry agrees well with the 2MASS magnitudes.
7.4 21 cm wavelength
A complementary way to find galaxies in the Galactic plane is through blind H I surveys, which have two major advantages: (i) the H I emission of the interstellar gas in galaxies is not affected by Galactic extinction; and (ii) the H I observation usually produces an accurate radial velocity. On the other hand, H I surveys miss elliptical and many lenticular galaxies, and at low Galactic latitude H I-faint galaxies may be missed due to the increased noise caused by strong Galactic continuum sources.
The blind H I Parkes ZoA survey, conducted with the multibeam receiver on the Parkes telescope (Staveley-Smith et al. 2000), surveyed the entire southern ZoA (, ) in the velocity range to 12 700 km s-1 with an integration time of 25 minutes. We have extracted detections from two sub-surveys: (i) The shallow H I ZoA survey (hereafter HIZSS; Henning et al. 2000) comprises 8% of the integration time of the full survey and has a sensitivity of 15 mJy beam-1 after Hanning smoothing. (ii) Juraszek et al. (2000; hereafter JS00) have studied the area of the GA () at 16% of the integration time of the full survey with a sensitivity of 20 mJy beam-1 before Hanning smoothing. The theoretical sensitivity after Hanning smoothing ( mJy beam-1) is only marginally better than the one of the shallow survey despite the increase in integration time since the sensitivity depends on the longitude (continuum sources cause ripples in the H I spectra), and the GA region lies closer to the Galactic centre than the average field in the shallow survey.
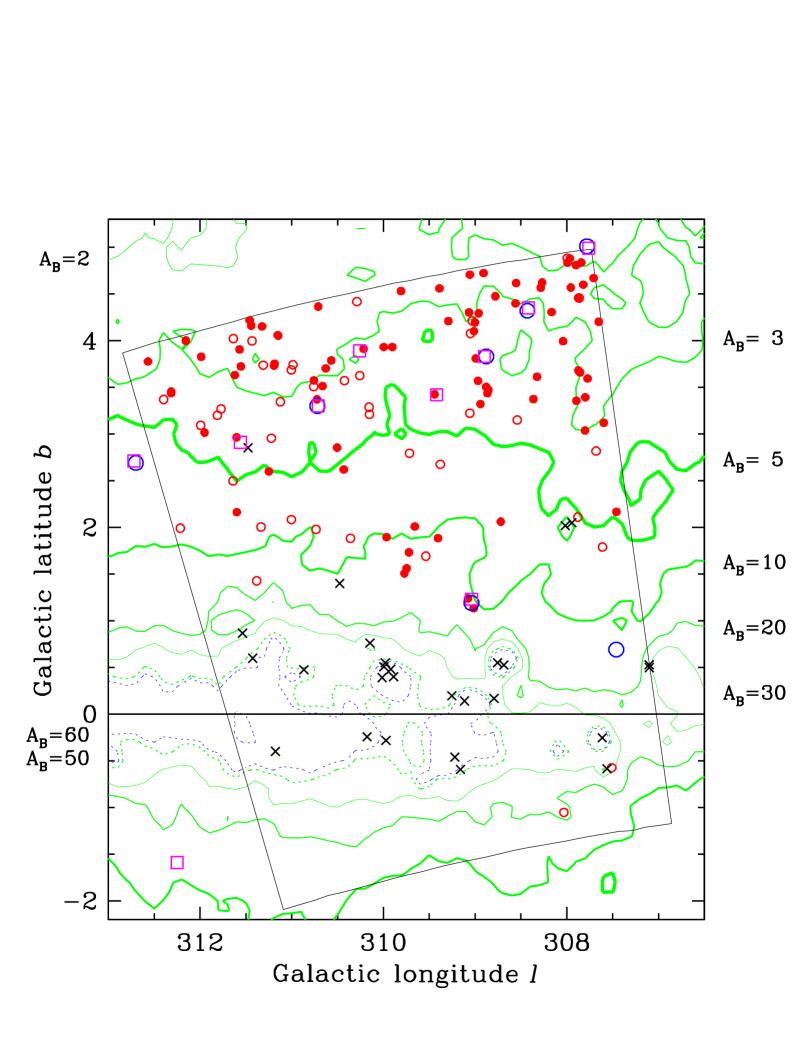
There are 12 detections in total in the DENIS search area. They are shown in Fig. 9, where large open circles stand for the HIZSS survey and large open squares for JS00. Note that the position uncertainty is about 4 arcmin. Four galaxies were detected in common by the two surveys, and one HIZSS galaxy at , was not detected by JS00 but appears in the full deep survey. Of the eight H I galaxies, four were detected with the DENIS survey, while the other four are neither visible in the blue nor in the NIR.
A discussion of the velocity distribution is given in Schröder et al. (2005) and Paper II.
8 Extinction and NIR colours
Colours of nearby galaxies, unaffected by k- and evolutionary corrections, are independent of distance. Hence, NIR colours can be used as an independent means to derive extinctions in low latitude areas where the IRAS/DIRBE maps of Schlegel et al. (1998) are not properly calibrated. For our analysis we have applied the extinction correction according to the IRAS/DIRBE maps to all colours and look for dependencies in the residuals.
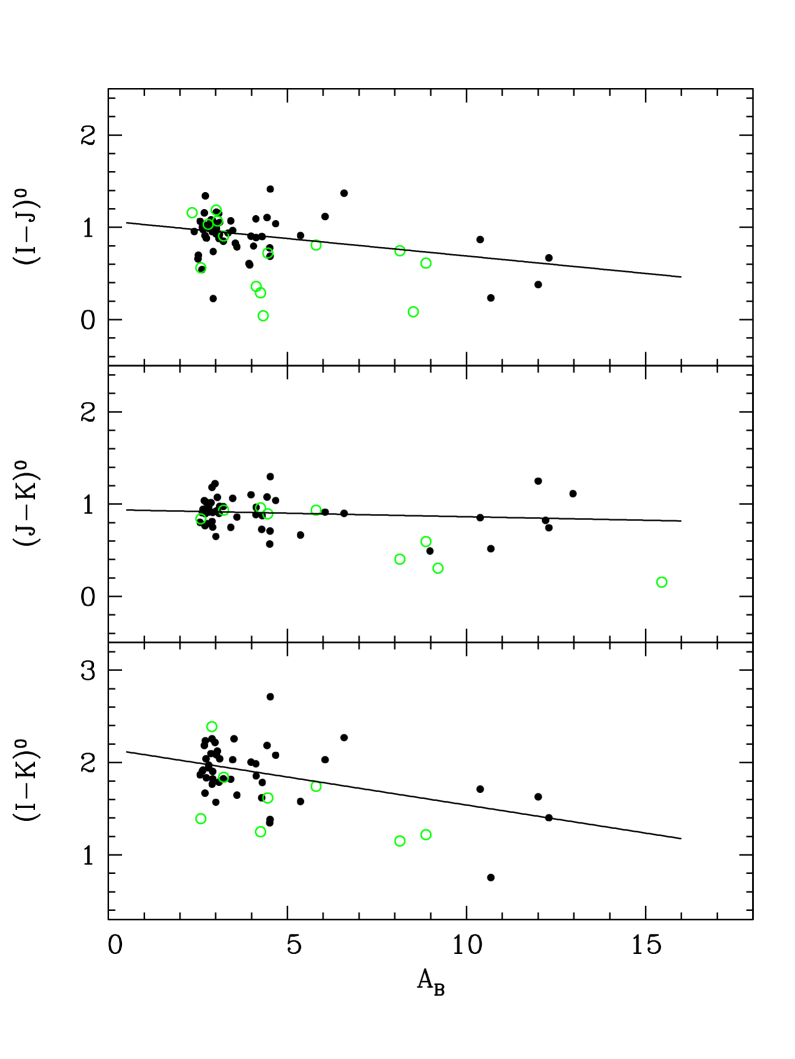
Figure 10 shows the results (filled circles are galaxies, open circles uncertain candidates): galaxies at higher extinctions are clearly too blue, i.e., the extinctions of the IRAS/DIRBE maps are overestimated at low galactic latitudes. The least squares fits to the filled circles (i.e., excluding the uncertain candidates) give:
| (2) | |||||
| (3) | |||||
| (4) |
where the rms deviations of the data points from the best fit line are , 0.18, and 0.28, respectively. A Spearman Rank test indicates probabilities of 0.11, 0.21, and 04 that the slopes of the fits in ij, , and , 0.occur by chance, respectively.
For a generic colour , eqs [2 – 4] can be written as
| (5) |
the reddening equation is simply
| (6) |
and the true extinction-corrected colour is
| (7) |
Combining eqs. [5], [6], and [7], one gets
| (8) |
If the opacity is overestimated by some constant factor, that is, if the extinction, , is overestimated by some constant additive term, there would be no slope in Fig. 10, i.e., for to be independent of in equation (8).
We therefore now assume that the true extinction is a constant times the IRAS/DIRBE value of Schlegel et al.:
| (9) |
and that the selective extinctions in the DENIS bands given in eqs [1] are exact (we use tilde signs for ‘true’ quantities). Equation (8) becomes
| (10) |
So for the extinction-corrected colour to be independent of , and hence (from eq. [9]), the quantity in brackets in eq. [10] must be zero, yielding
| (11) |
With the selective extinctions of eqs [1] and the coefficients from eqs [2 – 4], eq. [11] yields using , using , and using . Combining the first two, independent, estimates of (see, e.g., appendix A of Sanchis et al. 2004), we conclude that
| (12) |
i.e., in this area of the Galactic plane, the true reddening appears to be 13% lower than the IRAS/DIRBE estimate of Schlegel et al.
8.1 Caveats
With a sample like the present one, where the uncertainties are large, it is important to understand the possible biases and different explanations for the effect seen. In the following we address the most important caveats.
8.1.1 Patchiness
One of the problems with attempting to calibrate the extinctions in the Galactic plane is the relatively poor spatial resolution of of the IRAS/DIRBE maps, which misses extinction variations on smaller angular scales. As a consequence it is possible that we miss galaxies in the high-extinction patches and therefore underestimate the overall true extinction.
We have tested this by restricting our least squares fit to the points below , assuming that we find all galaxies around and that the variations in are not very large (this is confirmed by the fact that no considerable changes in star counts in the -band are apparent at these extinction levels). The least squares fits to our data of Fig. 10, restricted to , now show considerably larger variations and errors:
| (13) | |||||
| (14) | |||||
| (15) |
where the rms deviations of the data points from the best fit line are similar to the fit to the full range in extinction, namely , 0.16, and 0.26, respectively. The resulting corrections for the extinction are now (eq. [11]): using , using , and using . Combining the first two (independent) estimates of , which are, however, not consistent anymore, we find
| (16) |
Therefore, the IRAS/DIRBE extinctions of Schlegel et al. are consistent with the NIR colours of the galaxies of our sample, restricted to .
The major drawback of this method is that our restricted sample has only very few galaxies above and none below , hence, the range in extinctions is too small to provide meaningful fits. With a larger sample one could also compare the scatter in colour at low and at high extinctions: the scatter in colour at any given extinction is expected to be inflated by the uncertainty in the extinction correction; in other words, the extinctions would have considerably large error bars. A galaxy in a higher extinction patch would be redder than expected, and if we start missing galaxies at the highest extinctions it means we are biased towards the blue. We would therefore expect the scatter in colour to decrease at the high extinction end because we would miss more and more of the red galaxies and hence be biased towards the blue as the fits indicate.
We could test this on a different project, the search for NIR counterparts of galaxies found in a blind H I survey (Schröder et al. 2005). This sample covers the extinction range with better statistics, and we do not find such a decrease in scatter. In fact, the dependence on extinction found in this project confirms our first result (eq. [12]), i.e.,
| (17) |
A comparison of the estimates of for the colour gives more consistent results (the sample of galaxies here is slightly different and comprises only of galaxies with measurements in all three passbands): from eq. [4], and from Schröder et al. (2005). The estimate of from the low extinction sample, i.e., (eq. [15]), agrees within the errors.
We are therefore confident that the variation of the extinction on a small scale (the x-axis error) at these levels is small and does not affect our fit significantly.
8.1.2 Morphological segregation
Rich clusters usually show a morphological segregation: one finds predominantly early-type (red) galaxies in the centre and late-type (blue) galaxies in the outskirts of a cluster.
To investigate this we have plotted the colours corrected for extinction according to the IRAS/DIRBE maps as a function of distance to PKS 1343 – 601 in degrees (Figure 11; filled circles are galaxies, open circles uncertain candidates), assuming that PKS 1343 – 601 is at or very near the centre of the cluster.
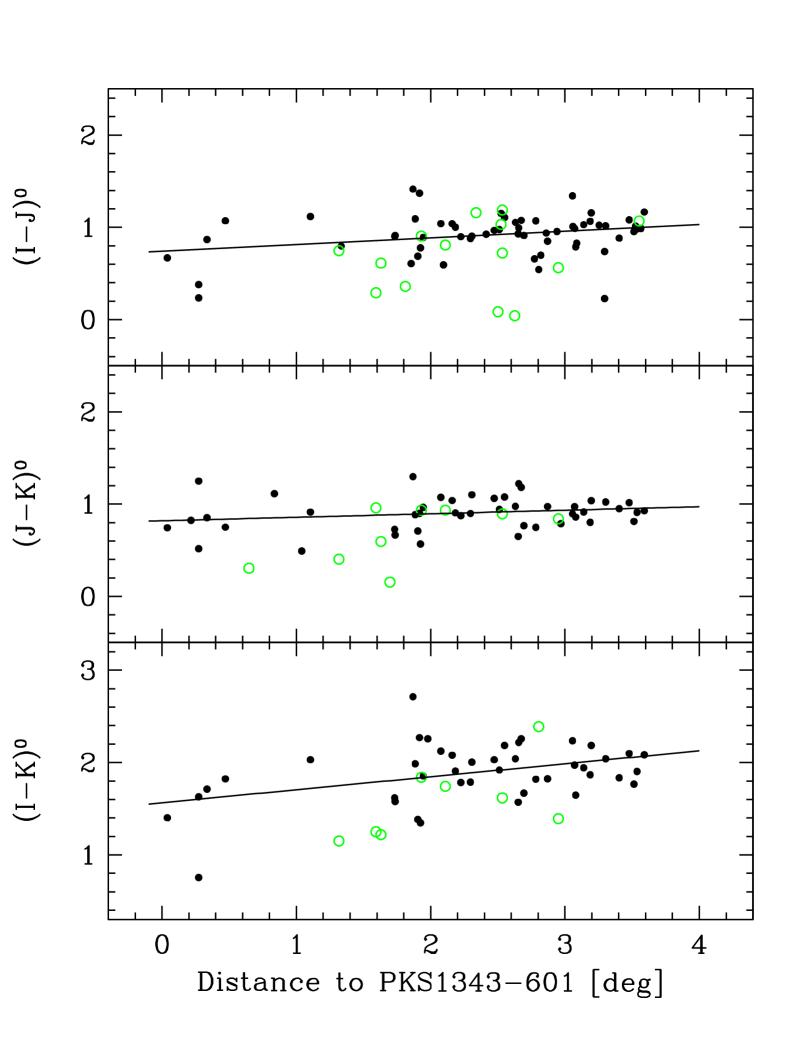
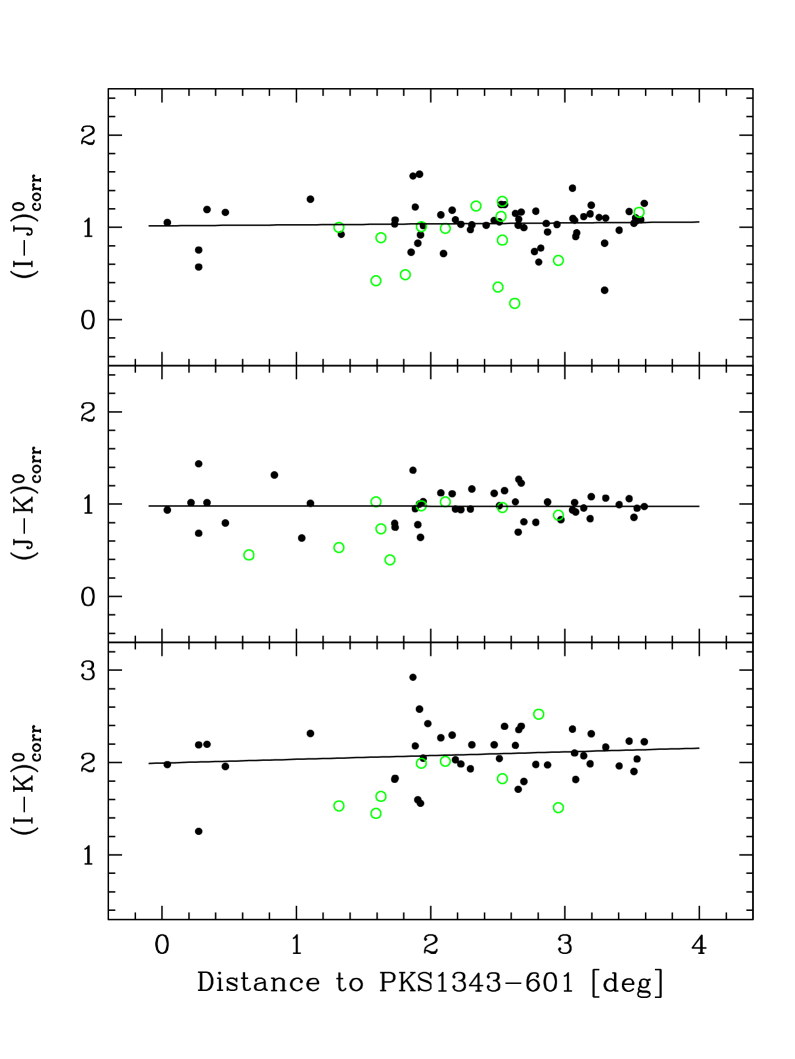
Contrary to the expectation we find that the galaxies close to PKS 1343 – 601 are clearly bluer than those at a larger distance. However, since the cluster seems to be much smaller than expected (see Paper II where we derive a virial radius of ), we do not expect to see any colour change due to morphological segragation much beyond that. In fact, if we exclude the inner from the fit we do not find any significant dependence on distance anymore. On the other hand, we cannot achieve a proper fit using only the six galaxies within the inner since the scatter is too large. We therefore cannot determine whether we see a colour change due to morphological segregation.
To explain why the inner six galaxies are bluer than the rest we refer to Fig. 3 which shows that these galaxies are all located at the highest extinction levels where we still find galaxies. In other words, Fig. 11 shows only the extinction effect seen in Fig. 10 in a slightly different form. To demonstrate this, we have corrected the colours for the extinction as determined in eq. [12], and Fig. 12 with the corrected colours shows no further dependence on extinction, i.e., the slopes are now consistent with zero. No difference can be seen between the galaxies within the virial radius and the rest, and we conclude that any possible effect of morphological segregation does not affect our fit significantly.
8.1.3 Survey magnitude limits
The limiting magnitude of the DENIS survey depends on the passband, see Sect. 2. As a consequence we will start losing red and faint galaxies when the observed (extincted) colour approaches the difference between the limiting magnitudes. We therefore expect a bias towards blue galaxies at higher extinctions, exactly as we see in Fig. 10.
To test how large is this effect (since only the faint galaxies are affected) we have performed a series of Monte Carlo simulations of a sample of galaxies subjected to different extinctions: The galaxy magnitudes were selected from a Euclidean galaxy count function (cf. Fig. 1) using the magnitude limits for galaxies given in Sect. 2; the (intrinsic) colour distribution was assumed to be uniform around a mean of and for ij and , respectively, with a half-width of and , respectively. The galaxy positions were taken from a uniform distribution of galactic latitudes, and extinctions were derived by a cubic spline fit between observed latitudes and extinctions. The resulting extinction corrected colours were then plotted versus extinction to imitate Fig. 10 and a slope was fitted.
One of the simulations is shown in Fig. 13, which is given in the same format as Fig. 10: the colour distributions are indicated by the shaded regions, and the sloped dashed lines show the (observed) colour at the magnitude limits (that is, above these lines we lose faint galaxies). It is quite obvious that the line in ij intersects the galaxy colours already at extinctions of . It is therefore not possible to simply avoid this bias by restricting the fit to the lower extinction ranges.
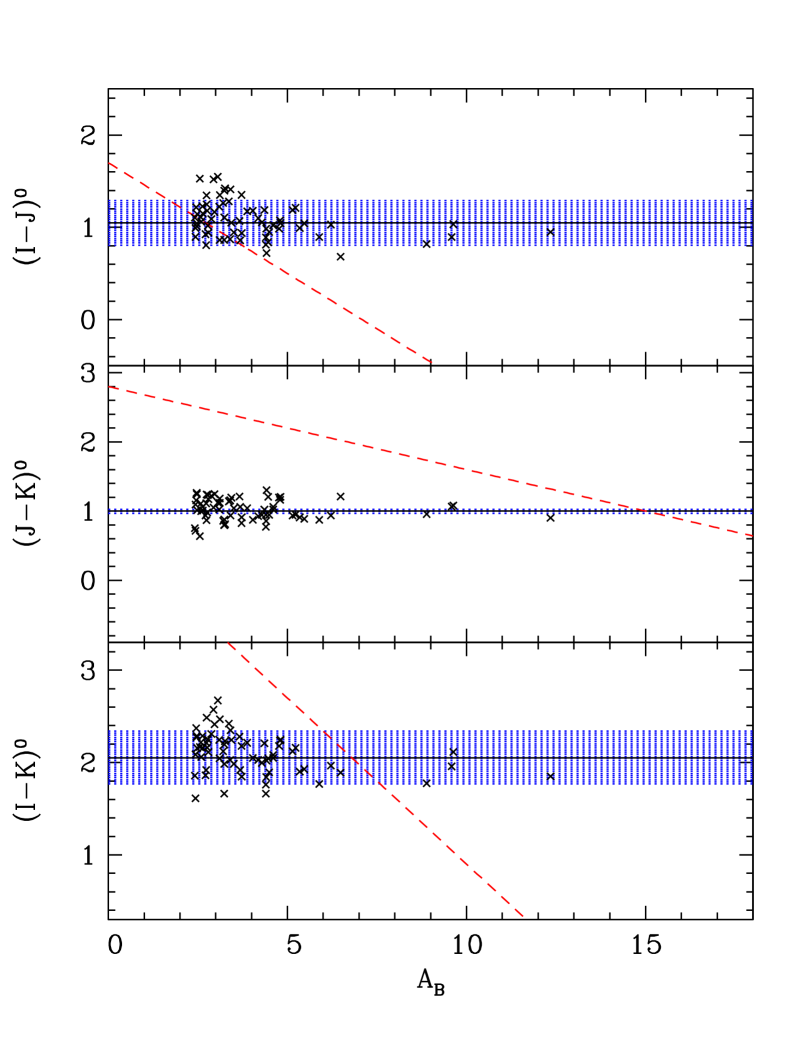
For 1000 simulations (using 5000 galaxies each as input which resulted in a similar number of galaxies ‘detected’ as in reality) we find that a slope of (, and ) as observed in Fig. 10 is observed only 0.3% (2.6%, and 0.1%) of the time by chance for ij (, and ), respectively, assuming that the Schlegel et al. extinctions are correct. Hence, we can say that the overestimate of extinction by Schlegel et al. that we find is statistically significant.
We have also investigated how sensitive these results are to a deviation in the intrinsic NIR colours: Though the mean colour of is fairly well established from the 2MASS survey (e.g., Jarrett et al. 2003), variations can be found, depending on the precise selective transmission of the telescope optics, filter and detector. We extracted the DENIS catalogue of LEDA galaxies (Paturel et al. 2005) where the mean colours for galaxies (type G) with are and for and , respecitively. For comparison, Mamon et al. (1998) find and , respecitively, for bright high latitude DENIS galaxies, while our galaxy sample, after correction for the effect seen in Fig. 10, gives and , respecitively (eqs [2] and [3]).
For slightly redder colours ( and , respecitively), the simulations show that 0.1%, 3.0%, and 0.0% of the slopes are more negative, and for a slightly bluer colour set ( and , respecitively), they give 0.3%, 3.0%, and 0.0% of the slopes more negative than observed in Fig. 10. Therefore, the uncertainty in intrinsic colour does not have a large affect on the slopes.
In addition, we also tested the magnitude completeness limits as derived from the catalogue by Paturel et al., namely , , for the -, -, and -bands, respectively. Using the first colour set ( and , respecitively) we find a slightly higher percentage of the simulations, namely 1.1%, 3.5%, and 0.5%, resulted in slopes more negative than the ones given in eqs [2 – 4].
Hence, we conclude that despite uncertainties in the mean intrinsic colours as well as in the exact magnitude completeness limits, the simulations show that the overestimate of extinction by Schlegel et al. that we find is statistically significant given the magnitude selection effects.
8.2 Discussion
We have shown that in our search area the extinction estimates of the DIRBE/IRAS maps by Schlegel et al. (1998) are slightly overestimated, which cannot be fully explained by (i) patchiness of the extincting material in the sky, (ii) morphological segregation within the assumed cluster, or (iii) selection effects at the magnitudes limits of the survey.
While the fractional error in the reddening estimates of the DIRBE/IRAS maps is 16% (Schlegel et al.), we find a systematic overestimation of (), thus fairly large in comparison with the DIRBE/IRAS uncertainty on a single point. When comparing reddening values derived from Mg2 indices of a large sample of elliptical galaxies, Schlegel et al. find that the highest reddening values of their maps appear to be overestimated. Inspecting their Figure 6 we can say that a slope of according to our findings is compatible with their data. It has to be stressed, though, that the sparsity of points at in their figure makes it difficult to estimate a slope at all. Schlegel et al. state clearly (in their Appendix C) that their predicted reddenings at low Galactic latitudes () are not to be trusted because of (i) the possibility that contaminating sources may exist (our search area is such a case though no such sources have been found by us), and (ii) a calibration at higher extinctions was not attempted.
Since then, various attempts have been made to calibrate the DIRBE/IRAS maps at different latitudes and using different objects and methods. Most of these find that the DIRBE/IRAS maps are overestimated at low latitudes.
Nagayama et al. (2004), who have also searched for galaxies in this cluster (see Sect. 7.3), have determined extinction values using colours of foreground giant stars. They find that the extinction in the -band, , is systematically lower by than the DIRBE/IRAS values. This corresponds to a factor of for the average extinction in this area. Their extinction map shows a higher spatial resolution than the DIRBE/IRAS maps, and one can see that the variation of their extinction along a line of equal extinction in the DIRBE/IRAS maps is only moderate (). This indicates that the intrinsic patchiness in this area does not lead to large variations in extinction on a small spatial scale and hence has not caused us to predominantly miss galaxies in supposedly very high extinction patches (see Sect. 8.1.1).
Dutra et al. (2003b) have derived reddening values from the spectral continuum in the optical of elliptical galaxies in three different areas of the sky. In combination with previous work by this group (Dutra et al. 2003a), where they used bulge giants within 10 degrees of the Galactic centre to derive an extinction map, they find a calibration factor of for reddening values of up to ().
Choloniewski & Valentijn (2003b) used the surface brightness of galaxies in the ESO-LV catalogue (Lauberts & Valentijn 1989) in the - and -band (Choloniewski & Valentijn 2003a) and find a calibration factor of .
Other work in the literature include Arce & Goodman (1999), who find for reddening in the Taurus dark cloud complex, and Schröder et al. 2005 with , as discussed in Sect. 8.1.1. On the other hand, Fingerhut et al. 2003 find a much higher extinction in the direction of Maffei 1, which translates to . However, this is a single object and seems to be the exception.
We can therefore conclude that our calibration factor of derived from a fairly high extinction area () is in reasonable agreement with the results of other investigations () at various extinction levels in the sense that the DIRBE/IRAS maps overestimate the extinction at low Galactic latitudes where they are uncalibrated.
We have shown that there is no obvious evidence that we predominately find galaxies in low extinction patches in the investigated range of extinctions, but better statistics are needed to completely solve this question. One possible way would be to use galaxies at moderate extinction levels (where we can be sure to go reasonably deep to find all galaxies in the NIR) in an area of high spatial density of galaxies, e.g., the Norma cluster in the centre of the GA region, to look for a strong spatial variation in the reddening estimates by other means. One could also investigate larger areas by comparing shallow surveys with deeper ones, e.g., using the UKIDSS (Warren, 2006) and VISTA (McPherson, Craig, & Sutherland 2003) projects, to determine whether the fainter ‘new’ galaxies in the deeper surveys show all significantly larger reddening values. In fact, the comparison of our ‘shallow’ search with the deeper search by Nagayama (2004) already indicates that a strong spatial variation cannot be the only explanation: the shallow survey finds actually a higher absolute extinction than the deeper one, contrary to the argument for patchiness.
However, independent of the cause, a calibration factor of about applied to the DIRBE/IRAS maps will improve significantly the actual extinction correction for galaxies at low latitudes.
9 Conclusion
We have investigated a square-degree area around the radio-bright galaxy PKS 1343 – 601 using the NIR survey DENIS. We have found 83 galaxies and 39 possible candidates. The searched area covers a large range of extinctions (from to over where the search area crosses the Galactic plane). The galaxy counts reflect the dependence on extinction, as qualitatively shown in Fig. 1 (i.e., the effect is less pronounced for the longer wavelengths), as well as the underlying large-scale structures: there is a clear enhancement of galaxies around the radio galaxy, indicating that there is a cluster or at least a group of galaxies.
Our detections compare well with those of the 2MASS survey: while we find more galaxies at intermediate extinctions due to the -band, which is more sensitive to late-type spiral galaxies than the - and -bands, 2MASS goes deeper in the -band. However, our search is more reliable, since the 2MASS extended source catalogue is derived automatically and includes without distinction both galaxies and exenteded objects in our Galaxy.
Using the NIR galaxy colours from the aperture, we find that the extinction derived from the IRAS/DIRBE maps (Schlegel et al. 1998) is overestimated by about 15%, that is, the ratio of true extinction as derived using NIR colours to IRAS/DIRBE extinction is . Other findings in the literature confirm this result.
We investigated several possible explanations: (i) patchiness of obscuring material which results in finding galaxies only in areas of below-average extinction, (ii) morphological segregation within the dense system of galaxies around PKS 1343– 601, and (iii) selection effects at the magnitudes limits of the survey. None of these affect the here presented galaxy colours on a statistical significant level. We therefore conclude that the paucity of calibration of the IRAS/DIRBE at low latitudes is the major cause of the overestimate.
The second paper of this series (Schröder & Mamon 2006) will discuss the question whether PKS 1343 – 601 is part of a cluster or a mere group of galaxies, making use of the galaxy distribution, velocity distribution and X-ray emission.
Acknowledgements.
The authors are grateful to the DENIS teams in Chile and at PDAC for all the efforts in observing and reducing the data, in particular J. Borsenberger, G. Simon, P. Textier for preferential treatment of DENIS data needed for this project. We thank Ch. Motch for making unpublished data available to us. The DENIS project has been partly funded by the SCIENCE and the HCM plans of the European Commission under grants CT920791 and CT940627. It is supported by INSU, MEN and CNRS in France, by the State of Baden-Württemberg in Germany, by DGICYT in Spain, by CNR in Italy, by FFwFBWF in Austria, by FAPESP in Brazil, by OTKA grants F–4239 and F–013990 in Hungary, and by the ESO C&EE grant A–04–046. This research has made use of the NASA/IPAC Infrared Science Archive (2MASS) and the NASA/IPAC Extragalactic Database (NED), which are operated by the Jet Propulsion Laboratory, California Institute of Technology, under contract with the National Aeronautics and Space Administration, as well as the Lyon-Meudon Extragalactic Database (LEDA), supplied by the LEDA team at the Centre de Recherche Astronomique de Lyon, Obs. de Lyon. Furthermore, this research has also made use of the Digitized Sky Surveys (produced at the Space Telescope Science Institute under U.S. Government grant NAG W-2166) and the SuperCOSMOS Sky Surveys (produced by the Wide Field Astronomy Unit at the University of Edinburgh). A. Schröder gratefully acknowledges financial support from the European Marie Curie Fellowship Grant.References
- (1) Abell, G.O. 1958, ApJS 3, 211
- (2) Arce, H.G., Goodman, A.A. 1999, ApJ 512, L135
- (3) Arp H.C., Madore B.F. 1987, A Catalog of Southern Peculiar Galaxies and Associations, (Cambridge: Cambridge University Press)
- (4) Bertin, E., Arnouts, S. 1996, A&AS 117, 393
- (5) Borsenberger, J. 1997, in The Impact of Large-Scale Near-IR Sky Surveys, ed. F. Garzón, N. Epchtein, A. Omont, B. Burton, P. Persi (Dordrecht: Kluwer), 181
- (6) Cameron L.M. 1990, A&A 233, 16
- (7) Cardelli J.A., Clayton G.C., Mathis J.S. 1989, ApJ 345, 245
- (8) Choloniewski, J., Valentijn, E.A. 2003a, Acta Astronomica 53, 249
- (9) Choloniewski, J., Valentijn, E.A. 2003b, Acta Astronomica 53, 265
- (10) Dekel, A. 1994, ARA&A 32, 371
- (11) Dutra, C.M., Santiago, B.X., Bica, E.L.D., Barbuy, B. 2003a, MNRAS 338, 253
- (12) Dutra, C.M., Ahumada, A.V., Clariá, J.J., Bica, E., Barbuy, B. 2003b, A&A 408, 287
- (13) Ebeling, H., Mullis, C.R., Tully, R.B. 2002, ApJ 580, 774
- (14) Elvis, M., Wilkes, B.J., McDowell, J. C., et al. 1994, ApJSS 95, 1
- (15) Epchtein, N. 1997, in The Impact of Large Scale Near-IR Surveys, ed. F. Garzón, N. Epchtein, A. Omont, B. Burton, P. Persi (Dordrecht: Kluwer), 15
- (16) Epchtein, N. 1998, in 179th Symposium of the IAU, New Horizons from Multi-Wavelength Sky Surveys, eds. B.J. McLean, D.A. Golombek, J.J.E. Hayes, H.E. Payne, (Dordrecht: Kluwer), 106
- (17) Epchtein, N., Batz, B. de, Capoani, L., et al. 1997, Messenger, 87, 27
- (18) Fairall, A.P. , Woudt, P.A. (eds) 2005, Nearby Large-Scale Structures & the Zone of Avoidance, ASP Conf. Ser. 329 (San Francisco: ASP)
- (19) Fingerhut, R.L., McCall, M.L., De Robertis, M., Kingsburgh, R.L., Komljenovic, M., Lee, H., Buta, R.J. 2003, ApJ 587, 672
- (20) Forman W., Jones C., Cominsky L., Julien P., Murray S., Peters G., Tananbaum H., Giacconi R. 1978, ApJS 38, 357
- (21) Gandhi, P., Fabian, A.C. 2003, MNRAS 339, 1095
- (22) Gardner, J.P., Sharples, R.M., Carrasco, B.E., Frenk, C.S. 1996, MNRAS 282, L1
- (23) Girardi, M., Mardirossian, F., Marinoni, C., Mezzetti, M., Rigoni, E. 2003 A&A 410, 461
- (24) Griffith, M.R., Wright, A.E., Burke, B.F., Ekers, R.D. 1994, ApJS 90, 179
- (25) Hambly, N.C., MacGillivray, H.T., Read, M.A., Tritton, S.B., Thomson, E.B., Kelly, B.D., Morgan, D.H., Smith, R.E., Driver, S.P., Williamson, J., Parker, Q.A., Hawkins, M.R.S., Williams, P.M., Lawrence, A. 2001, MNRAS 326, 1279
- (26) Henning P.A., Staveley-Smith L., Ekers R.D., Green A.J., Haynes R.F., Juraszek S., Kesteven M.J., Koribalski B., Kraan-Korteweg R.C., Price R.M., Sadler E.M., Schröder A. 2000, AJ 119, 2686 (HIZSS)
- (27) Henning P.A., Kraan-Korteweg, R.C., Staveley-Smith L. 2005, in Nearby Large-Scale Structures and the Zone of Avoidance, ASP Conf. Ser. (ASP: San Francisco), 199
- (28) Jarrett, T.-H., Chester, T., Cutri, R., Schneider, S., Skrutskie, M., Huchra, J.P. 2000a, AJ 119, 2498
- (29) Jarrett, T.-H., Chester, T., Cutri, R., Schneider, S., Rosenberg, J., Huchra, J.P., Mader, J. 2000b, AJ 120, 298
- (30) Jarrett, T.-H., Chester, T., Cutri, R., Schneider, S., Huchra, J.P. 2003, AJ 125, 525
- (31) Joint IRAS Science Working Group 1988, IRAS Point Source Catalog, Version 2 (Washington: US Govt. Printing Office) (IRAS PSC)
- (32) Jones, P.A., Lloyd, B.D., McAdam, W.B. 2001 MNRAS 325, 817
- (33) Joye, W.A., Mandel, E. 2003, in Astronomical Data Analysis Software and Systems XII, eds. H.E. Payne, R.I. Jedrzejewski, R.N. Hook, ASP Conf. Ser. 295, (San Francisco: ASP), 489
- (34) Juraszek S.J., Staveley-Smith L., Kraan-Korteweg R.C., Green, A.J., Ekers, R.D., Haynes, R.F., Henning, P.A., Kesteven, M.J., Koribalski, B., Price, R.M., Sadler, E.M., Schröder, A. 2000, AJ 119, 1627 (JS00)
- (35) Karachentseva V.E., Karachentsev I.D. 2000, A&AS 146, 359
- (36) Kolatt, T., Dekel, A., Lahav, O. 1995, MNRAS 275, 797
- (37) Kraan-Korteweg, R.C. 2000, A&ASS 141, 123
- (38) Kraan-Korteweg, R.C. 2005, in From Cosmological Structures to the Milky Way, Rev. Modern Astronomy 18, ed. S. Röser, (New York: Wiley), 48
- (39) Kraan-Korteweg, R.C., Woudt, P.A., Cayatte, V., Fairall, A.P., Balkowksi, C., Henning, P.A. 1996, Nature 379, 51
- (40) Kraan-Korteweg, R.C., Schröder, A., Mamon, G.A., Ruphy, S. 1998, in 3rd Euroconference, The Impact of Near IR Surveys, eds. N. Epchtein, (Dordrecht: Kluwer), 209
- (41) Kraan-Korteweg, R.C., Woudt, P.A. 1999, PASA 16, 53
- (42) Kraan-Korteweg R.C., Lahav, O. 2000, A&ARv 10, 211
- (43) Kraan-Korteweg R.C., Jarrett, T.H. 2005, in Nearby Large-Scale Structures and the Zone of Avoidance, ASP Conf. Ser. (ASP: San Francisco), 119
- (44) Kraan-Korteweg, R.C., Ochoa, M., Woudt, P., Andernach, H. 2005a, in Nearby Large-Scale Structures and the Zone of Avoidance, ASP Conf. Ser. (ASP: San Francisco), 159
- (45) Kraan-Korteweg, R.C., Staveley-Smith, L., Donley, J., Koribalski, B., Henning, P.A. 2005b, in IAU Symposium 216, Maps of the Cosmos, eds. M. Colless, and L. Staveley-Smith, ASP Conf. Ser. (ASP: San Francisco), 203
- (46) Lauberts A., and Valentijn E.A. 1989, The Surface Photometry Catalogue of the ESO-Uppsala Galaxies, (Garching: ESO)
- (47) Lynden-Bell, D., Faber, S.M., Burstein, D., Davies, R.L., Dressler, A., Terlevich, R.J., Wegner, G. 1988, ApJ 326, 19L
- (48) Mamon G.A. 1994, in Unveiling Large-Scale Structures Behind the Milky Way, eds. C. Balkowski, R.C. Kraan-Korteweg, ASP Conf. Ser. 67 (San Francisco: ASP), 53
- (49) Mamon, G.A. 1998, in XIVth IAP Astrophysics Meeting, Wide Field Surveys in Cosmology, eds. S. Colombi, Y. Mellier, B. Raban, (Gif-sur-Yvette: Editions Frontières), 323
- (50) Mamon, G.A., Borsenberger, J., Tricottet, M., Banchet, V. 1998, in 3rd Euroconference, The Impact of Near IR Surveys, eds. N. Epchtein, (Dordrecht: Kluwer), 177
- (51) Mamon, G.A. 2000, in Cosmic Flows 1999: Towards an Understanding of Large-Scale Structure, eds. S. Courteau, M.A. Strauss J.A. Willick, ASP Conf. Ser. 201 (San Francisco: ASP), 103
- (52) Mamon, G.A., Parker, Q.A., Proust, D. 2001, PASA 18, 232
- (53) Masetti, N., Pretorius, M.L., Palazzi, E., et al. 2006, A&A in press
- (54) McAdam, W.B. 1991 PASA 9, 255
- (55) McPherson, A.M., Craig, S.C., Sutherland, W. 2003, Large Ground-based Telescopes, eds. J.M. Oschmann, L.M. Stepp, Proceedings of the SPIE, Volume 4837, 82
- (56) Michel, L., Herent, O., Motch, C., et al. 2004, in Astronomical Data Analysis Software and Systems (ADASS) XIII, eds. F. Ochsenbein, M.G. Allen, and D. Egret, ASP Conf. Ser. 314 (San Francisco: ASP), 570
- (57) Monnier Regaigne, D., van Driel, W., Schneider, S.E., Jarrett, T.H., Balkowski, C. 2003 A&A 405, 99
- (58) Moriondo, G., Baffa, C., Casertano, S., Chincarini, G., Gavazzi, G., Giovanardi, C., Hunt, L.K., Pierini, D., Sperandio, M., Trinchieri, G. 2001 A&A 370, 881
- (59) Motch, C., Herent, O., Guillot, P. 2003, Astr. Nachr. 324, 61
- (60) Nagayama, T., Woudt, P.A., Nagashima, C., Nakajimia, Y., Kato, D., Kurita, M., Nagata, T., Nakaya, H., Tamura, M., Sugitani, K., Wakamatsu, K., Sato, S. 2004, MNRAS 354, 980
- (61) Paturel, G., Petit, C., Rousseau, J., Vauglin, I. 2003, A&A 405, 1
- (62) Paturel, G., Vauglin, I., Petit, C., Borsenberger, J., Epchtein, N., Fouqu , P., Mamon, G. 2005, A&A 430, 751
- (63) Piconcelli, E., Sánchez-Portal, M., Guainazzi, M., Martocchia, A., Motch, C., Schröder, A.C., Bianchi, S., Jiménez-Bailon, E., Matt, G. 2006, A&A (in press)
- (64) Rembold, S.B., Pastoriza, M.G., Ducati, J.R., Rubio, M., Roth, M. 2002, A&A 391, 531
- (65) Rousseau, J., Paturel, G., Vauglin, I., Schröder, A., de Batz, B., Borsenberger, J., Epchtein, N., Fouqué, P., Kimeswenger, S., Lacombe, F., Le Bertre, T., Mamon, G., Rouan, D., Simon, G., Tiphène, D. 2000, A&A 363, 62
- (66) Sanchis, T., Mamon, G.A., Salvador-Solé, E., Solanes, J.M. 2004, A&A 418, 393
- (67) Schlegel, D.J., Finkbeiner D.P., Davis M. 1998, ApJ 500, 525
- (68) Schröder, A., Kraan-Korteweg, R.C., Mamon, G.A., Ruphy, S. 1997, in XVIIth Moriond Astrophysics Meeting, Extragalactic Astronomy in the Infrared, eds. G.A. Mamon, Trinh Xuân Thuân, and J. Trân Thanh Vân (Gif-sur-Yvette: Frontières), 381
- (69) Schröder, A., Kraan-Korteweg, R.C., Mamon, G. 1999, PASA 16, 42
- (70) Schröder, A., Kraan-Korteweg, R.C., Mamon, G. 2000, in Mapping the Hidden Universe: The Universe behind the Milky Way – The Universe in HI, ASP Conf. Ser. 218 (San Francisco: ASP), 119
- (71) Schröder, A., Mamon, G., Kraan-Korteweg, R.C., Woudt, P.A. 2005, in Nearby Large-Scale Structures & the Zone of Avoidance, eds. A.P. Fairall, P.A. Woudt, ASP Conf. Ser. 329 (San Francisco: ASP), 167
- (72) Schröder, A., Mamon, G. 2006, to be submitted to A&A (Paper II)
- (73) Skrutskie, M.F., Cutri, R.M., Stiening, R. et al. 2006, AJ 131, 116
- (74) Staveley-Smith, L., Koribalski, B.S., Stewart, I., Putman, M.E., Kilborn, V.A., Webster, R.L. 2000, in Imaging at Radio through Submillimetre Wavelengths, eds. J.G. Mangum, S.J.E. Radford, ASP Conf. Ser. 217 (San Francisco: ASP), 50
- (75) Tashiro, M., Kaneda, H., Makishima, K., Iyomoto, N., Idesawa, E., Ishisaki, Y., Kotani, T., Takahashi, T., Yamashita, A. 1998, ApJ 499, 713
- (76) Two Micron All Sky Survey team 2003, 2MASS extended objects. Final release. vol.p.
- (77) Vauglin, I., Paturel, G., Borsenberger, J., Fouqué, P., Epchtein, N., Kimeswenger, S., Tipène, D., Lanoix, P., Courtois, H. 1999, A&AS 135, 133
- (78) Warren, S. 2006, in IAU Symposium 216, Maps of the Cosmos, eds. M. Colless, L. Staveley-Smith, R.A. Stathakis, ASP Conf.S̃er. (ASP: San Francisco), in press
- (79) Watson, M.G., Auguéres, J.-L., Ballet, J. et al. 2001, A&A 365, L51
- (80) West, R.M., Tarenghi, M. 1989, A&A 223, 61
- (81) Woudt P.A., Kraan-Korteweg, R.C., 2001, A&A 380, 441 (WKK)
- (82) Woudt P.A., Fairall, A.P., Kraan-Korteweg, R.C., Lucey, J., Schröder, A.C., Burstein, D., McCall, M.L. 2005, in Nearby Large-Scale Structures and the Zone of Avoidance, eds. A.P. Fairall, P.A. Woudt, ASP Conf. Ser. 329 (ASP: San Francisco), 147
- (83) Wright, A., Otrupcek, R., 1990, Parkes Catalog, Australia telescope national facility
- (84) XMM-Newton Survey Science Centre (SSC) 2003: The First XMM-Newton Serendipitous Source Catalogue, Version 1 (1XMM)
Appendix A Photometry
We have tested the quality of the photometry by matching all objects extracted by SExtractor in the overlap regions between (a) images within one slot (overlap in DEC), (b) images of adjacent slots (overlap in RA), and (c) re-observations of the same slot (overlap of the whole images). Figure 14 shows a sketch of these overlap regions in exaggerated form. The matching was done automatically and was only possible for observations where high quality astrometry was available (see Col. 10 in Table 1). For each pair of strips we have then plotted the differences in the total magnitudes as well as in the 7″-aperture magnitudes for the matched objects versus magnitude, time, RA, and DEC (the latter two depend on the kind of overlap regions) to look for systematic dependences.

In the following we will discuss the results in detail. A summary of the global effects of photometric and seeing conditions on the photometry of each strip is given in Table 1.
-
•
We used the magnitude differences of matched objects in the RA overlap regions, plotted versus time (i.e., scan direction), to look for variation in atmospheric extinction. These can be distinguished from normal scatter by the fact that they occur in all three passbands with the same amplitude. Abrupt changes as small as mag were immediately obvious (e.g., strip 9426), while other strips showed a constant significant offset over the whole range of images (about 12 minutes observing time), e.g., strip 3823.
-
•
Bad seeing conditions can also show rapid variations of the magnitude difference versus time, but in this case the 7″-aperture magnitudes are much more strongly affected than the total magnitudes, and there are marked differences between the passbands (e.g., strip 9461).
-
•
In the -band a small number of points show an offset of from the mean for the following strips: 7659, 9426, 3625, 7747, 6371, 7462, 7532, 7484, 3976. A simple check on the images showed that the affected objects were scattered among the ‘normal’ objects in the overlap region. There seems to be a dependence on RA in such a way that the left quarter to half of the image is not affected. No dependence on DEC across the image could be found. No apparent reason for such deviations could be found.
-
•
Small but negligible variations in the magnitude differences due to the pattern of the CCDs that make the image could be found both in RA and DEC.
-
•
Occasionally an increased scatter for the very brightest objects was found, mainly due to saturation.
-
•
Small offsets of the mean magnitude difference in the DEC overlap regions within a strip indicate a slight gradient across an image.
-
•
For strips between 6000 and 7800 the -band shows a marked lack of points in the RA overlap region in two places: just to the right of the middle of the image, and in the right-hand corner. This was due to the lack of detections by SExtractor around black areas in the CCDs.
A total recalibration of all the observations in the survey is planned by PDAC which will remove most of the intrinsic effects that we have noticed.
Appendix B Images of Galactic objects
Thumbnail images of the Galactic nebulae, presented and discussed in Sect. 6.2, are displayed in Figure 15. There are two objects per row, each with the -, -, and -band image shown from left to right; the name is printed on top and the total -band extinction and Galactic coordinates at the bottom of the images. The - and -band images have been smoothed, and the cut values have been calculated separately for each image in dependence of the background.