NGC 3310 and Its Tidal Debris: Remnants of Galaxy Evolution
Abstract
NGC 3310 is a local galaxy with an intense, ongoing starburst thought to result from a merger with a companion galaxy. It has several known tidal features in the northwest and southern regions around the main galactic disc, as well as a closed, tidal loop emerging from the eastern side of the disc and rejoining in the north. This loop appears to be distinct from the rest of the shells surrounding NGC 3310 and is the first of its kind to be detected in a starburst galaxy. In this work, we present photometry to faint surface brightness levels of this debris network, and we explore various strategies for modelling NGC 3310’s disc and subtracting its contribution from each region of debris. We then compare these photometric results with the GALEV spectral synthesis models, and find possible material from the intruder galaxy, suggesting that the recent accretion of several small galaxies is driving the evolution of NGC 3310.
keywords:
galaxies: interactions — galaxies: starburst — galaxies: photometry — galaxies: evolution1 Introduction
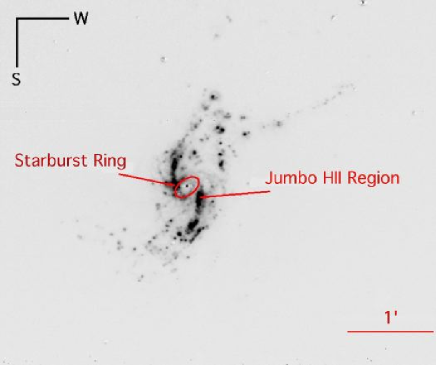
NGC 3310 is a nearby disc galaxy undergoing an intense starburst. This system is particularly intriguing because it is a field galaxy which displays signs of a recent and complex merging history. At a distance of about 14 Mpc ( km s-1 Mpc-1) and with a radial extent of 16 Kpc, including its most far-flung stellar debris, this relatively small galaxy is a system in turmoil. It has an HI mass of , an estimated total mass of (Kregel & Sancisi, 2001) and a global star formation rate of 8.5 M⊙ yr-1, most of which is occurring in a starburst ring surrounding the nucleus. There are also many star forming regions throughout the disc, as well as young star clusters which de Grijs et al. (2003a) find to be approximately 40 Myr old. This current starburst is undoubtedly largely responsible for the galaxy’s blue global colour of (de Vaucouleurs et al., 1991). As the light from this galaxy is dominated by young stars, separating the contributions of the starburst and the underlying disc to the overall colour of NGC 3310 is difficult.
There is much evidence that NGC 3310 has recently undergone at least one significant merger. This idea was first proposed by Balick & Heckman (1981), who suggested that a dwarf galaxy collided with NGC 3310 and that the famous “arrow” on the western side consisted of the remains of the interloper. In addition to the visible optical debris, such as numerous shell-like features and the “bow and arrow” (Walker & Chincarini, 1967), the radial surface brightness profiles of NGC 3310 were found to follow an law, which has been interpreted by Smith et al. (1996) as evidence that the main disc has been disturbed by a recent merger. Furthermore, while the nucleus has almost solar metallicity, the disc is substantially more metal poor (Heckman & Balick, 1980; Puxley, Hawardan, & Mountain, 1990; Pastoriza et al., 1993). Because of this discrepancy, it has been suggested (see de Grijs et al. (2003a) for a discussion) that NGC 3310 collided with a gas rich, metal-poor companion galaxy. Another possibility, given the low metallicity of the disc, is that this galaxy is in the process of forming a new stellar disc.
Work by Kregel & Sancisi (2001) suggests that the arrow feature is not a distinct kinematic element, but rather the beginning of an extended HI tail which is found in the velocity range of km/s. When this tail is considered in conjunction with the Southern HI tail, the total mass of the interloper approaches almost 10 per cent of the galaxy’s total mass. In Wehner & Gallagher (2005) (hereafter Paper I), we announced the discovery of an additional arc of stellar debris. This arc is the first closed stellar loop found in a starburst galaxy, and its location does not coincide with the gaseous, tidal tails. With a total stellar mass of this large loop supports the idea that NGC 3310 underwent a larger merger than previously thought. The possibility also remains that NGC 3310 suffered numerous small collisions, rather than one large merger.
There are several ways to further explore the merging history of this galaxy. In Paper I we defined photometric regions, and in this work we continue our study of them. Our goal is to explore the origins of these debris features and to determine whether they are shell-like structures created by stars pulled from NGC 3310’s own disc, as in the weak interaction model of shell formation (Thomson & Wright, 1990), or whether they represent the remains of another galactic companion. We then can use this information to gain insight into how the merger(s) may have progressed. In § 2, we present photometry for all previously defined regions of debris. We discuss the significance of this debris network’s photometric colours and use several different methods to compare them to the colours of NGC 3310’s underlying disc. We explore disc modelling strategies for this disturbed galaxy, and present these results in § 3. In § 4, we use spectral synthesis models to further identify the star formation histories contained in the debris regions themselves and compare this to the current ideas of the star formation history of the main disc. In § 5, we then discuss the consequences of these results for the merging history of NGC 3310.
2 Observations and Data Reduction
2.1 Broad-band Imaging
For this study we make use of data from both the WIYN 3.5m111The WIYN Observatory is a joint facility of the University of Wisconsin–Madison, Indiana University, Yale University, and the National Optical Astronomy Observatory. and the WIYN 0.9m telescopes. The reductions for the WIYN 0.9m data, taken on the nights of 2003 March 7-11, are described in Paper I. The WIYN 3.5m data were taken with the MiniMosaic CCD camera on the night of 2004 April 20, under photometric conditions. For each night, numerous Landolt standard fields were observed in order to obtain photometric solutions. While a range in airmass was covered for all 0.9m data, standards were only taken at the WIYN 3.5m at the beginning and the end of the night. Thus, we used the standard extinction coefficients for Kitt Peak and solved only for the colour terms in our data.
The MiniMosaic data were reduced using both IRAF222IRAF is distributed by the National Optical Astronomy Observatories, which are operated by the Association of Universities for Research in Astronomy, Inc., under cooperative agreement with the National Science Foundation. and MIDAS333Munich Image Data Analysis System, provided by the European Southern Observatory (ESO).. In IRAF, the MSCRED package was used to perform the overscan correction, which was done on a line by line basis for these data. It was also used to create the average bias and dome flat frames and for the final bias subtraction and flat division. The two separate chips of the WIYN 3.5 MiniMosaic CCD Camera were then combined into a single image with the MSCIMAGE task, which remaps the two chips onto a single coordinate system. Once the two chips were merged, the multiple exposures of NGC 3310 were combined with imcombine and bad pixel masks were used to remove the gap left from the separate mosaic chips.
2.2 H Images
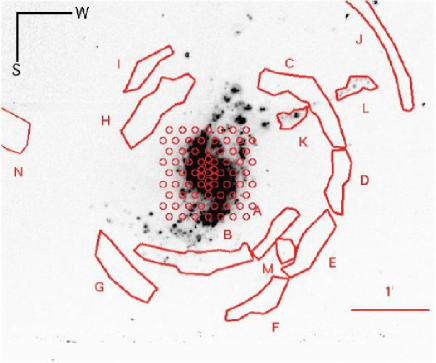
The H images of NGC 3310 were obtained on the night of April 7, 2003, using the WIYN 3.5m telescope under photometric conditions with seeing of . The images were processed in the manner described above before the final H image was created. The variable seeing throughout the night led to a small difference in the FWHMs between the broad and narrow-band data. The FWHM of the H image was approximately 1.1 pixels, or 0.16″, larger than that of the -band image. To account for this, we used PSFMATCH to convolve the R-band data with a Gaussian to broaden the FWHM profile, while still conserving the total flux. We then calculated the flux-ratio for stars surrounding the galaxy in the narrow and broadband data, scaled the R-band down accordingly and subtracted it from the H. This effectively removed the continuum from the H image and as a result, removed most of the stars.
This final image can be seen in Fig. 1. The regions of interest defined in Paper I and the SparsePak fibre configuration have been overlaid on this H image. Since H emission is associated with stellar complexes having ages of 10 Myr, Fig. 1 demonstrates how active star formation has retreated to the inner parts of NGC 3310, and is not progressing at significant levels in most of the outer galaxy.
 |
 |
2.3 Spectroscopy
The SparsePak (Bershady et al., 2005, 2004) data for NGC 3310 were obtained on the WIYN 3.5m in Kitt Peak, Az, on December 14, 2005. Our observations were made under photometric conditions with optimal seeing (0.5″). We used the echelle 316@63.4 grating at order 8, centred at , resulting in a resolution of 11,400 or 0.21 per pixel. This corresponds to a resolution of 20 km s-1 over a two pixel resolving element. The fibre array was centred on the galaxy’s bulge, and the fibre positions are shown in Fig. 1. We obtained 2 exposures of 1800s each. We also took calibration arcs using the CuAr lamp throughout the night.
The basic reductions, such as the bias and overscan corrections, for these data were done using IRAF with the CCDRED and HYDRA packages. The combined images and calibration frames were created using the IMCOMBINE procedure and subsequent was completed using the DOHYDRA task. Using this task, we flat-fielded the spectra and performed the wavelength calibration with the assistance of the NOAO calibration spectra database444http://www.noao.edu/kpno/specatlas/index.html. The spectra were linearised to facilitate line extraction and further analysis. Also, we used the SparsePak sky fibre data to remove the sky lines from the final spectra. Of the seven sky fibres, four were found to contain target H lines and were removed. The remaining three fibres were averaged and used for sky subtraction.
3 Photometry
3.1 Integrated Colours
The colours for each region are listed in Table 1, and the surface photometry for the network of debris in NGC 3310 is shown in Table 2. These calibrated magnitudes and their errors were calculated using the POLYPHOT package in IRAF and are described in Paper I. The errors shown include only random sources of error, and thus represent lower limits. However, for low surface brightness photometry, the main source of systematic error is flat field error. With the S2KB chip and the well-baffled WIYN 0.9m telescope, the signal is flat across the chip to within 0.7 percent. Thus, the variation across each region shown in Fig. 1 is negligible for the 0.9m data. However, for the -band data, taken on the WIYN 3.5m, scattered light becomes a more serious issue and the field is less flat by an order of magnitude. As a result, the errors in may be as high as mag. Another source of systematic error is that the natural variation in the colour within each region. However, average colours are still useful for studying trends as well as the aggregate properties of the stellar populations within each region.
While there is quite a range in colour across the system, in general, most of the defined regions have bluer colours than are typical of non-starbursting disc galaxies (de Jong, 1996). Ideally, we would like to compare the debris colours with those of NGC 3310’s underlying disc. The difficulty with this comes from the fact that when we observe NGC 3310, we are seeing light from both the underlying disc and the overlying starburst, combined.
| Region | |||||||
|---|---|---|---|---|---|---|---|
| A | 17.430.006 | 17.490.02 | 17.080.003 | 16.730.004 | -0.060.02 | 0.410.02 | 0.360.007 |
| B | 16.230.003 | 16.410.01 | 15.930.002 | 15.530.002 | -0.180.01 | 0.480.01 | 0.400.004 |
| C | 16.010.002 | 16.200.01 | 15.770.002 | 15.390.002 | -0.180.01 | 0.420.01 | 0.390.004 |
| D | 17.210.006 | 17.550.02 | 17.120.004 | 16.730.005 | -0.340.03 | 0.430.03 | 0.390.009 |
| E | 17.080.006 | 17.410.03 | 16.890.004 | 16.490.005 | -0.330.03 | 0.520.03 | 0.410.009 |
| F | 17.350.007 | 17.640.03 | 17.010.004 | 16.590.005 | -0.290.03 | 0.630.03 | 0.420.009 |
| G | 17.460.009 | 18.160.05 | 17.630.013 | 17.240.010 | -0.700.06 | 0.530.06 | 0.390.017 |
| H | 16.540.004 | 16.740.02 | 16.310.003 | 15.930.003 | -0.200.02 | 0.430.02 | 0.380.006 |
| I | 17.980.010 | 19.260.10 | 18.920.025 | 18.650.023 | -1.280.10 | 0.340.10 | 0.270.038 |
| J | 16.220.004 | 17.830.05 | 17.220.008 | 16.720.007 | -1.610.05 | 0.610.05 | 0.500.013 |
| K | 16.890.003 | 17.480.02 | 17.270.003 | 16.910.004 | -0.590.02 | 0.220.02 | 0.360.006 |
| L | 17.170.004 | 18.050.03 | 17.790.007 | 17.390.006 | -0.880.03 | 0.260.03 | 0.410.011 |
| M | 18.000.007 | 18.180.03 | 17.770.004 | 17.440.006 | -0.190.03 | 0.410.03 | 0.340.010 |
While modelling these two components separately is tricky to do, one can use several different approaches to estimate the colour of the underlying disc. If we assume that before the collision and its subsequent starburst, NGC 3310 was a typical disc galaxy, we can use its RC3 (de Vaucouleurs et al., 1991) classification () to compare its colour with the average colour for similar galaxies. According to the work of de Jong (1996) galaxies of a similar classification type to NGC 3310 have a . Each tidal feature in NGC 3310 is significantly bluer than this. Since the weak interaction model suggests that shells are formed from a galaxy’s own disc stars, we expect that shells formed in this way would have stellar populations similar to the galaxy’s main disc. Thus, their blue colour suggests it is unlikely that NGC 3310’s debris was formed by a weak interaction. However, this assumption breaks down if the merger(s) that NGC 3310 experienced caused it to change its structural class or if NGC 3310’s underlying disc, due to its starburst and possible recent interactions, is simply not representative of an ordinary spiral galaxy, and thus its RC3 classification isn’t as well correlated to its current colour as a normal galaxy would be. As discussed in further sections, this latter argument appears to be the case.
| Region | 555Signal-to-noise per pixel on the final calibrated image. | 666Total signal-to-noise for each aperture. | ||||||||
|---|---|---|---|---|---|---|---|---|---|---|
| A | 24.10 | 24.16 | 0.28 | 10.09 | 23.75 | 1.52 | 54.64 | 23.39 | 2.13 | 76.47 |
| B | 23.94 | 24.12 | 0.29 | 16.90 | 23.64 | 1.68 | 97.41 | 23.24 | 2.44 | 142.01 |
| C | 23.80 | 23.99 | 0.33 | 19.80 | 23.56 | 1.80 | 108.52 | 23.18 | 2.59 | 155.92 |
| D | 24.17 | 24.51 | 0.20 | 8.37 | 24.09 | 1.12 | 45.95 | 23.69 | 1.62 | 66.63 |
| E | 24.38 | 24.71 | 0.17 | 8.15 | 24.19 | 1.01 | 48.61 | 23.79 | 1.48 | 71.28 |
| F | 24.40 | 24.70 | 0.17 | 7.41 | 24.07 | 1.13 | 48.71 | 23.65 | 1.69 | 72.38 |
| G | 24.98 | 25.67 | 0.07 | 3.71 | 25.15 | 0.42 | 22.37 | 24.76 | 0.61 | 32.32 |
| H | 24.32 | 24.52 | 0.20 | 12.12 | 24.09 | 1.11 | 66.76 | 23.71 | 1.59 | 95.50 |
| I | 24.55 | 25.83 | 0.06 | 2.06 | 25.50 | 0.31 | 10.51 | 25.22 | 0.40 | 13.65 |
| J | 24.11 | 25.72 | 0.07 | 4.26 | 25.11 | 0.43 | 27.41 | 24.61 | 0.69 | 43.74 |
| K | 22.79 | 23.38 | 0.57 | 14.37 | 23.16 | 2.60 | 65.42 | 22.80 | 3.65 | 91.84 |
| L | 23.33 | 24.21 | 0.27 | 7.59 | 23.95 | 1.26 | 35.88 | 23.54 | 1.85 | 52.57 |
| M | 23.88 | 24.06 | 0.31 | 7.66 | 23.65 | 1.67 | 41.61 | 23.31 | 2.29 | 57.12 |
| N | – | – | 0.00 | 0.00 | 25.55 | 0.29 | 13.34 | 25.44 | 0.33 | 14.95 |
3.2 Disc Models
We turn to disc modelling to further explore the properties of the underlying disc. For this task, we used several different MIDAS scripts to calculate the surface brightness as a function of radius. For this we used the FIT/ELL3 routine in MIDAS, which is based on the iterative algorithm of Bender & Möllenhoff (1987). Thus, the resulting surface brightnesses represent the two-dimensional flux distribution based on a convergence fit. As such, these profiles include light from the underlying disc, the starburst, and overlapping stellar debris. Ideally we would like to separate these components in order to compare the colours of the stellar debris with that of the underlying disc of NGC 3310.
 |
 |
 |
 |
 |
 |
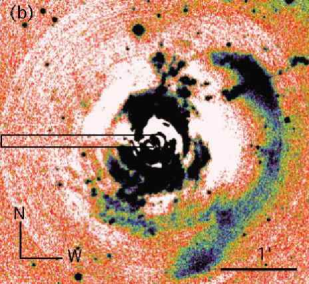
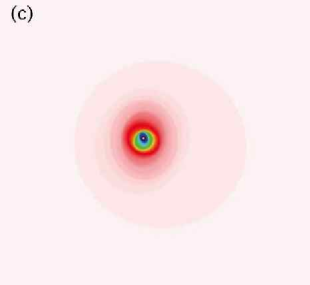
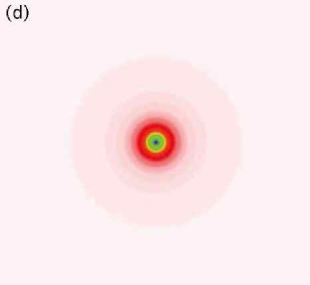
Once we obtained our best 2D flux distribution for NGC 3310, we subtracted it from our original image in order to examine the structure of the debris. This image is shown in Fig. 2a. In this image, the debris network and the clumpy star-forming regions are clearly visible. However, when we examine the resulting 2D distribution, we find that the presence of debris distorts the fit on the western side (Fig. 2c) In order to correct for this, we wrote a new MIDAS script to use a slice of the eastern portion of the galaxy, shown as a black rectangle in Fig. 2b, which we then azimuthally expanded to represent the entire surface of the disc. This is only a partial solution in that it still contains light from some star-forming regions, but it allows us to sample the less optically disturbed side of the galaxy and to choose a slice containing no bright tidal debris. We then subtracted this fit from our image, shown in Fig. 2b. The actual 2D fit from this circular model is shown in Fig. 2d. In comparing Figs. 2a and 2b, one can clearly see the asymmetries induced by the western regions of tidal debris in the outer disc in 2a. These features disappear when using the eastern slice to model the disc.
Next, we applied our photometric solutions to calibrate the model frames in each band, and subtracted them to create a frame for the disc model. We then used the value defined in RC3 as our diameter and performed aperture photometry to find a total of 0.30. This agrees with previous measurements of the global for this system and provides a useful consistency check on our 2D flux distributions. While these models do not separate the disc and starburst contributions to the total emission, they are effective at subtracting the outer regions of the disc, since at higher radii the contribution from the starburst becomes insignificant. The residuals from this model, which highlight clumpy galactic regions and regions of debris, can be seen in Fig. 2b.
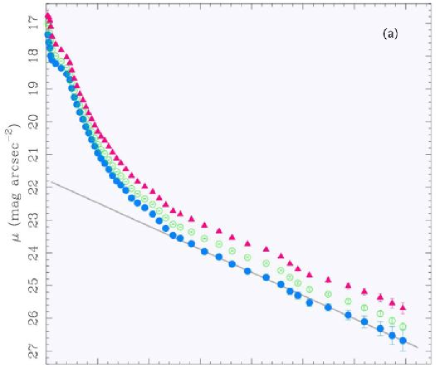
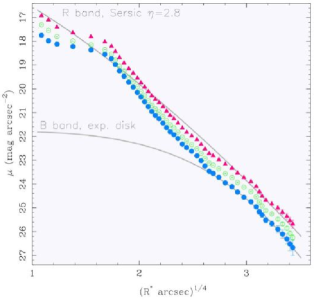
In order to carry out detailed surface brightness photometry of NGC 3310 we then derived the profiles using method iv of Papaderos et al. (2002). These results are shown in Figs. 3 and 4. In Fig. 3a, the surface brightness is shown as a function of radius plotted linearly. The solid line is a fit to the -band surface brightness profile (SBP) for , and yields an approximation for the disc and debris at these radii. This fit implies a central surface brightness of =21.77 0.06 mag arcsec-2, comparable to the Freeman value of 21.65 mag arcsec-2 (Freeman, 1970). This value is somewhat lower than that found by Baggett, Baggett & Anderson (1998) () but our models include contributions from both the bulge and the disc, and can therefore be expected to be brighter. We also find an exponential scale length of 2.080.04 Kpc, or , and an absolute total B magnitude of -18.4 mag (for D Mpc) for the disc. This scale length is somewhat longer than that of Duric et al. (1996) () for an off-H waveband and significantly smaller than the measured by Baggett, Baggett & Anderson (1998) in the -band. However, the SBPs we present in Figs. 3 and 4 extend at least two magnitudes deeper than those previously measured.
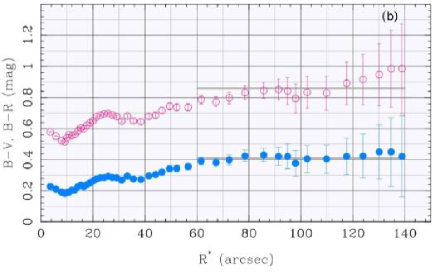
Fig. 3b shows the and radial colour profiles for NGC 3310, calculated by subtracting the respective SBPs. The colours for the outer disc region (defined as ) are 0.42 0.03 and 0.86 0.07 magnitudes.
It is also interesting the shape of the surface brightness profiles for each band. In Fig. 4 we plotted the SBPs against R1/4 in order to check to how well the SBP can be approximated by the de Vaucouleurs law. From this plot we see that the de Vaucouleurs law (fit by where ) describes parts of the SBP (between R and R) very well, but not the SBP as a whole. A Sérsic fit yields an and a slightly better than a model with a fixed = 4. However, all Sérsic distributions leave systematic residuals when fitted to the total SBP, indicating that a single fitting law cannot perfectly fit the SBP. In fact, an exponential disc appears to emerge at higher radii.
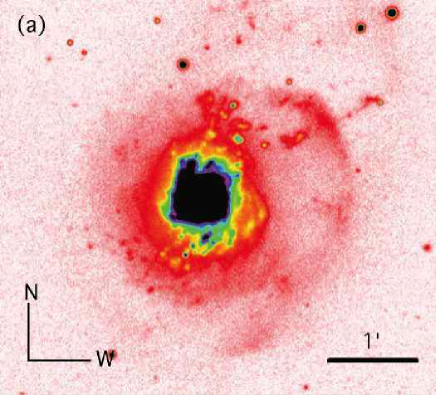
It is clear from Figs. 3 and 4 that the light from the starburst makes a large contribution to the overall light from NGC 3310. In order to better understand the nature of NGC 3310’s underlying disc, we must find some way to eliminate the light contribution to the bright starbursting regions. To accomplish this, we have created pixel masks for each of the , and -band images in order to remove the contribution of obvious star-forming regions across the disc. The same mask was used for all images, and was created by eliminating all counts greater than 5 above the sky in the B-band image, which most closely represents the younger star-forming regions. While masking reduces the total number of pixels available to the models, we have sufficient pixels in regions outside the main starburst ring to measure colours with a reasonable signal-to-noise ratio; we have effectively masked out the entire central region of NGC 3310, leaving only the outermost disc. Furthermore, most of the outer debris shown in Fig. 1 lies outside of the radius of 92″, and will not affect the final colour. The B-band image and its pixel mask are shown in Figs. 5a and 5b. When calculated using only pixels within and not eliminated in the masks, we find a global disc colour of , which is still bluer than the expected value from de Jong (1996), but is rather more typical of an Sd galaxy. It is, however, in excellent agreement with our average colour for the outer radii of the surface brightness profiles. This suggests that well represents the outer regions of the disc of NGC 3310. While debris within still adds to the total colour of the disc, its contribution is small since the debris is expected to be fainter than the galaxy itself. Furthermore, the photometry of Table 1 suggests that the debris in this system would bias the galaxy toward a redder . Given the blue nature of the resulting from the pixel masks, it is unlikely that overlying tidal debris is a significant contributor to the global galactic colour.
 |
 |
3.3 SparsePak Preliminary Results
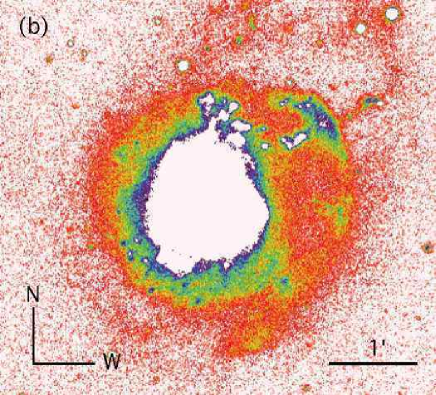
For each fibre in which H was detected, we fit the line with a Gaussian profile to find the peak of the line and measure its velocity. Fibres that contained lines with are shown in Fig. 6. All but two lines were well fit by a single Gaussian profile. For the two remaining fibres, which exhibited a double-peaked structure at the very top of the line, the profile was fit as a single line to obtain an average velocity. In both cases, each actual peak’s velocity deviates from the average fit by less than 3 per cent.
Since the SparsePak data traces the warm ionised gas component in NGC 3310, these data suggest that NGC 3310 has maintained its disc structure and rotation in the star-forming component of its disc despite recent substantial mergers with this system. While the old stars may have experienced a substantial disturbance, the young stars, as represented by the H emission shown in Fig. 6, appear to exist in a rotating system. The velocities shown in Fig. 6 are not corrected for inclination. From data, Mulder, van Driel, & Braine (1995) find . Earlier work focusing on H emission finds a slightly lower inclination of . While our observed km s-1 across NGC 3310’s disc is at first glance somewhat low for a typical disc galaxy, when corrected for inclination (adopting the value) this becomes 124 km s-1, yielding a rotational velocity of 62 km s-1. While the exhibits a higher total velocity, the data extend well beyond the range of our SparsePak data. At a radius of 40″, or 2.7 Kpc, our value is consistent with that of Mulder, van Driel, & Braine (1995). It is also interesting to note that our SparsePak data show an initial increase in the velocity of the H emitting gas, and then drops at higher radii to values consistent with those from . This trend is also noted in van der Kruit (1991); Galletta & Recillas-Cruz (1982) The fact that the warm ionised gas is fairly smoothly rotating may provide some support for the idea that the disc in this system may be in the process of reforming in the manner described by Firmani, Hernandez, & Gallagher (1996) after a gas-rich merger (Springel & Hernquist, 2005). Or, rather NGC 3310 may have maintained its disc structure despite multiple collisions. If this is indeed the case, galactic discs may be surprisingly robust.
3.4 Discussion
The calculated for the outer disc regions is redder than the global given in the RC3 which includes the bright star-forming regions. However, for the debris regions ranges from 0.63 in region F to the South to 0.22 for the bright star-forming region, K, in the arrow. That several regions are still significantly redder than the underlying disc stars suggests that they did not originate in the disc of NGC 3310. One possibility is that they consist of the broken remains of an incoming, disrupted companion galaxy - as has been suggested for a similar debris loop around NGC 5907 (Zheng et al., 1999; Shang et al., 1998; Sackett et al., 1994; Morrison et al., 1994). The bluer regions may reflect a subsequent (and currently fading) star formation episode among the debris.
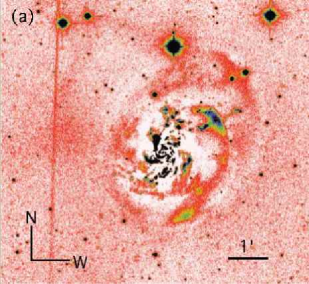
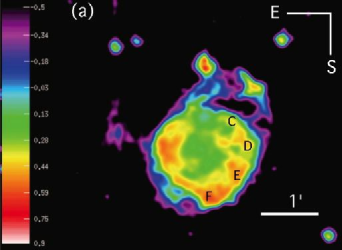
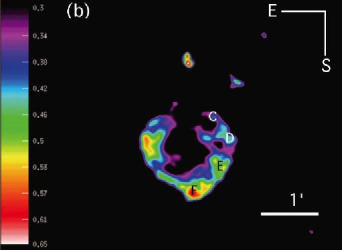
We also note the presence of an interesting colour gradient in NGC 3310’s debris. In Figs. 7a and 7b, we show colour plots of NGC 3310 in for two different colour ranges. In these images, a colour gradient is apparent from regions F to E to D to C, changing from in region F to in region C. This could be caused by a propagating wave associated with an incoming companion inducing star formation along the outer debris in the arc defined by F-C. After a burst of star formation, the colour will fade faster than , which is less sensitive than the -band to the presence of the most massive stars. Thus, the increasingly blue , yet fairly constant from F to D, may represent a fading burst passing from F to D. In this case, the arrow structure may represent the front edge of a propagating star-forming wave, leaving regions of recently compressed gas and new star formation in its wake. Likewise, the star formation rate in these red regions (F, J) might have been truncated some time ago if they consist of material expelled as tidal structures from within NGC 3310. In models of stellar populations that have had their star formation completely truncated, it takes about years to drive from 0.42 to 0.62 after completely stopping star formation. This may also explain the colour gradient in regions FEDC.
It remains a possibility that the masks were simply insufficient to remove all the light from the starburst. In this case, the pre-burst disc stars may be redder, and the shells could have originated in the disc. We further explore the origins of these regions by comparison with spectral synthesis models in the following section.
 |
 |
4 Comparison with GALEV Models
4.1 Model Assembly
The GALEV stellar population synthesis models (Schulz et al., 2002; Anders & Fritze-v. Alvensleben, 2003) involve two different components - one of which represents the underlying, pre-burst galaxy, and another which represents the starburst. We can then compute colours for the combined system of disc and starburst. GALEV provides two options for the underlying disc component. The first is a galactic disc that has experienced constant star formation (for which we chose 2 M⊙ yr-1) throughout its lifetime. This model, when combined with a starburst model, defines the blue limit for a galaxy. The other option is to represent the underlying galaxy with an exponentially declining star formation rate. This model begins with a high rate of star formation that declines on a timescale of years. In this model, the galaxy is dominated by passive evolution and represents the red limit for a galactic disc. Each of these models have been calculated with five different metallicities. For comparison with our work, we have chosen an intermediate metallicity value of , since while NGC 3310 is thought to have greater than solar metallicity in the nucleus, results from Pastoriza et al. (1993) suggests that material outside the starburst ring is subsolar in metallicity.
The output for each model is a set of luminosities in different filters for a given stellar mass for each time step from to beyond a Hubble time. We combined the two models using:
| (1) |
where is the luminosity of the underlying galaxy component, per solar mass at a given wavelength, is the luminosity per solar mass of the overlying burst, and b is the strength of the burst by mass fraction. For we chose the luminosity at 12 Gyr to represent an existing disc galaxy. The luminosities (and colours) of the underlying galaxy are actually quite insensitive to age after approximately 5-6 Gyr, and thus colour is mostly dependent on which model is chosen for the underlying galaxy.
The total luminosities were found for each band and were converted to magnitudes and then colours. These colours form the evolutionary tracks seen in Fig. 8.
 |
 |
 |
 |
4.2 Model Results
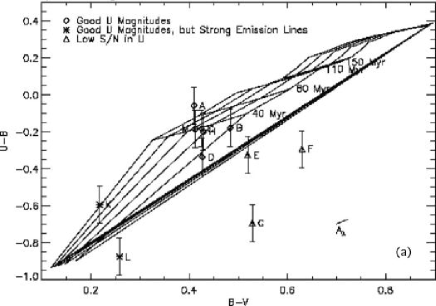
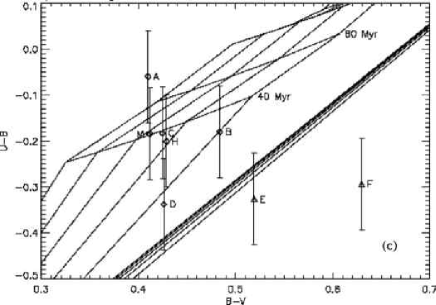
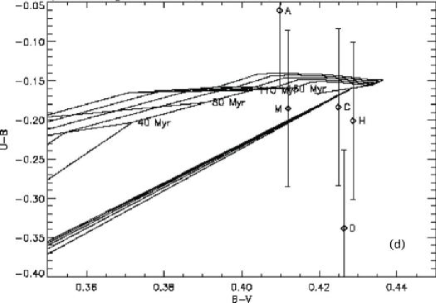
In order to explore the stellar populations resident in each debris region of NGC 3310, we compared our photometry of the regions displayed in Fig. 1 with various models from the GALEV spectral synthesis models. In Fig. 8, we show our photometric results plotted over several model curves created using the GALEV models.
Each curve in Figs. 8a and 8c represents an underlying galaxy with exponentially declining star formation that has a starburst overlaid. The burst is represented as an instantaneous event that takes the underlying, ancient galaxy (t = 12 Gyr) from the reddest point in and space, to the bluest. The colour then slowly grows redder as the stars which were formed in the burst then age. Each curve represents a different strength of burst, ranging from 0.8 to 2 per cent of the local stellar population by mass, and whose light then adds to that of the ancient stellar population.
While the error bars are most likely higher in the -band due to greater systematic errors, there are still trends evident in Fig. 8a. Regions A, B, C, H, K and M are all consistent with burst strength of 0.014, i.e. a starburst involving 1.4 per cent of the local stellar population’s mass. They are also consistent with a post-burst age of Myr. While region D is slightly bluer in , it is also consistent with the rest in age, although it requires a slightly lower burst strength, i.e. with only 0.7 per cent of that region’s total mass. It is possible that region D has simply experienced less star formation than the aforementioned regions. These results are consistent with the burst age found from NGC 3310 star clusters by de Grijs et al. (2003b).
While region L is lower than all the models, it is still consistent with the rest of the points when the errors of the models themselves are considered ( magnitudes).
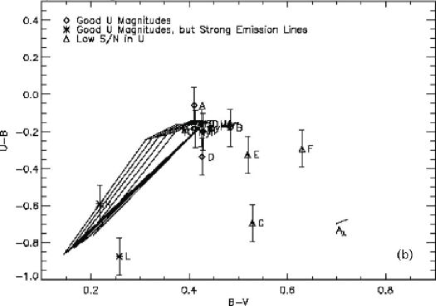
Figs. 8b and 8d show the results for an underlying galaxy with a constant star formation rate plus a starburst. Note that the initial for the constant star-forming model at Gyr. This is the same value of that we measure when we removed the starburst component from the disc light using pixel masks. If these masks successfully removed the starburst contribution to the total light, then NGC 3310 should be well represented by a constantly star-forming disc before the most recent burst occurred.
In comparing our photometry to the models in Fig. 8b, we find that while a few of the bluer regions, such as K, A, M, C, and H overlap with these evolutionary tracks, the rest of the debris network is inconsistent with these models, even when the model errors of are taken into account. While it is possible these regions have a completely distinct evolutionary history from the rest of the debris, it is more likely that their evolution is connected with the rest of the debris system, and that their bluer colours indicate higher burst strengths in these regions, as is suggested by Fig. 8a. We therefore conclude that the exponentially decaying star formation rate plus burst model gives the better description for these data.
5 Summary
We have explored the photometric properties and the origins of NGC 3310’s tidal debris. This galaxy is currently undergoing a starburst induced by a complex merger. We find a global for NGC 3310 which is consistent with de Vaucouleurs et al. (1991). In an attempt to separate the contributions of the starburst and the underlying disc in the NGC 3310 system, we created a mask in the B-band to eliminate all luminous blue regions in the disc. This resulted in a global for areas with little active star formation. This is also consistent with the average colour ( = 0.42) calculated from the surface brightness profiles at the outer radii of NGC 3310. However, the colours of the shell and debris structures range in from as red as 0.63 to as blue as 0.22, as measured for region K in the star-forming arrow. This suggests that the debris did not originate in the disc.
Another possibility is we were unable to completely separate the contribution of the bright starburst and the underlying disc, and that NGC 3310’s underlying disc is truly redder than . Since NGC 3310 is UV bright any little remaining contamination from the burst could skew the results to a bluer . In order to explore this, we assumed a red, underlying disc comprised of an aged stellar population experiencing exponentially declining star formation and overlaid starburst models of various strengths to create composite colours. We also created another set of composite colours using a bluer underlying disc model with a modest yet constant star formation. The model for the underlying galaxy in this latter case also matched our calculated underlying disc colours of .
The comparison of colours of debris structures with predictions of GALEV stellar population synthesis models also suggests that these structures are not simply remains of NGC 3310’s pre-merger stellar disc. They are more likely the remains of a redder, disrupted companion galaxy that was destroyed in merging with NGC 3310. In comparing the colours of regions in the debris with those of models, we find that they are consistent with an ancient stellar population that has experienced a weak burst of star formation in the past 50 Myr. In general, the distinctive outer features of NGC 3310 have colours that imply significantly different evolutionary histories than those of its main disc, and are not consistent with the bluer constantly star-forming disc starburst models.
The extensive debris network - specifically the large stellar loop, the two extended HI tails and the stellar shells - as well as the blue underlying disc colours, the high gas content and the starburst may be indicative that we are witnessing the result of a major merger or multiple, smaller, simultaneous mergers and that the disc of NGC 3310 is being reformed as suggested by Kregel & Sancisi (2001).
Our deep surface photometry indicates that the SBP of NGC 3310 is best approximated by a Sérsic model with an exponent , slightly larger that the value that is expected for the de Vaucouleurs law. However, systematic residuals between the Sérsic fit and the observed SBPs suggest that a single fitting law cannot provide a perfect fit to the SBPs. This fact, in connection with the exponential slope observed in all bands for suggest that a disc+starburst model gives a better approximation to NGC3310’s total light and supports the idea that the disc has survived the recent mergers experienced by NGC 3310. This does not entirely rule out a major merger, however, as Springel & Hernquist (2005) suggest that if disc galaxies are sufficiently gas rich, then discs can survive equal mass mergers, implying that discs may be surprisingly robust. However, since there is some evidence of older stellar populations in this system, it is perhaps more likely that we are seeing the growth of NGC 3310’s disc through the accretion of multiple, small companions onto a preexisting disc.
Most of the debris is consistent with a small burst of star formation in the past 50 Myr, (which is consistent with the ages of the young stellar clusters in the central starbursting region (de Grijs et al., 2003a)), and recent work by Knapp et al. (2006) suggests that a secondary star formation event, as indicated by the presence of a young stellar cluster, may have occurred in this system approximately 750 Myr ago. This discrepancy may result from either unique, sequential mergers with NGC 3310, or the incoming companion and its resulting debris completing multiple orbits before finally being destroyed. Either case may help account for the observed range of colours in the outer debris network.
Future 2D integrated field unit spectroscopy with improved velocity resolution would be useful for further examining the stability of the disc and exploring the likelihood that we are witnessing a reforming disc. It may also be useful to obtain kinematic information on the shells, although their low optical surface brightness and low HI content will make it difficult to obtain reasonable signal-to-noise ratios in these regions. In lieu of such data, dynamical modelling of this system would provide further insight into the origins of the surrounding stellar debris.
Acknowledgements
EHW and JSG thank the National Science Foundation for support through grant NSF AST98-03018 to the University of Wisconsin and the University of Wisconsin-Madison Graduate School for additional funding. EHW would also like to thank the National Space Grant College and Fellowship Program and the Wisconsin Space Grant Consortium for their generous funding of this project as well as Bill Harris for his helpful discussions. We would also like to thank the referee for their careful review and insightful comments.
This research has made use of the NASA/IPAC Extragalactic Database (NED) which is operated by the Jet Propulsion Laboratory, California Institute of Technology, under contract with the National Aeronautics and Space Administration.
References
- Anders & Fritze-v. Alvensleben (2003) Anders, P., Fritze-v. Alvensleben, U. 2003, A&A, 401, 1063
- Baggett, Baggett & Anderson (1998) Baggett, W. E., Baggett, S. M., Anderson, K. S. J. 1998, AJ, 116, 1626
- Balick & Heckman (1981) Balick, B., Heckman, T. 1981, A&A, 96, 271
- Bender & Möllenhoff (1987) Bender, R., Möllenhoff, C. 1987, A&A, 177, 71
- Bershady et al. (2004) Bershady, M. A., Andersen, D. R., Harker, J., Ramsey, L. W., Verheijen, M. A. W. 2004, PASP, 116, 565
- Bershady et al. (2005) Bershady, M. A., Andersen, D. R., Verheijen, M. A. W., Westfall, K. B., Crawford, S. M., Swaters, R. A. 2005, ApJS, 156, 311
- Bertola & Sharp (1984) Bertola, F., Sharp, N. 1984 MNRAS, 207, 47
- Duric et al. (1996) Duric, N., Glenn, J., Grashuis, R., Kunkle, J., Collins, A. 1996, ApJ, 470, 814
- Firmani, Hernandez, & Gallagher (1996) Firmani, C., Hernandez, X., Gallagher, J. 1996, A&A, 308, 403
- Freeman (1970) Freeman, K. C. 1970, ApJ, 160, 811
- Galletta & Recillas-Cruz (1982) Galletta, G., Recillas-Cruz, E., 1982, A&A, 112, 361
- de Grijs et al. (2003b) de Grijs, R., Anders, P., Bastian, N., Lynds, R., Lamers H. J. G. L. M., O’Neil, E. J. 2003b, MNRAS, 343, 1285
- de Grijs et al. (2003a) de Grijs, R., Fritze-v. Alvensleben, U., Anders, P., Gallagher, J. S., Bastian, N., Taylor, V. A., Windhorst, R. A. 2003a, MNRAS, 342, 259
- de Jong (1996) de Jong, R. S. 1996, A&A, 313, 377
- Heckman & Balick (1980) Heckman, T. M., Balick, B. 1980, A&AS, 40, 295
- Knapp et al. (2006) Knapp, G. R. et al. 2006, AJ, 131, 859
- Kregel & Sancisi (2001) Kregel, M., Sancisi, R. 2001, A&A, 376, 59
- van der Kruit (1991) van der Kruit, P. C., 1976, A&A, 49, 161
- Morrison et al. (1994) Morrison, H. L., Boroson, T. A., Harding, P. 1994, AJ, 108, 1191
- Mulder, van Driel, & Braine (1995) Mulder, P. S., van Driel, W, Braine, J. 1995, A&A, 300, 687
- Papaderos et al. (2002) Papaderos, P., Izotov, Y. I., Thuan, T. X., Noeske, K. G., Fricke, K. J., Guseva, N. G., Green, R. F. 2002, A&A, 393, 461
- Pastoriza et al. (1993) Pastoriza, M. G., Dottori, H. A., Terlevich, E., Terlevich, R., Díaz, A. I. 1993, MNRAS, 260, 177
- Puxley, Hawardan, & Mountain (1990) Puxley, P. J., Hawarden, T. G., Mountain, C. M. 1990, ApJ, 364, 77
- Sackett et al. (1994) Sackett, P. D., Morrison, H. L., Harding, P., & Boroson, T. A. 1994, Nature, 370, 441
- Schulz et al. (2002) Schulz, J., Fritze-v.Alvensleben, U., Fricke, K. J. 2002, A&A, 392, 1
- Shang et al. (1998) Shang, Z.-H., et al. 1998, ApJ, 504, L23
- Smith et al. (1996) Smith, D. A., Neff, S. G., Bothun, G. D., et al. 1996 APJ, 473, L21
- Springel & Hernquist (2005) Springel, V., Hernquist, L. 2005, ApJ, 622, L9
- Thomson & Wright (1990) Thomson, R. C., Wright, A. E. 1990, MNRAS, 247, 122
- de Vaucouleurs et al. (1991) de Vaucouleurs G., de Vaucouleurs A., Corwin, H. G., et al. 1991, Third Reference Catalog of Bright Galaxies. Springer, New York (RC3)
- Walker & Chincarini (1967) Walker, M. F., Chincarini, G. 1967, ApJ, 147, 416
- Wehner & Gallagher (2005) Wehner, E. H., Gallagher, J. S. 2005, ApJ, 618, L21
- Zheng et al. (1999) Zheng, Z., et al. 1999, AJ, 117, 2757