Observing Cold Gas in Submillimeter Galaxies: Detection of CO() Emission in SMM J13120+4242 with the Green Bank Telescope
Abstract
We report the first detection of CO(10) emission from a submillimeter-selected galaxy, using the Green Bank Telescope. We identify the line in the spectrum of SMM J13120+4242 as a broad emission feature at , with . If the observed CO(10) line profile arises from a single object and not several merging objects, then the CO(43)/CO(10) brightness temperature ratio of suggests and the presence of sub-thermally excited gas. The integrated line flux implies a cold molecular gas mass , comparable to the dynamical mass estimate and 4 times larger than the mass predicted from the CO(43) line assuming a brightness temperature ratio of 1.0. While our observations confirm that this submillimeter galaxy is massive and gas-rich, they also suggest that extrapolating gas masses from transitions of CO leads to considerable uncertainties. We also report an upper limit to the mass of cold molecular gas in a second submillimeter galaxy, SMM J09431+4700, of .
Subject headings:
galaxies: ISM — galaxies: high redshift — galaxies: formation — galaxies: evolution — infrared: galaxies — radio lines: galaxies1. INTRODUCTION
The resolution of the far-infrared (far-IR) background at long wavelengths through ground-based submillimeter- and millimeter-wave surveys has revealed a population of infrared-luminous, but optically faint, high-redshift galaxies, whose spectral energy distributions (SEDs) and submillimeter flux densities suggest large bolometric luminosities (), mostly emitted in infrared (IR) wavebands. Subsequent deep X-ray observations by Alexander et al. (2003, 2005) indicate that the bulk of this emission is not powered by active galactic nuclei (AGN), suggesting that high rates of star formation () are responsible for the majority of the enormous luminosities of these submillimeter-selected galaxies (SMGs), even though they appear to already possess significant stellar masses (; Borys et al. 2005). SMGs have a surface density on the sky a factor of 10 smaller than the optically-selected, star forming, Lyman break galaxies, but are 10 times as luminous; this, together with the fact that SMGs seem to be strongly clustered (Blain et al., 2004), would suggest that SMGs are an important population of forming galaxies, and either represent the formation epoch of some of the most massive galaxies or trace out unusually active regions. However, the role they play in the scenario of hierarchical galaxy formation and evolution is not yet fully understood. The large far-IR luminosity and significant optical obscuration of SMGs (Smail et al., 2004) are reminiscent of ultraluminous IR galaxies (ULIRGs) observed in the local universe, most of which are strongly interacting or merging systems (Sanders & Mirabel, 1996). Since ULIRGs also show evidence for evolving into elliptical galaxies (Genzel et al., 2001; Tacconi et al., 2002), it has been suggested that SMGs are high- analogs of ULIRGs, possibly progenitors of the large bulges or elliptical galaxies observed locally (Smail et al., 2002). However, determining the baryonic and dynamical masses of SMGs, their system dynamics, the duration of the phenomenon, and their end state, and matching them with theoretical predictions as well as with local objects has proven a major challenge — the faintness of SMGs at optical and near-IR wavelengths precludes the detailed study needed to assess commonly-used evolutionary indicators.
Studies of molecular gas emission provide the crucial mass and dynamical information needed to evaluate the evolution and mass of SMGs in the context of hierarchical galaxy formation and evolution. The total intensity of molecular emission indicates the mass of gas that is available to fuel future star formation, and the brightness temperature ratios from rotational transitions of different quantum number constrain the temperature and density of the gas, suggesting how the gas is being consumed. Even though millimeter-wave CO emission from SMGs is near currently achievable detection limits, a series of interferometric surveys (e.g. Frayer et al., 1998, 1999; Neri et al., 2003; Greve et al., 2005; Tacconi et al., 2006) have successfully detected CO() transitions in SMGs, finding that SMGs are massive (median ; Tacconi et al., 2006), gas-rich (median ; Greve et al., 2005), and compact (median ; Tacconi et al., 2006), consistent with the hypotheses that SMGs are high- counterparts of ULIRGs and progenitors of massive spheroids or ellipticals. All of this information derives from warm molecular gas, but we have limited knowledge of the less excited, cold molecular gas that makes up a substantial fraction by mass of the gas content of present-day galaxies (e.g. the observations of M82 of Weiß, Walter, & Scoville 2005b). With a low threshold for excitation, requiring and K, CO(10) emission ( GHz) is the most representative tracer of the metal-enriched molecular gas mass in galaxies because it is sensitive to the cold, diffuse gas that may dominate. Papadopoulos & Ivison (2002) and Greve, Ivison, & Papadopoulos (2003) present evidence for large amounts of cold, low-excitation gas at high redshift, as first suggested by Papadopoulos et al. (2001), in the galaxy HR 10. In this submillimeter-bright ERO that lacks obvious AGN signatures, at , the CO(54) line luminosity underestimates the cold molecular gas mass by nearly an order of magnitude. Observations of CO() in SMGs are thus complementary to studies of gas and necessary to determine the total mass of molecular gas they contain.
Previous studies of CO(10) emission from high- galaxies have been carried out with the Very Large Array (VLA) (e.g. Papadopoulos et al. 2000; Carilli et al. 2002b; Greve et al. 2003; Greve, Ivison, & Papadopoulos 2004). The Robert C. Byrd Green Bank Telescope (GBT) far exceeds the current capabilities of the VLA in instantaneous spectral bandwidth (800 MHz maximum per spectrometer bank, compared with 50 MHz at the VLA) with a comparable effective collecting area. Since high- CO lines can be wider than the VLA bandwidth (Greve et al., 2004), the GBT is better suited to search for and measure accurately the spectral shape of CO emission from SMGs, at the expense of limited spatial resolution.
In this paper, we present the results of a search for CO(10) emission from SMGs, undertaken with the GBT and the facility’s K-band receiver (18–26 GHz). The tuning range of the GBT’s K-band receiver restricts our potential SMG targets to those with redshifts greater than , of which there are only four with measured redshifts (Chapman et al., 2005; Ledlow et al., 2002). Of these four SMGs, we chose to target for GBT observations the two which also have previous high- CO detections (both from CO(43) observations at the IRAM Plateau de Bure interferometer) so we could compare the line strengths and widths of any detections: SMM J09431+4700 at (Neri et al. 2003; hereafter SMM 09431) and SMM J13120+4242 at (Greve et al. 2005; hereafter SMM 13120). Throughout our discussion, we assume , , and .
2. OBSERVATIONS
We searched for CO(10) emission from SMM 09431 and SMM 13120 with the 18–26 GHz dual-feed, dual-polarization receiver (K-band) at the GBT on UT 2004 December 1. We utilized the position-switching “Nod” observing pattern, in which the two feeds alternate between the target position and a blank-sky position away in azimuth such that one feed (beam) is always on the target source. A 2-minute integration (scan) was completed before the receiver moved in azimuth to the alternate position; thus a full Nod sequence, consisting of a pair of scans, lasted 4 minutes. Every 90 minutes, the pointing and focus of the telescope were checked on a nearby bright radio source. Observing conditions were excellent through both night and day, with low atmospheric opacity ( nepers) and system temperatures in the range 30–50 K. Total on-source integration times were 6.0 hours for SMM 09431 and 6.2 hours for SMM 13120. The size of the main beam at the GBT at 26 GHz is , so our observations are not spatially resolved. However, since corresponds to kpc at , it is very likely the entire extent of our target galaxies and any companions will be within the main beam ( kpc at ) and our observations should be representative of the average cold gas properties over the observed galaxy.
We used the GBT’s Autocorrelation Spectrometer (ACS) in 3-level sampling mode. For each of the two target sources, we observed a 800 MHz bandpass centered on the frequency at which the CO(10) line should fall based on the CO system redshift obtained from the previous CO(43) detection. The spectrometer banks were configured in low-resolution mode, providing 2048 channels of width 391 kHz each ( at 26 GHz) for both of the two circular polarizations of each feed. The noise diode for the K-band receiver was fired every 1.0 sec for calibration; we average the data taken with the calibration noise diode on with that taken with the noise diode off to improve our signal-to-noise (S/N) ratio. The noise diode temperature () values for the K-band receiver provided by the observatory were verified using spectral observations of the radio-loud quasars 3C 147 (for SMM 09431) and 3C 295 (for SMM 13120) taken with the same spectrometer setup as the science targets.
3. CALIBRATION
In single-dish radio observations, the spectral baseline is the limiting factor in detecting very faint, broad lines like those expected to be produced by CO(10) emission from a high- galaxy. Vanden Bout, Solomon, & Maddalena (2004) discuss the significant baseline curvature seen in wide-bandwidth GBT spectral data obtained over a range of elevations and timescales, despite the off-axis feed arm design of the telescope, which was intended to reduce reflections of signal along the optical path. The spectral baselines at the GBT are caused by a combination of small differences in the telescope system power between on- and off-source scans and reflections between components in the optical system, and cannot be simply modeled with a low-order () polynomial. Our GBT data are certainly affected by complex baseline shapes, since we average over hours of integration and of elevation. The calibration of our spectral data is thus nontrivial; we must take special care to minimize the systematic errors in our spectra associated with baseline ripples or curvature, and strive to not introduce any line-scale structure into our spectrum while attempting to remove the baseline.
vanden Bout et al. (2004) outline a method for calibrating GBT spectral data of faint sources, in which the baseline shape is determined directly from the data and subtracted. They first produce a difference spectrum for both polarizations of each beam for every pair of scans that comprise a full Nod sequence according to the formula
| (1) |
where and represent an on-source scan and a blank-sky reference scan, respectively, observed with the same receiver feed. The resulting spectra are averaged over time and feed, weighted by , to produce a master average science spectrum for each polarization. The template containing the baseline shape of each master spectrum is constructed next by first taking the scans in pairs of Nod sequences (four scans) and subtracting successive ON scans and OFF scans in the following manner:
| (2a) | |||
| (2b) | |||
| (2c) | |||
| (2d) | |||
where and are the ON scans from the first and second Nod sequences, respectively, and similarly for and . Then, the sequence of ON-ON and OFF-OFF spectra is averaged to form the master baseline template for each polarization. vanden Bout et al. (2004) point out that contains the same baseline structure as the science spectrum (though with higher amplitude due to the longer time delay between differenced quantities), but without signal from the emission line being observed. Hence, to remove the baseline described by the template so that the only spectral shape remaining is due to the observed source, is smoothed and fit to the master science spectrum for each polarization by finding the best-fit coefficients such that
| (3) |
The best-fit template is then subtracted from . In Figure 1(a) we show the final averaged spectrum after applying this method of baseline reconstruction and subtraction to our Feed 1 data on SMM 09431 and averaging the two polarizations of the feed together. The majority of the baseline shape has clearly been removed in Figure 1(a), but a slight residual baseline remains. While this residual is less complex than the original baseline shape, its origin is unclear; this causes it to be difficult to fit and subtract, which may interfere with identification of faint lines from the target source.

We preferred not to fit and subtract a baseline template from our final averaged spectrum at all, hoping to avoid the uncertainties associated with the process. As a result, we chose to use a different method of calibration, a variation of the traditional method of single-dish radio spectrum calibration described in Equation 1, which we refer to as the OFF1 + OFF2 method. In effect, we use the two OFF scans surrounding each ON scan to construct an improved, interpolated OFF, separately for each polarization in each feed. However, instead of assuming that the preceding and following OFFs contribute equally to the spectral shape of each ON scan, which might be expected if the spectral baseline was purely a linear function of time, we use least-squares fitting to find values and for each scan such that
| (4) |
where refers to the scan prior to the ON scan and refers to the scan following the ON scan (all taken through the same feed). Allowing and to vary by scan helps remove systematic shapes caused by sporadic phenomena of varying amplitude; we found such coefficient variation necessary because even though for of scans the (, ) values were (,), it was not unusual (the remaining of scans) for and to lie in the range 0.25–0.45 or 0.55–0.75, where . After the spectral fits, we apply the derived values of and to obtain the normalized difference spectrum, for each scan, in units of antenna temperature:
| (5) |
where is the system temperature derived for the first OFF scan and is the system temperature derived for the second OFF scan. The difference spectra from all scans are then averaged together, weighted by the root-mean-square deviation (RMS) of each scan. In Figure 1(b) we show the result of the OFF1 + OFF2 method on the same spectral data used in Figure 1(a). The final averaged spectrum in Figure 1(b) lacks obvious residual ripples on the scale of a galaxy emission line (, or MHz at GHz), though a long period ( few hundred MHz), low amplitude ripple may be present which is not likely to hinder faint line detection. Note that this reasonably flat spectrum was produced without subtracting a curved or rippled baseline template. In the case of SMM 13120, a clearly linear baseline appeared in the final averaged spectrum produced by this method, which was easily fit and removed. In general, we find that the OFF1 + OFF2 method produces qualitatively similar results to that used by vanden Bout et al. (2004): sources detected with one calibration method are also detected by the other method, and the resulting spectra have comparable single-channel RMS values (the RMS values of the final average spectra, in the sense vanden Bout et al. method versus OFF1 + OFF2 method, are 0.37 mJy versus 0.41 mJy for SMM 09431 and 0.44 mJy versus 0.42 mJy for SMM 13120). In addition, neither method can completely remove all baseline shape from our GBT data. Consequently, we cannot say that one method produces better results than the other. Even so, we prefer the OFF1 + OFF2 method because no curved baseline subtraction is required. However, it is important to note that the method is suitable only for sources with very weak or undetectable continuum emission at mm. SEDs of SMGs (e.g. Chapman et al., 2005) predict that continuum emission from SMGs at 30 GHz is undetectable in 6 hours of integration time with the GBT.
Before averaging the spectral data from the different polarizations and feeds, we examined the periodograms (Fourier power spectra) of the calibrated spectra from both polarizations and feeds of the individual scans, looking for any peaks that might indicate systematic spectral features not removed in the calibration process. Such ripples could influence the appearance of the spectrum, and we were especially concerned about any ripples of width similar to the expected width of a CO emission line from a high- source (, or MHz). We found that the right polarization of feed 2 nearly always showed an irregularly changing pattern of power between 0–0.03 MHz-1 (periods MHz). This feature was not found in feed 1 data, and was found in approximately half of the left polarization data from feed 2. Thus, in an effort to ensure that what appears as noise on the scale of an emission line is due to random processes, we have not included any feed 2 data in the averaged calibrated spectra. While this exclusion cuts our effective integration time in half and increases the spectral rms, it helps ensure that the quoted noise is uncorrelated in frequency, and increases our confidence in the reality of any possible emission line detection by removing ripples and structure that could obscure the line.
To convert our object spectra to units of Janskys, we corrected for atmospheric attenuation and then applied the parametrization of the GBT gain versus elevation curve found by Condon (2003), re-scaled for K-band by assuming an aperture efficiency at 26 GHz of 0.55 from an interpolation of GBT aperture efficiency measurements at nearby frequencies. We estimate that our flux calibration is accurate to within 15%, due to uncertainties in the temperatures of the calibrator diodes, the GBT gain curve, and the calibration noise diode variations across the observed bandwidth, as well as the opacity estimate.
All of the calibration of our spectral data was accomplished with the new library of routines written by the GBT staff in IDL, GBTIDL111 Information on GBTIDL is available at http://gbtidl.sourceforge.net./..
4. RESULTS
4.1. SMM 13120
SMM 13120, also known as SSA 13-332, was identified as a source in the Hawaii Deep Field SSA 13, with mJy. The galaxy, with an optical redshift of , is not known to be lensed, and its optical spectrum reveals active nucleus signatures (C IV, Si IV, O III; Chapman et al., 2005). Chapman et al. (2005) estimate from the radio-submillimeter SED a bolometric luminosity for SMM 13120 and a characteristic dust temperature of K, though Kovács et al. (2006) find from their SHARC-II observations of SMGs from the Chapman et al. (2005) sample that the luminosities presented in Chapman et al. (2005) are typically overestimated by a factor of 2 and the dust temperatures are overestimated by 13%, which would bring down the values for SMM 13120 to and K. High- CO observations have confirmed the redshift and shown SMM 13120 to be very massive in molecular gas. Greve et al. (2005) detect CO(43) emission from SMM 13120 with the IRAM Plateau de Bure interferometer at , with velocity width and integrated line flux . Assuming a CO luminosity-to- conversion factor , this yields a molecular gas mass of . Greve et al. (2005) also estimate a lower limit on the dynamical mass of SMM 13120 of . SMM 13120 is unresolved in the beam at IRAM, so no information on the spatial structure of the molecular gas is available.
We detect CO(10) emission from SMM 13120 centered at GHz, with an intensity-weighted line centroid in redshift space of . This detection represents the first detection of CO(10) from a bona fide SMG and the first SMG CO(10) detection with spectral information. In Figure 2 we show our calibrated and averaged spectrum of SMM 13120, produced by the OFF1 + OFF2 method described in §3. We have subtracted a linear baseline from the spectrum, fit to all the channels away from the line, and smoothed it from its original velocity resolution of and RMS per spectral channel mJy to and mJy. The detected line is still visible if the data from feed 2 are included in the final average spectrum.

The Gaussian fit overplotted in Figure 2 shows a wide CO(10) line, . However, the Gaussian fit to the line profile shown in Figure 2 appears poor, possibly because of the triple-peaked appearance of the line, although the -value of the Gaussian fit, , indicates that we cannot formally conclude whether or not the Gaussian function provides a good description of the line profile. To obtain a less model-dependent estimate of the line width, we compute also the second moment of the emission spectrum, finding . Integrating over the line, we find , where the error includes the (estimated) 15% uncertainty in our flux calibration. Applying the relations for and presented in Solomon, Downes, & Radford (1992), this corresponds to a CO luminosity of or . Adopting the CO luminosity-to- mass conversion factor , which is found by Downes & Solomon (1998) to be appropriate for molecular gas exposed to the intense ultraviolet (UV) radiation fields and strong tidal forces present at the centers of nearby ULIRGs, we estimate the total mass of low-excitation in SMM 13120 to be . Note that the CO-to-H2 mass conversion factor can vary depending on local gas conditions (e.g. Yao et al., 2003) and is thus highly uncertain for galaxies at high redshift. As a result, our absolute value of the molecular gas mass may have significant systematic error that is difficult to quantify. Should the gas in SMM 13120 be less dense and less excited than that of ULIRGs, the conversion factor for SMM 13120 should be larger and so we are underestimating the molecular gas mass; if the gas is more dense and more excited, the conversion factor may be too high, and we are overestimating the gas mass.
4.2. SMM 09431
SMM 09431 was identified by Cowie, Barger, & Kneib (2002) in deep submillimeter maps of the galaxy cluster Abell 851 obtained with the SCUBA instrument on the James Clerk Maxwell Telescope. From subsequent 1.4 GHz observations, Ledlow et al. (2002) estimated K, and suggested that two individual radio sources, identified as H6 and H7, were associated with the SCUBA source. Optical follow-up observations showed H6 to be a narrow-line Seyfert 1 galaxy at (Ledlow et al., 2002), while the weaker radio source H7 has a redshift of from O III (Takata et al. 2006, in preparation). Both Neri et al. (2003) and Tacconi et al. (2006) detect CO(43) emission from H7 at with a line width and an integrated line flux . H6 has not been definitively detected in CO. Assuming a CO to conversion factor , Neri et al. (2003) infer a molecular gas mass . SMM 09431 is lensed by the foreground galaxy cluster by a modest factor of 1.2 (Cowie et al., 2002); this factor has been included in all stated values of mass and luminosity.
We do not detect CO(10) emission from SMM 09431, which is apparent in the object’s final calibrated spectrum displayed in Figure 1(b). Our observations yield a single-channel RMS of 0.41 mJy, which in turn corresponds to a statistical upper limit to the integrated flux density at 26.523 GHz of 0.056 , assuming the CO(10) line follows the CO(43) line FWHM of 420 and that the line has a Gaussian profile. However, due to the uncertainties associated with the GBT spectral baselines and the flux calibration, we feel that the value of the error in the integrated flux, , found for SMM 09431 through application of the statistical error formula is probably an underestimate and thus will result in unrealistically low upper limits on the CO line luminosity and molecular gas mass. Consequently, we estimate an alternate value of for SMM 09431 from the error in the integrated flux of SMM 13120, noting that the single-channel RMS values of our final spectra of both objects are nearly identical (0.41 mJy for SMM 09431, 0.42 mJy for SMM 13120) and that the objects were observed in similar conditions on the same day at nearly the same sky frequency. We scale the error in of SMM 13120 (, see §4.1) by to account for the difference in CO line width between the two objects, and thus obtain the more conservative upper limit of for SMM 09431. For the sake of completeness, we provide the upper limits of CO line luminosity and that result from both the statistical upper limit on the integrated line flux and our alternative upper limit. From , we obtain the upper limits to the CO luminosity of SMM 09431 of , or . Assuming the CO-to- conversion factor , the upper limit on for SMM 09431 is then . For the conservative estimate , the corresponding upper limits are , , and , which we believe to be more reasonable than the statistical upper limits. If we were to assume a broader CO(10) line, the upper limit will be still larger and therefore less restrictive.
5. ANALYSIS & DISCUSSION
5.1. CO Line Ratios and Gas Excitation
With detections in multiple CO lines for SMM 13120, one of which is from CO(10), we can use the ratio of the brightness temperatures of the different transitions to extract some clues about the globally-averaged conditions of its molecular gas. The task is made easier because SMM 13120 is not known to be strongly gravitationally lensed, so the effects of differential lensing on the line fluxes are not likely to complicate our interpretation. Defining as the ratio of the area/velocity averaged brightness temperature of the CO(43) and CO(10) lines, and assuming all of the CO emission is from a single object, we find for SMM 13120. This value of is notably lower than the ratio that is expected from a thermalized (i.e. relative level populations described by principles of local thermodynamic equilibrium), optically thick source, , implying that the level of CO is not thermalized in SMM 13120. As a consequence, estimates for SMM 13120 calculated from CO lines assuming the lines are fully thermalized and optically thick will underestimate the mass of low-excitation gas in the galaxy. This is exactly what we find from our CO(10) detection of SMM 13120: our estimate of the molecular gas mass in §4.1, , is a factor of greater than the mass implied by the CO(43) observations if constant brightness temperature is assumed, . Moreover, the lack of a dominant population of thermalized high-excitation gas in SMM 13120 suggests that the CO luminosity-to-H2 mass conversion factor we use in §4.1 may be incorrect for this galaxy. Downes & Solomon (1998) derive that conversion factor for the central starbursts in ULIRGs, and from observations of the central IR-luminous starburst region of M82 (e.g. Weiß et al., 2005b) we expect the CO excitation in a starburst region to be thermalized at least to the CO level. Since the level is observed to not be thermalized when averaging over SMM 13120, the CO-to- conversion factor of Downes & Solomon (1998) is likely too low for SMM 13120, and the total molecular gas mass is likely to be even larger than the we calculate in §4.1.
Such low values of as we find in SMM 13120 are not unknown: in the Milky Way, ranges with position between –0.2 (Fixsen, Bennett, & Mather 1999). The line ratio we find for SMM 13120 is also reminiscent of the CO(54)/CO(10) ratio of 0.1 found in the ERO/SMG HR 10 by Greve et al. (2003), another high- object in which the high- CO emission does not trace the low-excitation gas. That SMM 13120 and HR 10 are similar is somewhat surprising, however, because HR 10 is not known to harbor an active nucleus, while SMM 13120 clearly does. On the other hand, the ratio in SMM 13120 is significantly smaller in comparison to those of the other high- active galaxies with CO(10) detections. PSS 2322+1944, APM 08279+5255, and 4C 60.07 are two QSOs and a radio galaxy, respectively, and have values of of 1.4, 1.5, and 0.7, indicating that the molecular gas they contain is nearly thermalized and that molecular gas masses derived from CO(43) and CO(10) emission will be roughly similar, which is found to be true (Carilli et al., 2002b; Papadopoulos et al., 2001; Greve et al., 2004). Since SMM 13120 hosts an AGN, we might expect its gas conditions to be more like those of the high- active galaxies than galaxies lacking active nuclei; however, note that the active nucleus in SMM 13120 is probably significantly less luminous than those found in PSS 2322+1944 and APM 08279+5255, because, in its rest-frame UV spectrum, the AGN lines are weak and interstellar absorption features indicative of a starburst are also clearly visible (Chapman et al., 2005). It is possible that the less-powerful active nucleus in SMM 13120 could influence the gas properties of the host galaxy in a different way than would a high-luminosity AGN, causing the global CO line ratios to differ between the SMG and the QSOs. It may thus be inappropriate to use the mere presence of an AGN as a factor in predicting global CO line ratios.
From our measurement of in SMM 13120 we can obtain quantitative constraints on the average kinetic temperature and density of the molecular gas in this system. To this end, we assume the CO(10) and (43) emission result from a single gas phase and use a large velocity gradient (LVG) model (based on Richardson et al., 1985) to fit the observed line ratio. Data from only two CO lines generally do not provide enough information to place strong constraints on the excitation; however, since one of the lines is from the 10 transition, we can place strong lower limits on the column and number density of CO, and by extension, on the density of . A standard LVG code, assuming a typical Galactic value for the [CO/H2] abundance , velocity gradient , and , finds a best-fit density for SMM 13120 of for a range of gas kinetic temperatures K. This solution is robust, such that the model finds no candidate solutions at other densities. However, in kinematically violent regions with intense UV radiation fields, such as we expect to find in ULIRGs and SMGs, the [] abundance is likely to be lower, so we also calculate the kinetic temperature and density limits for to cover a range of possible values. Leaving the assumed values of and unchanged, we obtain a slightly higher limit on the molecular gas density of for a somewhat lower gas temperature range of K. Both of these sets of temperature and density limits point to low-density gas in SMM 13120, though we would guess that the solution for is closer to reality. Also, both of the model fits result in kinetic temperatures that are in good agreement with the dust temperature of SMM 13120 found by Chapman et al. (2005), corrected by a factor of 13% as suggested by Kovács et al. (2006), that is, K. would be expected for an interstellar medium in which the gas and dust are well mixed and thermally coupled. Encouraged by these similar values, we adopt a fixed value of K, leave free to vary, and once more use the LVG model to calculate the density of the molecular gas in SMM 13120, obtaining and , consistent with the results of the previous fits. Therefore, the general constraints we can place on the globally-averaged gas properties of SMM 13120 are and K, for a realistic range of . The mean gas density is thus likely to be relatively low in this system. Additionally, it is interesting to note that, if we assume the galaxy is a uniform-density sphere, our density limits imply a small upper limit to the radius of SMM 13120 in the range 0.9–1.4 kpc, which is consistent with the median upper limit on SMG source size that Tacconi et al. (2006) derive from their high-resolution images of high- CO emission from eight SMGs.
The diffuse, warm, and low excitation gas we find in SMM 13120 has been observed in local ULIRGs (Solomon et al., 1997) and at high redshift in HR 10 (Greve et al., 2003). In contrast, previous CO(10) detections of other active galaxies have implied lower limits on the cold gas density nearly an order of magnitude larger. PSS 2322+1944, APM 08279+5255, and 4C 60.07 have cold gas densities derived from and LVG models in the range (Carilli et al., 2002b; Papadopoulos et al., 2001; Greve et al., 2004).
For SMM 09431, we can use our upper limit calculations to place only a lower limit on . We find for , or for . Both limits on suggest SMM 09431 has higher excitation, on average, than SMM 13120, though whether SMM 09431 is more similar to the high- QSOs and radio galaxy with CO(10) detections than SMM 13120 is unclear.
To examine the excitation of SMM 13120 and SMM 09431 in another way, we plot in Figure 3 the integrated line luminosities for different CO lines (hereafter referred to as the CO ladder), normalized to CO(10), for SMM 13120 and SMM 09431, as well as those of the other similarly-luminous high- galaxies with CO(10) detections. For SMM 09431, we use our conservative upper limit of in Figure 3. In addition, we include the CO data of Weiß et al. (2005a) for SMM J16359+6612 at : this galaxy lacks CO(10) data and is an order of magnitude less luminous than the other high- sources, but it has the most complete CO ladder of any SMG and thus provides an interesting comparison. In place of a CO(10) detection for this galaxy we use the the CO(10) flux implied by the LVG fit from Weiß et al. (2005a). Also for comparison purposes, we include in Figure 3 less-IR luminous (by 2-3 orders of magnitude) local galaxies commonly used as templates representative of quiescent galaxies (the Milky Way) and starbursts (the center of M82). Assuming all the CO emission comes from a single object, the CO ladder of SMM 13120 appears to rise much more slowly with increasing than the ladders of the other high- active galaxies, SMM 16359+6612, and M82’s central region. The shallow rise of the CO ladder of SMM 13120 more resembles the CO ladders of the Milky Way and HR 10, and suggests excitation conditions in SMM 13120 somewhat between those of the inner () and the outer () disk of the Milky Way. The shape of the CO ladder of the Milky Way (slow rise and turnover at lower than the other sources) is caused by significant sub-thermal excitation, which is any molecular excitation process not governed by the principles of local thermodynamic equilibrium that causes the excitation temperature derived by comparing the population of different energy levels to be lower than the kinetic temperature of the emitting gas. While we cannot yet say that the CO ladder of SMM 13120 turns over in a similar way as the Milky Way, the slow rise and low values of suggest that sub-thermal excitation is important in both SMM 13120 and HR 10. The existence of sub-thermal excitation in these objects would imply that observations of high- emission lines can provide only a lower limit to the molecular gas mass.

Our findings for SMM 13120, along with the results of Greve et al. (2003) for HR 10, highlight the need for observations of low- CO emission to measure the entire molecular gas reservoir in high- galaxies. Even though it is true for some high- galaxies that CO lines can trace low-excitation gas molecules as well as the highly excited gas, such a conclusion seems not to apply to SMM 13120 and HR 10. In addition, some dispersion clearly exists in the gas properties of galaxies hosting active nuclei at high redshift, since SMM 13120 has both at least a weak AGN and a significant quantity of molecular gas not apparent in observations of high- CO transitions.
5.2. Star Formation Timescales and Efficiency
One of the important issues to address in understanding the role of SMGs in the large-scale picture of galaxy formation and evolution is the duration of star formation. We can use our new estimate of the total molecular gas mass in SMM 13120 from CO(10) to calculate the length of time the major star formation epoch will last from its respective star formation rate (SFR), assuming the SFR is constant. We define this characteristic star formation timescale as
| (6) |
We calculate the SFR from the far-IR luminosity using Equation 4 of Omont et al. (2001),
| (7) |
where is a function of the stellar initial mass function (IMF). We use as the value of found by Chapman et al. (2005) for SMM 13120, multiplied by the correction factor of 0.5 implied by the results of Kovács et al. (2006), and assume a Salpeter IMF to obtain . The resulting SFR and we obtain, and the used in the calculation of the quantites, are listed in Table 1. Assuming all the far-IR emission is a result of star formation, we thus obtain a short characteristic star formation timescale Myr, consistent with the brief burst needed to form the old spheroids and elliptical galaxies we observe at , and in agreement with the duration of SMG star formation bursts estimated by Smail et al. (2004) from modeling the rest-frame optical broad-band colors of SMGs (100-200 Myr). Even though the value of we find for SMM 13120 is short, it is significantly longer than the star formation timescale calculated from the mass implied by the galaxy’s CO(43) emission and the assumption of a constant brightness temperature, which is only 50 Myr. The CO(10) emission clearly indicates that there is more cold gas available in SMM 13120 to fuel star formation than is suggested by observations of CO(43) and the assumption of .
The continuum-to-line ratio provides another means of investigating the evolutionary progression of SMM 13120, because it is commonly used to estimate the efficiency with which molecular gas is converted to stars, independent of the assumed value of the CO-to- conversion factor. For SMM 13120, we calculate using again the value of from Chapman et al. (2005), corrected as suggested by Kovács et al. (2006), for , and we assume all of the CO(10) emission comes from a single object. If we assume all the far-IR emission is a consequence of star formation we obtain an upper limit to the ratio of , significantly less than the value () obtained with the line.
In Table 1 we also list limits on and for SMM 09431. We use the value of from Neri et al. (2003) with our CO(10) upper limits to estimate the continuum-to-line ratio, finding Myr and for the statistical upper limit , and Myr and for the more conservative limit . The values found from our conservative limit are consistent with the results from CO(43).
Local LIRGs and ULIRGs are known to trace a scaling relation between and in which galaxies with higher IR luminosities have higher CO luminosities (e.g. Young et al., 1986). Yao et al. (2003) find a median value of for LIRGs of , while Solomon et al. (1997) obtain a median value for ULIRGs of . The high-redshift QSOs and radio galaxies with CO(10) detections have continuum-to-line ratios from both the CO(10) and CO(43) lines, which is larger than that of SMM 13120 but comparable to SMM 09431. However, in HR 10, from CO(10), nearly an order of magnitude smaller than the continuum-to-line ratio calculated from its CO(54) line. Thus, the continuum-to-line ratio in SMM 13120 resembles local star-forming galaxies and HR 10, suggesting similar star formation efficiencies among them, whereas SMM 09431 appears more like the other high- systems observed in CO(10).
It thus seems that the physical conditions in the interstellar medium of SMM 13120, while similar to another SMG (HR 10), are different than the high- QSOs, 4C 60.07, and SMM 09431. Several possibilities could explain the different conditions. It is possible that the QSOs and 4C 60.07 truly have higher star-formation efficiencies than HR 10 and SMM 13120. Also, the optically- or radio-luminous high- galaxies and SMM 09431 could have more significant contributions to from dust heated by their active nuclei, causing an overestimation of the star formation efficiency when calculated from the continuum-to-line ratio. However, it should be considered that the – relation appears to be non-linear at high values of . Gao & Solomon (2004a, b) suggest that, for this reason, the ratio is not a good indicator of the efficiency of star formation in the most far-IR-bright galaxies such as high- QSOs and SMGs. They argue that HCN emission is a better tracer of the dense gas associated with star formation and IR emission than CO due to its higher critical density for excitation (), and since they find and are linearly correlated over three orders of magnitude in , they suggest that the ratio may be a better indicator of star formation efficiency than . In this light, it may be more appropriate to use ratios or even ratios derived from CO transitions, which trace higher-density gas than CO(10), to compare the star formation efficiencies of the similarly luminous PSS 2322+1944, APM 08279+5255, and 4C 60.07 to SMM 13120 and HR 10.
5.3. A Merger in SMM 13120?
In §4.1, we found the velocity width of the Gaussian fit to the CO(10) line profile of SMM 13120 to be , which deviates significantly from the FWHM fitted to the CO(43) line by Greve et al. (2005), . Such a discrepancy is not typically expected; in general, we expect the line profiles of CO transitions of different will be of similar widths, from observations of nearby galaxies (e.g. Yao et al., 2003). However, as mentioned in §4.1, our data are not of sufficient quality to be certain that a Gaussian profile is an appropriate model for the line shape, so it may be misleading to compare the Gaussian FWHM velocity widths. To determine the reality of the factor of difference in velocity width from the fits, we instead directly compare the CO(10) spectrum of SMM 13120 with the CO(43) spectrum from Greve et al. (2005) in Figure 4, where the amplitude of the 10 spectrum has been multiplied by a factor of 5 in both panels for ease of comparison. In panel (a), we compare the spectra smoothed to the same velocity resolution shown in Greve et al. (2005), , and it is apparent that the low S/N ratio of both spectra preclude detailed comparison. Thus, in panel (b), we further smooth and re-bin the line profiles of both CO transitions to , and find that the CO(43) line is nearly as wide as the CO(10) line, which suggests that the CO(43) line FWHM measurement may have been underestimated in Greve et al. (2005). However, in panel (b) of Figure 4, we observe that the CO(10) line extends to a lower velocity region of the spectrum than the CO(43) line, suggesting that there exists blueshifted (relative to the central system redshift) molecular gas in SMM 13120 which is less excited than the molecular gas at more positive velocity offsets.

Possible explanations of this excitation variation with velocity arise from both of the dynamical scenarios discussed by Tacconi et al. (2006) to explain the double-peaked CO line profiles they observe from other SMGs: a rotating disk and a merger of several galaxy components. If SMM 13120 were a single rotating disk, the blueward extension of the CO(10) line profile could indicate a physically distinct region of cold gas within the disk not symmetrically distributed about the more highly excited region represented by the CO(43) emission, such as a single giant molecular cloud complex. On the other hand, in a rotating disk the rotation curve should flatten away from the center of the galaxy. In such a case, when the CO line profiles are observed averaged over the entire galaxy, the width of the CO(10) profile would not increase over the CO(43) profile even if the lower excitation gas comes from an extended region as compared with the location of the CO(43) emission. Alternatively, if SMM 13120 is an interaction or a merger of several subcomponents separated by several hundred in velocity space, the CO(10) line profile could be different from the CO(43) profile if the merging components possess different excitation conditions.
Continuum observations of SMM 13120 at different wavelengths seem to support a scenario involving an interaction or merger of galaxy components. In Figure 5 we show previously unpublished optical, near-infrared, and radio continuum images of SMM 13120, from Borys et al. (2006, in preparation) and Fomalont et al. (2006, private communication).
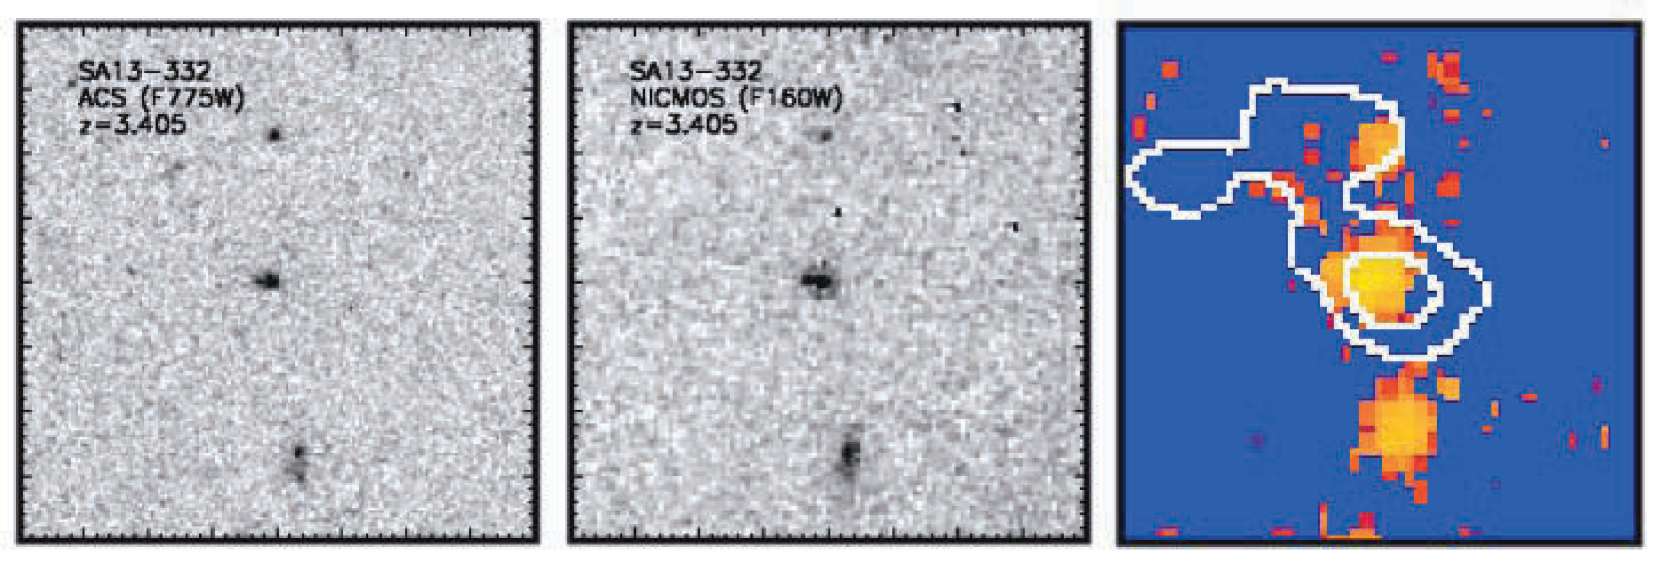
At the position of the 1.4 GHz emission peak the HST F775W- and F160W-band images show a compact, close-separation () double source. Plus, the radio continuum emission appears to be extended on the scale of (at P.A. ), significant at the level. In fact, the northern source away in the HST images appears to be associated with this extended radio emission. The radio continuum indicates significant activity (from black hole accretion or star formation) outside the radio/optical core of SMM 13120, and is suggestive of a galaxy interaction or merger. However, it is not necessarily associated with the blueward-extending CO(10), since the activity causing the extended radio emission would likely cause increased CO excitation. Obtaining high-accuracy redshifts of the optical sources around the optical/radio core and/or interferometric imaging at high spatial resolution of the CO emission lines can verify the merger/interaction scenario: if the optical/radio sources are found to have redshifts corresponding to the center and outer regions of the CO(10) and CO(43) lines, then the sources may indeed be interacting galaxies.
More data are clearly needed to determine the structure and energetics of the major gas component(s) in SMM 13120, and SMGs as a class. In particular, spatially- and spectrally-resolved images and spectra of CO(10) and high- emission will be the most revealing, along with HCN observations, and new instruments and facilities planned for the future will help provide these. In the near future, the new Ka-band correlation receiver at GBT will cover the frequency range to which CO(10) is redshifted for galaxies in the range (26–40 GHz) and thus will aid the detection of CO(10) in many more SMGs in a modest integration time ( hours or less). The GBT will also be important in obtaining HCN data for SMM 13120 and SMGs in general, in a few years assisted by the EVLA222Information on the EVLA project is available at http://www.aoc.nrao.edu/evla/.. Looking further in the future, ALMA333Information on ALMA may be obtained from http://www.alma.nrao.edu/. will be instrumental in understanding the nature of SMM 13120 and other SMGs, since it will provide spatial resolution comparable to HST at submillimeter wavelengths and allow us to determine if and where there are multiple components contributing to the far-IR continuum emission. ALMA will also enable high-quality imaging of many CO and HCN transitions in SMGs, so that the spatial dependence of excitation conditions can be explored.
References
- Alexander et al. (2003) Alexander, D. M., et al. 2003, AJ, 125, 383
- Alexander et al. (2005) Alexander, D. M., Bauer, F. E., Chapman, S. C., Smail, I., Blain, A. W., Brandt, W. N., & Ivison, R. J. 2005, ApJ, 632, 736
- Andreani et al. (2000) Andreani, P., Cimatti, A., Loinard, L., & Röttgering, H. 2000, A&A, 354, L1
- Blain et al. (2004) Blain, A. W., Chapman, S. C., Smail, I., & Ivison, R. 2004, ApJ, 611, 725
- Borys et al. (2005) Borys, C., Smail, I., Chapman, S. C., Blain, A. W., Alexander, D. M., & Ivison, R. J. 2005, ApJ, 635, 853
- Carilli et al. (2002a) Carilli, C. L., et al. 2002a, AJ, 123, 1838
- Carilli et al. (2002b) Carilli, C. L., et al. 2002b, ApJ, 575, 145
- Chapman et al. (2005) Chapman, S. C., Blain, A. W., Smail, I., & Ivison, R. J. 2005, ApJ, 622, 772
- Condon (2003) Condon, J. J. 2003, GBT Efficiency at 43 GHz, Precision Telescope Control System Project Note 31.1, National Radio Astronomy Observatory–Green Bank
- Cowie et al. (2002) Cowie, L. L., Barger, A. J., & Kneib, J.–P. 2002, AJ, 123, 2197
- Cox et al. (2002) Cox, P., et al. 2002, A&A, 387, 406
- Downes et al. (1999) Downes, D., Neri, R., Wiklind, T., Wilner, D. J., & Shaver, P. A. 1999, ApJ, 513, L1
- Downes & Solomon (1998) Downes, D., & Solomon, P. M. 1998, ApJ, 507, 615
- Fixsen et al. (1999) Fixsen, D. J., Bennett, C. L., & Mather, J. C. 1999, ApJ, 526, 207
- Frayer et al. (1998) Frayer, D. T., et al. 1998, ApJ, 506, L7
- Frayer et al. (1999) Frayer, D. T., et al. 1999, ApJ, 514, L13
- Gao & Solomon (2004a) Gao, Y., & Solomon, P. M. 2004a, ApJ, 606, 271
- Gao & Solomon (2004b) Gao, Y., & Solomon, P. M. 2004b, ApJS, 152, 63
- Genzel et al. (2001) Genzel, R., et al. 2001, ApJ, 563, 527
- Greve et al. (2005) Greve, T. R., et al. 2005, MNRAS, 359, 1165
- Greve et al. (2003) Greve, T. R., Ivison, R. J., & Papadopoulos, P. P. 2003, ApJ, 599, 839
- Greve et al. (2004) Greve, T. R., Ivison, R. J., & Papadopoulos, P. P. 2004, A&A, 419, 99
- Kneib et al. (2005) Kneib, J.-P., Neri, R., Smail, I., Blain, A. W., Sheth, K., van der Werf, P., & Knudsen, K. K. 2005, A&A, 434, 819
- Kovács et al. (2006) Kovács, A., Chapman, S. C., Dowell, C. D., Blain, A. W., & Phillips, T. G. 2006, ApJ, in press
- Ledlow et al. (2002) Ledlow, M. J., Smail, I., Owen, F. N., Keel, W. C., Ivison, R. J., & Morrison, G. E. 2002, ApJ, 577, L79
- Mao et al. (2000) Mao, R. Q., et al. 2000, A&A, 358, 433
- Neri et al. (2003) Neri, R., et al. 2003, ApJ, 597, L113
- Omont et al. (2001) Omont, A., Cox, P., Bertoldi, F., McMahon, R. G., Carilli, C., & Isaak, K. G. 2001, A&A, 374, 371
- Omont et al. (1996) Omont, A., Petitjean, P., Guilloteau, S., McMahon, R. G., Solomon, P. M., & Pecontal, E. 1996, Nature, 382, 428
- Papadopoulos & Ivison (2002) Papadopoulos, P. P, & Ivison, R. J. 2002, ApJ, 564, L9
- Papadopoulos et al. (2001) Papadopoulos, P. P., Ivison, R. J., Carilli, C., & Lewis, G. 2001, Nature, 409, 58
- Papadopoulos et al. (2000) Papadopoulos, P. P., Röttgering, H. J., van der Werf, P., Guilloteau, S., Omont, A., van Breugel, W. J. M., & Tilanus, R. P. J. 2000, ApJ, 528, 626
- Richardson et al. (1985) Richardson, K. J., White, G. J., Gee, G., Griffin, M. J., Cunningham, C. T., Ade, P. A. R., & Avery, L. W. 1985, MNRAS, 216, 713
- Sanders & Mirabel (1996) Sanders, D. B., & Mirabel, I. 1996, ARA&A, 34, 749
- Smail et al. (2004) Smail, I., Chapman, S. C., Blain, A. W., & Ivison, R. J. 2004, ApJ, 616, 71
- Smail et al. (2002) Smail, I., Ivison, R. J., Blain, A. W., & Kneib, J.-P. 2002, MNRAS, 331, 495
- Solomon et al. (1992) Solomon, P. M., Downes, D., & Radford, S. J. E. 1992b, ApJ, 398, L29
- Solomon et al. (1997) Solomon, P. M., Downes, D., Radford, S. J. E., & Barrett, J. W. 1997, ApJ, 478, 144
- Tacconi et al. (2002) Tacconi, L. J., et al. 2002, ApJ, 580, 73
- Tacconi et al. (2006) Tacconi, L. J., et al. 2006, ApJ, 640, 228
- vanden Bout et al. (2004) vanden Bout, P., Solomon, P. M., & Maddalena, R. J. 2004, ApJ, 614, L97
- Weiß et al. (2005a) Weiß, A., Downes, D., Walter, F., & Henkel, C. 2005a, A&A, 440, L45
- Weiß et al. (2005b) Weiß, A., Walter, F. W., & Scoville, N. Z. 2005b, A&A, 438, 533
- Yao et al. (2003) Yao, L., Seaquist, E. R., Kuno, N., & Dunne, L. 2003, ApJ, 588, 771
- Young et al. (1986) Young, J. S., Schloerb, F. P., Kenney, J. D., & Lord, S. D. 1986, ApJ, 304, 443
| Source | aaGravitational lensing magnification factor applied to and , and thus included in all quantities calculated from those luminosities. | bbDerived from according to Equation 7 in the text. | CO Trans | ccCalculated using Equation 6 in the text. | Reference | |||||
|---|---|---|---|---|---|---|---|---|---|---|
| () | () | () | (Myr) | () | ||||||
| SMM 13120 | 3.408 | 1.0 | 1.0 | 810 | 10 | 200 | 51 | (1),(2),(3) | ||
| 43 | 50 | 190 | ||||||||
| SMM 09431dd“Conservative” CO(10) limits from §4.2 used in all calculations. | 3.346 | 1.2 | 1.5 | 1200 | 10 | (1),(4) | ||||
| 43 | 18 | 560 |
References. — (1) Greve et al. 2005; (2) Chapman et al. (2005); (3) Kovács et al. 2006; (4) Neri et al. 2003