X-ray Absorption and an X-ray Jet in the Radio-Loud Broad Absorption Line Quasar PG 1004+130
Abstract
We investigate the X-ray properties of PG 1004+130, a radio-loud broad absorption line (BAL) quasar with a hybrid FR I/FR II radio morphology. This optically bright, low-redshift quasar was undetected by Einstein, marking it as anomalously X-ray weak relative to other radio-loud quasars. The 22.2 ks XMM-Newton and 41.6 ks Chandra observations presented here are the first X-ray detections of PG 1004+130 and constitute the highest spectral quality X-ray observations of a radio-loud BAL quasar available to date. The Chandra ACIS-S spectrum shows evidence for complex soft X-ray absorption not detected in the data obtained 1.7 yr previously with XMM-Newton, with a best-fit intrinsic column density of =1.2 1022 cm-2 for the preferred partial-covering model. There is no significant difference in the hard-band power-law photon index of 1.5 between the two observations. The Chandra image also reveals extended X-ray emission 8′′ (30 kpc) south-east of the nucleus, aligned with the FR I jet but upstream of the 1.4 GHz radio-brightness peak. The jet is not detected by HST, and the optical upper limit rules out a simple single-component synchrotron interpretation of the radio-to-X-ray emission. The multiwavelength characteristics of the PG 1004+130 jet, including its relatively flat X-ray power law and concave spectral energy distribution, are similar to those of powerful FR II jets. The lack of strong beaming in PG 1004+130 limits the efficiency of inverse Compton upscattering, and we consider the X-ray emission to most likely arise from a second synchrotron component generated by highly energetic electrons.
1 Introduction
Broad absorption line (BAL) quasars show deep and wide blueshifted absorption troughs in their rest-frame UV spectra (e.g., Weymann et al. 1991). The intrinsic fraction of quasars with BALs is 20% (e.g., Hewett & Foltz 2003); in the most commonly accepted scenario this represents the covering factor of an outflowing BAL wind. While all BAL quasars show absorption from high-ionization transitions, such as Si IV and C IV, some also display absorption from lower ionization transitions, such as Mg II, and such objects tend to be more reddened (e.g., Sprayberry & Foltz 1992; Reichard et al. 2003).
Although BALs were once believed to be confined to radio-quiet sources, optical spectroscopy of the quasars from the VLA 1.4 GHz FIRST survey (Becker et al., 1995), conducted by the FIRST Bright Quasar Survey (White et al. 2000), and the Sloan Digital Sky Survey (SDSS; York et al. 2000) has revealed many radio-loud BAL quasars (e.g., Becker et al. 2000; Menou et al. 2001). Radio-loudness is commonly parameterized by the ratio of rest-frame radio-to-optical flux densities, (Sramek & Weedman, 1980), where those quasars with 1 are considered radio-loud. As this definition may somewhat exaggerate the radio-loudness of BAL quasars with substantial optical reddening, it is also useful to consider the rest-frame radio luminosity density, where 1032 erg s-1 Hz-1 distinguishes radio-loud quasars (e.g., Miller et al. 1993). The majority of radio-loud BAL quasars discovered to date meet both criteria but tend to be of intermediate radio-loudness (fewer than 20% in the combined samples of Becker et al. 2000 and Menou et al. 2001 have 2). Becker et al. (2000) found that about one-third of their BAL quasars were flat-spectrum radio sources (some radio loud), suggesting a viewing angle for this subset well above the equatorial region where disk-associated BAL outflows would be visible, and further discovered that most of their BAL quasars were compact (80% unresolved to 0.2′′ at 8 GHz). These results support alternate proposals that BALs may be associated with an evolutionary phase with a large BAL wind covering fraction, rather than orientation (e.g., Gregg et al. 2000), although the consistency of the sub-millimeter emission of BAL quasars with that of non-BAL quasars is difficult to reconcile with evolutionary scenarios in which BAL quasars are emerging from a dusty “shroud” (Lewis et al. 2003; Willott et al. 2003).
Radio-quiet BAL quasars, particularly those with low-ionization absorption features, are usually weaker in X-rays than would be expected from their optical luminosities (e.g., Green et al. 2001; Gallagher et al. 2006). The X-ray spectra of radio-quiet BAL quasars show clear evidence of X-ray absorption, often complex, with intrinsic column densities 1022 cm-2 (e.g., Gallagher et al. 2002). Although UV and X-ray absorption are clearly linked (e.g., Brandt, Laor, & Wills 2000), the higher column density of the X-ray absorber (e.g., Gallagher et al. 2006) suggests the X-ray absorption arises interior to the UV BALs, perhaps in the “shielding gas” postulated by Murray et al. (1995) and generated naturally in the simulations of Proga et al. (2000). A Chandra snapshot survey of five radio-loud BAL quasars confirmed they are also X-ray weak relative to similar non-BAL quasars, but with fairly soft spectra incompatible with the large column densities necessary to explain this weakness as simple neutral absorption (Brotherton et al. 2005).
Many radio-loud quasars display striking extended emission in the form of jets and lobes. The classification scheme of Fanaroff & Riley (1974) distinguishes the edge-darkened, core-dominated FR I sources from the more luminous edge-brightened, lobe-dominated FR II objects. The multiwavelength properties of FR I and FR II jets are quite distinct: FR I jets have linear or convex spectral energy distributions (SEDs) that can typically be modeled by a synchrotron spectrum extrapolated (with a break if necessary) from the radio through the optical to the X-ray (e.g., Worrall et al. 2004), while the SEDs of the prominent knots in FR II jets are concave, frequently possessing only an upper limit at optical wavelengths (e.g., Sambruna et al. 2004; Marshall et al. 2005). The X-ray emission in FR II jets is often interpreted as arising from inverse-Compton scattering of cosmic microwave background photons (IC/CMB models; e.g., Tavecchio et al. 2000; Celotti et al. 2001), a process that is increasingly efficient for highly relativistic bulk motions, for jet angles close to the line of sight, and for objects at large redshifts (Schwartz 2002). Some observational and theoretical complications with IC/CMB models have been noted (e.g., Tavecchio et al. 2003; Hardcastle 2006), and high-redshift radio-loud quasars in general do not appear to have extreme jet-to-core X-ray brightness ratios (e.g., Siemiginowska et al. 2003; Bassett et al. 2004; Lopez et al. 2006). Alternative models for the origin of the X-ray emission from FR II jets have been proposed, including synchrotron emission from a population of highly relativistic electrons (e.g., Atoyan & Dermer 2004). X-ray hotspots have been detected by Chandra in a number of FR II sources; the most luminous hotspots are consistent with synchrotron self-Compton (SSC) emission but other cases require a second highly energetic synchrotron component to produce the X-ray emission (Hardcastle et al. 2004).
PG 1004+130 (PKS 1004+13, 4C 13.41) is an optically bright ( = 14.98; e.g., Garcia et al. 1999), radio-loud ( 2.32 [Wills et al. 1999] and 6.51032 erg s-1 Hz-1), lobe-dominated quasar at a redshift of = 0.240 (Eracleous & Halpern, 2004). PG 1004+130 is notably X-ray weak; it was undetected by Einstein with a 0.5–4.5 keV flux limit of 1.4 10-13 erg cm-2 s-1 (Elvis & Fabbiano, 1984). Wills et al. (1999) analyzed IUE and HST (Goddard High Resolution Spectrograph; GHRS) spectra of PG 1004+130 and found evidence for broad, blueshifted absorption in several UV lines, notably O VI, N V, and C IV. They concluded that PG 1004+130 was likely a BAL quasar with a BALnicity index111BALnicity index is calculated from the C IV BAL as the total equivalent width of all associated absorption troughs blueshifted from the emission peak by greater than 3000 km s-1 and at least 2000 km s-1 wide. Any quasar with a BALnicity index 0 km s-1 is formally a BAL quasar according to the criterion of Weymann et al. (1991). (Weymann et al. 1991) of 850 km s-1. A recent observation with HST performed with the Space Telescope Imaging Spectrograph (STIS) to search for BAL variability has confirmed this designation (B. J. Wills, in preparation), making PG 1004+130 the only currently known low-redshift ( 0.5) radio-loud BAL quasar. These results suggest that the X-ray weakness of PG 1004+130 is likely related to absorption.
The extended radio structure of PG 1004+130 is also notable: it is one of the prototypical examples discussed by Gopal-Krishna & Wiita (2000) of a hybrid morphology source possessing both an FR I and an FR II lobe. The majority of the radio emission in the FR I south-east (SE) structure is concentrated in a knotted jet that is most prominent close to the nucleus and then fades into a gradually broadening plume, whereas the north-west (NW) structure shows classical FR II edge-brightened morphology. The structure of such hybrid sources is more intuitively explained as arising from the propagation of twin jets into dissimilar large-scale environments rather than by invoking a “lopsided” central engine (Gopal-Krishna & Wiita 2000). Both the extended projected size of PG 1004+130 (500 kpc) and the ratio of lobe-to-core flux (we measure this to be 40 at rest-frame 1.7 GHz using FIRST data) suggest the jet axis is inclined at a relatively large angle to our line of sight, consistent with physical models in which BAL winds flow equatorially from the accretion disk. A quantitative lower limit on the inclination to the line-of-sight, , may be estimated from the core radio-to-optical luminosity ratio, , which Wills & Brotherton (1995) find improves upon the commonly used lobe-to-core ratio. PG 1004+130 has 1.1, suggesting 45∘ (consistent with Wills et al. 1999). This large inclination angle implies little line-of-sight beaming in the jet and constrains the interpretation of any associated X-ray emission.
We have obtained the first X-ray detections and spectra of PG 1004+130 in order to check for nuclear absorption and determine the quasar’s general X-ray properties. We make use of both XMM-Newton and Chandra, as they provide complementary information: XMM-Newton has high throughput and covers a broader energy range, whereas Chandra provides the angular resolution necessary to detect and characterize any extended X-ray emission. The two X-ray observations were conducted 1.7 years apart, allowing investigation of both short and long-term X-ray variability.
In this paper we adopt a standard cosmology with = 70 km s-1 Mpc-1, = 0.3, and = 0.7 (Spergel et al., 2003). This choice results in a luminosity distance of 1200 Mpc and an angular distance scale of 3.8 kpc arcsec-1 for PG 1004+130. The Galactic column density toward PG 1004+130 ( = 10 07 26.10, = +12 48 56.20) is 3.931020 cm-2 (Murphy et al., 1996). Unless otherwise noted, errors are given as 90% confidence intervals for one parameter of interest ( = 2.71).
2 Observations
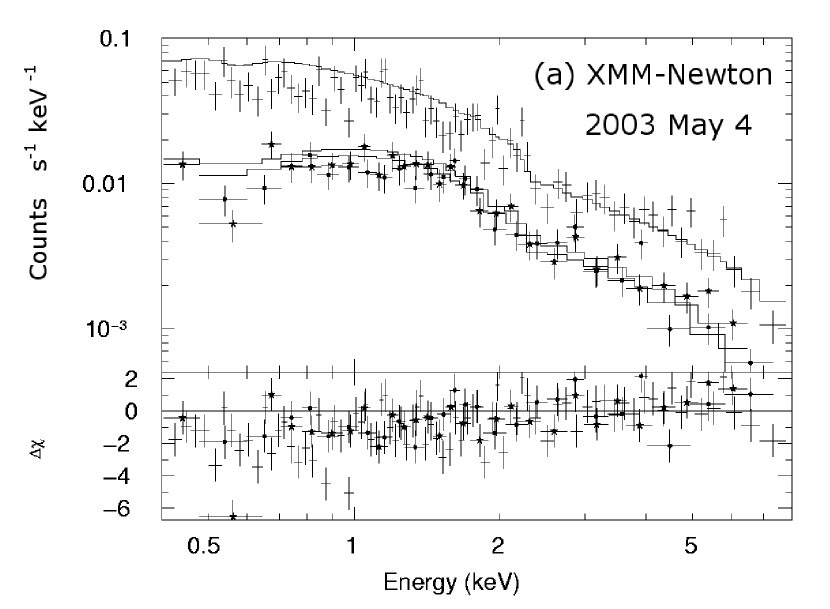
PG 1004+130 was observed by XMM-Newton (Jansen et al., 2001) on 2003 May 4 (ObsID 0140550601) for an effective exposure time of 22.2 ks, and data were collected by all instruments. There were insufficient counts in the RGS grating spectra for meaningful analysis; we therefore restrict our study of the X-ray spectrum to the EPIC (pn and MOS) imaging spectroscopy data. There was no flaring during the observation in the detector-wide count rate for events with energies greater than 10 keV.
Analysis was performed with the XMM-Newton Science Analysis Software (SAS v6.5.0). The nuclear spectrum was extracted from a circular region with a radius of 24.6′′, while background regions were determined separately for the pn (a 533′′ by 82′′ rectangle) and MOS (a 381′′ by 192′′ rectangle) detectors to avoid detector gaps. We generated custom redistribution matrix files (RMFs) and ancillary response files (ARFs), which together describe the instrument response to incident photons and allow forward-fitting of the spectrum. Finally, the extracted nuclear spectrum was binned to contain at least 20 counts per bin using the FTOOLS task GRPPHA. There are 1550 counts from 0.5–8 keV in the pn spectrum, and 1100 total counts in the MOS1 and MOS2 spectra; the expected number of background counts is 50 in the pn spectrum and 30 total in the MOS spectra.
The observation included sets of images from the XMM-Newton Optical Monitor (OM) for each of the UVW1, UVM2, and UVW2 filters, with central wavelengths of 2910 Å, 2310 Å, and 2120 Å, respectively. We converted background-subtracted OM count rates (automatically calculated during pipeline processing) to flux densities using scaling factors appropriate for active galactic nuclei (AGNs), as determined by the OM Calibration Team. The resulting UVW1, UVM2, and UVW2 observed fluxes for PG 1004+130 are 6.3, 8.2, and 8.1 10-15 erg cm-2 s-1 Å-1, respectively. The standard deviation of the individual flux density measurements in a given filter is 0.2 10-15 erg cm-2 s-1 Å-1, while the systematic uncertainty in the flux calibration is less than 10%.222OM Calibration Team: http://xmm.vilspa.esa.es/sas/documentation/watchout/uvflux.shtml
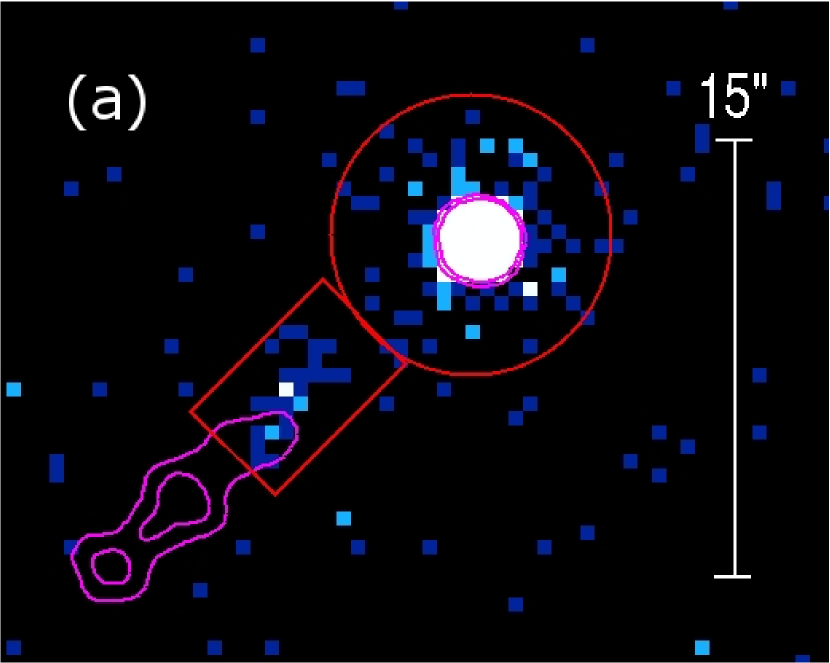
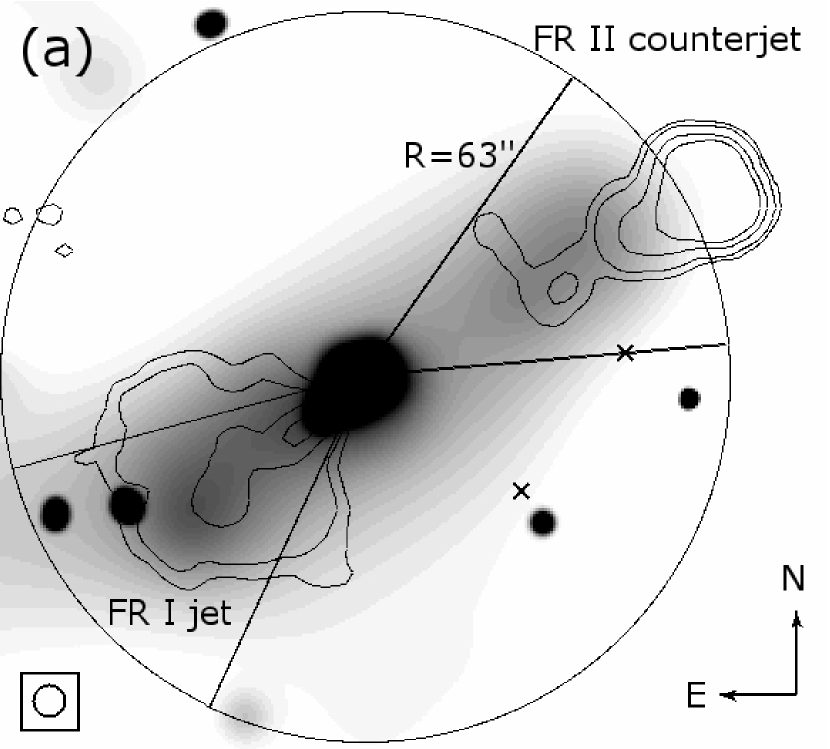
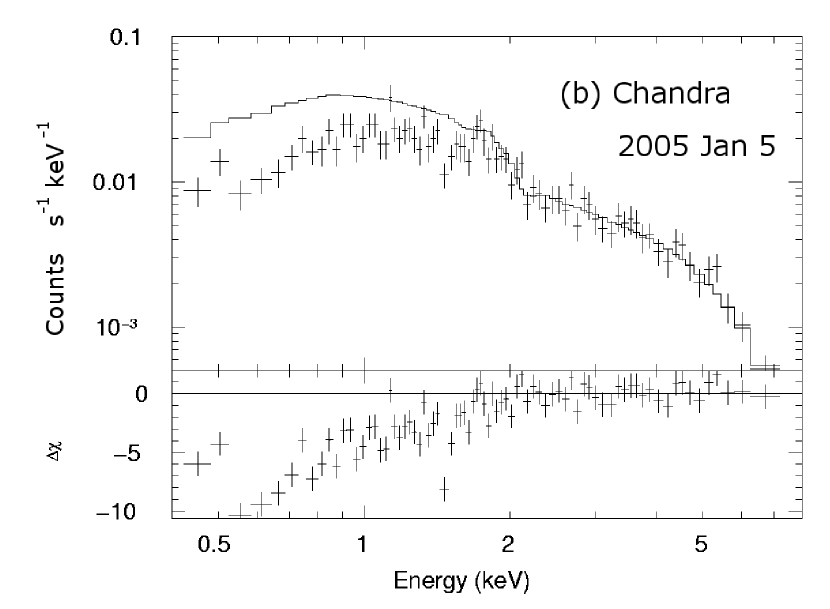
We obtained a subsequent Chandra observation to confirm the X-ray spectral properties, to investigate variability, and to examine (at higher angular resolution) any extended X-ray emission. PG 1004+130 was observed by Chandra on 2005 Jan 5 (ObsID 5606) for 41.6 ks with the Advanced CCD Imaging Spectrometer (ACIS; Garmire et al. 2003) S-array in faint mode. These data have been reprocessed (REPRO-III) to incorporate the latest calibration (CALDB v3.2.0) including automatic application of both the ACIS charge-transfer inefficiency correction and the time-dependent gain adjustment. The ACIS-S3 image shows a bright point source at the location of the nucleus of PG 1004+130, jet-associated X-ray emission collinear with but mostly upstream of the SE radio jet, and several additional sources, two of which are coincident with the outer regions of the SE FR I lobe. These two sources have point-source HST counterparts; utilizing the methodology and results of Maccacaro et al. (1988), we find that their X-ray-to-optical flux ratios are consistent with those expected for AGNs. We extracted the nuclear and the extended X-ray emission for spectral analysis, using regions as shown in Figure 1a (a circle with a 4.8′′ radius for the nucleus and a 4.1′′ by 6.3′′ rectangle for the jet) and measuring the background from a large source-free elliptical region (with a 91′′ major axis and a 38′′ minor axis) east of the nucleus. There was no significant background flaring during the observation. Source-specific RMFs and ARFs were generated from the CALDB v3.2.0 database; the ARFs include the effects of low-energy quantum-efficiency degradation due to contamination build-up on the ACIS optical-blocking filter. The extracted nuclear spectrum was binned to contain at least 20 counts per bin using the FTOOLS task GRPPHA. The 0.5–8 keV nuclear spectrum contains 1800 counts (of which only 5 are expected to be from background), and there are 30 counts in the extended X-ray emission.
We supplement the XMM-Newton and Chandra data with previously published and archival radio, IR, optical, and UV coverage of PG 1004+130. VLA observations of PG 1004+130 have been performed in several configurations and bands, and we make use of 1.4 GHz, 5.4′′ FWHM catalog images from the FIRST survey (Becker et al., 1995) as well as C band (B configuration) data from 1979 taken by E. Fomalont (Fomalont 1982) and L band (A configuration) data from 1982 taken by J. Wardle. Images for these latter two observations were constructed using components between 20 and 160 , allowing investigation of the small-scale structure along the jet at a resolution of 1.5′′ while excluding the large-scale structure already apparent in the FIRST image. IR fluxes were obtained from IRAS (100–12 m), ground-based (, , and bands), and 2MASS (, , and bands) data. An optical spectrum and photometric magnitudes were taken from the SDSS database (PG 1004+130 is SDSS J100726.10+124856.2) and an HST WFPC2 image of PG 1004+130, taken with the F606W filter and analyzed and discussed by Bahcall et al. (1997), was used to search for extended optical emission. PG 1004+130 has been observed spectroscopically in the UV by HST (initially with GHRS and later with STIS; Wills et al. 1999; B. J. Wills, in preparation), IUE (with both the long and short-wavelength spectrographs), and FUSE, and portions of these data have been incorporated as well.
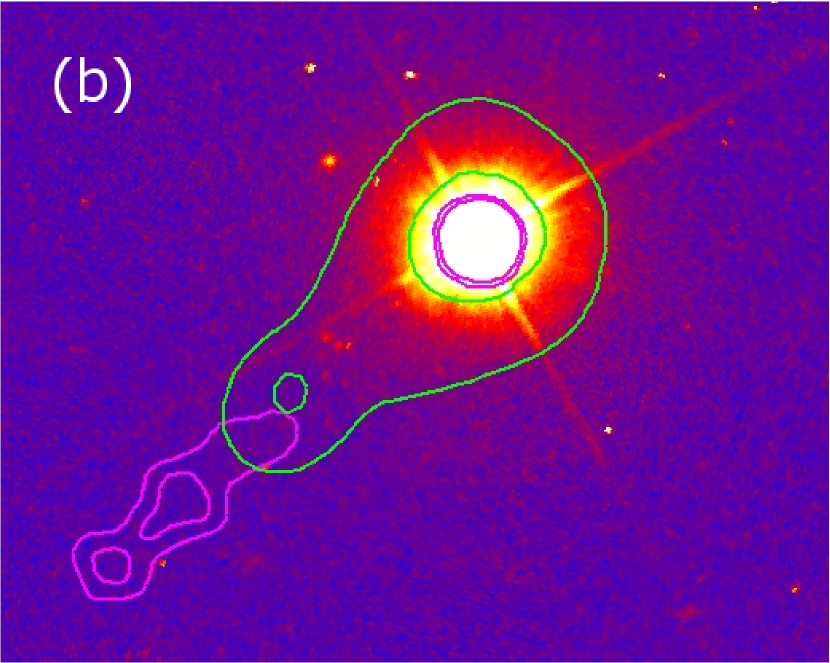
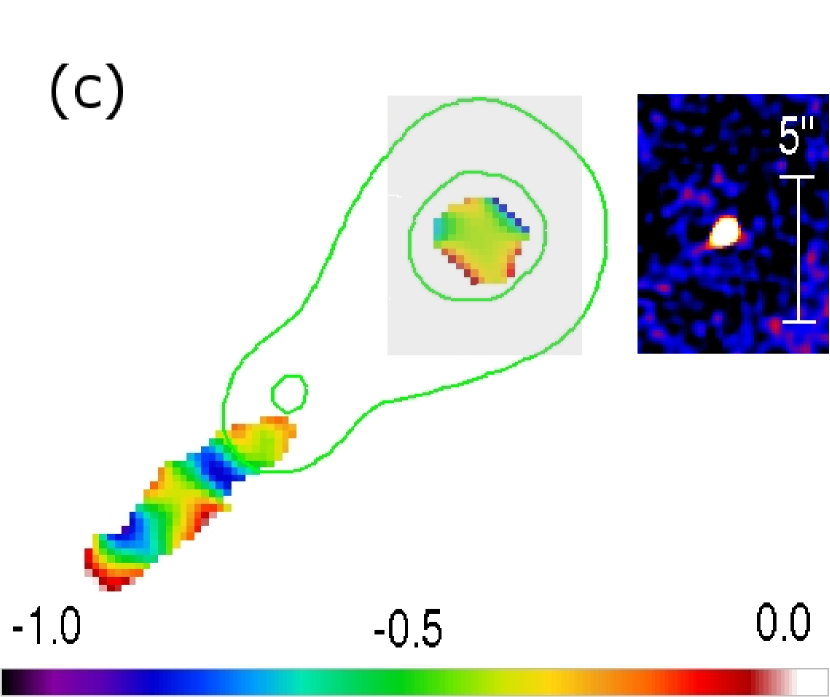
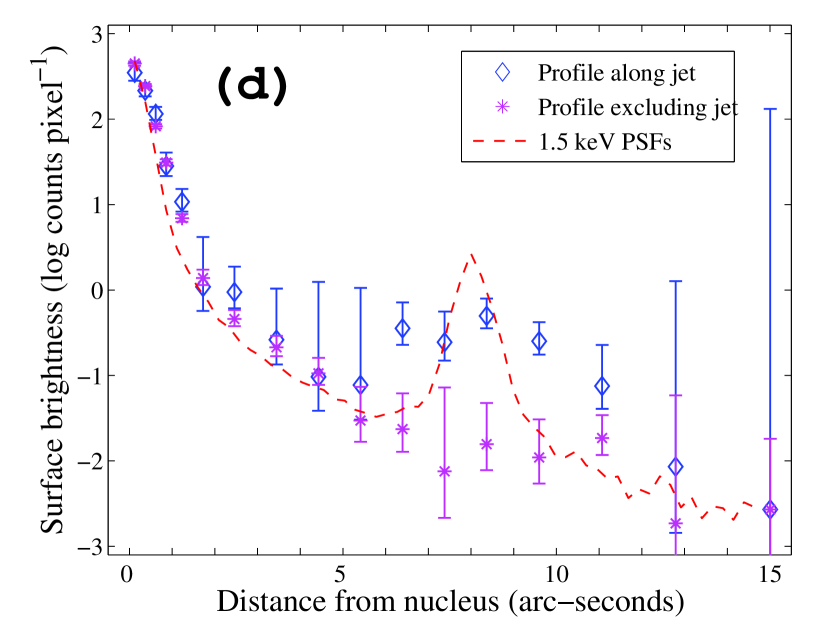
X-ray, optical, and radio images of PG 1004+130 are presented in Figure 1. The 0.5–4 keV X-ray image of Figure 1a has been constructed with ACIS pixel randomization removed to increase angular resolution and is shown with overlaid 4.9 GHz VLA contours; the jet-associated X-ray emission commences upstream of the radio jet and extends to the first radio knot. Examination of the optical HST image with accompaning radio and smoothed X-ray contours reveals no apparent optical counterpart to the SE FR I jet. A spectral index map of PG 1004+130 generated from 4.9 and 1.5 GHz VLA images of 1.5′′ resolution is presented in Figure 1c, along with a high-resolution (0.5′′ FWHM) 5 GHz VLA image of the nuclear region. There does not appear to be any extended kpc-scale inner-jet radio emission from PG 1004+130. The spectral index is 0.41 for the nucleus () and varies along the jet. The error in the spectral index increases greatly toward the edges of the emission, but the signal-to-noise ratio in both bands is quite high down the spine of the jet; the repeated spectral steepening is genuine. We rebinned the X-ray image to 0.05′′ pixels and extracted the radial profile along the SE radio jet (using concentric annular sectors restricted to a 30∘ arc) as well as excluding the jet (using annular sectors covering the remaining 330∘), subtracting background as determined from a nearby rectangular region. The background-subtracted surface-brightness profiles are compared with normalized ACIS-S point spread functions (created with MKPSF) in Figure 1d. As the nucleus contains 1080 counts from 0.5–2 keV and 730 counts from 2–8 keV, the pre-calculated 1.5 keV response data are sufficient for this analysis. The nucleus appears unresolved, but the jet-associated emission is inconsistent with a point-source profile.
We are confident that the jet-associated X-ray emission arises in a genuine counterpart to the SE FR I radio jet due to the low probability of finding a background source so close to the PG 1004+130 nucleus, the high X-ray-to-optical flux ratio of this feature, and the extended nature of the X-ray emission as well as its position upstream of the peak radio brightness in the jet. From Bauer et al. (2004), the expected sky density of sources (primarily AGNs) with 0.5–2 keV X-ray fluxes comparable to or greater than the 1.810-15 erg cm-2 s-1 of the jet is 500 deg-2. Consequently, the probability of finding a background source of appropriate brightness within 10′′ and aligned (within 30∘) with either the jet or counterjet of PG 1004+130 is only 0.002. Further, the lack of any HST point sources coincident with the X-ray emission restricts the nature of any such background source; the optical upper limit yields an X-ray-to-optical flux ratio, as defined by Maccacaro et al. (1988), that is more than 20 (8) times greater than the maximum value for AGNs (BL Lacs) observed by Maccacaro et al. (1988). The X-ray emission is extended along the path of the radio jet, and the peak X-ray brightness in the jet occurs upstream of the peak radio brightness, consistent with the observed trend for the ratio of X-ray-to-radio emission to decrease along jets (e.g., Marshall et al. 2002; Sambruna et al. 2004).
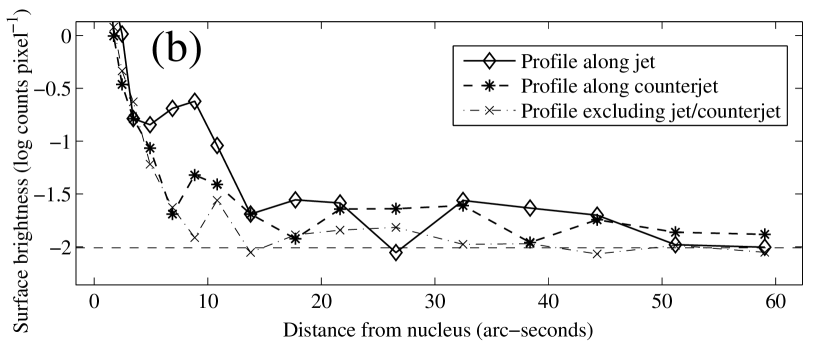
Large-scale diffuse X-ray emission is common within groups and clusters, is sometimes seen in halos around RLQs, and has been observed along radio jets. The intra-group, intra-cluster, and halo X-ray emission is well-established to be thermal radiation from hot gas, but the origin of diffuse X-ray emission along jets is much less certain; IC/CMB scattering has been suggested as a reasonable explanation (e.g., Siemiginowska et al. 2002; Schwartz et al. 2005). We adaptively smoothed the 0.5–4 keV Chandra image to search for diffuse extended emission in the vicinity of PG 1004+130; the resulting image is presented in Figure 2a with overlaid 1.4 GHz FIRST contours. The local environment of PG 1004+130 is sparsely populated; McLure & Dunlop (2001) find that PG 1004+130 has the lowest clustering amplitude among the 13 RLQs they surveyed, and the nearest known companion galaxy lies 33.4′′ (127 projected kpc) to the south-west, with another associated galaxy 45′′ (170 kpc) to the west (Stockton 1978; Bahcall et al. 1997). There does not appear to be any detectable X-ray halo of quasi-spherical, hot, thermally emitting gas around PG 1004+130. The hybrid radio morphology of PG 1004+130 may suggest that the density of the surrounding medium is higher to the SE, where the radio jet is quickly decollimated, than to the NW, where the unseen counterjet powers a distant, edge-brightened lobe, although the lack of any apparent interaction with the few neighboring field galaxies leaves the mechanism for generating such an asymmetrical density distribution unclear. We do not observe any strong gradient in diffuse X-ray emission from the SE to the NW, but naturally this does not prohibit large-scale, asymetrically distributed, colder gas. However, PG 1004+130 does show intriguing diffuse emission along the path of the SE jet and NW counterjet. We verified that this emission was not an artifact of the smoothing process by extracting radial profiles from the rebinned image as with the PSF analysis described previously; here we use the regions indicated in Figure 2a to obtain surface-brightness profiles along the jet, counterjet, and non-jet background (excluding all point sources). Figure 2b shows that beyond 16′′ (past the SE X-ray jet emission), the diffuse emission in the jet and counterjet is similar and clearly surpasses the emission from the non-jet background region; we calculate 29.3 counts above background in the 0.5–4 keV diffuse emission from 16′′ to 63′′ to the SE, and 27.4 to the NW. Note that the ACIS readout streak cannot contribute significantly to the diffuse emission, as it should contain less than 6 total counts over the jet/counterjet region, is offset by 15∘ from the jet position angle, and would extend the entire length of the chip. Extended X-ray emission around RLQs has occasionally been noted to follow the direction of the radio lobes (e.g., Croston et al. 2004; Belsole et al. 2006) but detection of an X-ray counterjet component is somewhat unusual (cf. Schwartz et al. 2005). We briefly consider the nature of this large-scale emission in 4.2.
The X-ray light curves of PG 1004+130 do not reveal significant rapid variability within either the XMM-Newton or the Chandra observations. The cumulative photon arrival times are consistent with a constant count rate with Kolmogorov-Smirnov probabilities of 0.64 and 0.61 for XMM-Newton (pn detector) and Chandra, respectively. The 1 upper limit to the 0.5–8 keV count-rate variability on 1 ks timescales is 12% over the XMM-Newton observation, and 15% over the Chandra observation. After accounting for the relative number of soft (0.5–2 keV) and hard (2–8 keV) band counts, the 1 upper limit to hard band variability is somewhat greater than that for the soft band.
3 X-ray Spectral Analysis
We analyzed the X-ray spectra using the most recent (v12.2.1) XSPEC (Arnaud 1996) software package. Data associated with energies below 0.4 keV or above 8.0 keV were discarded for the purposes of fitting; these cutoffs were imposed due to increasing calibration uncertainties at low energies and declining source counts (due to decreasing instrumental effective area and the spectral shape) as well as increasing background at high energies. All fits include Galactic absorption fixed at 3.931020 cm-2 (Murphy et al., 1996). Joint fitting of the spectra from the XMM-Newton pn, MOS1, and MOS2 detectors increases the signal-to-noise and is consequently preferred in the absence of significant cross-calibration uncertainties. Fitting a simple power-law model gives consistent results (the 90% confidence intervals for both photon index and normalization overlap for the pn, MOS1, and MOS2 detectors), therefore all model parameters with the exception of normalization have been fit jointly throughout the remainder of the analysis. Unless otherwise noted we quote the outcome of fitting various models to the binned spectra with minimization, but the following results agree with those obtained by fitting the ungrouped spectra with the XSPEC -statistic (after Cash 1979).
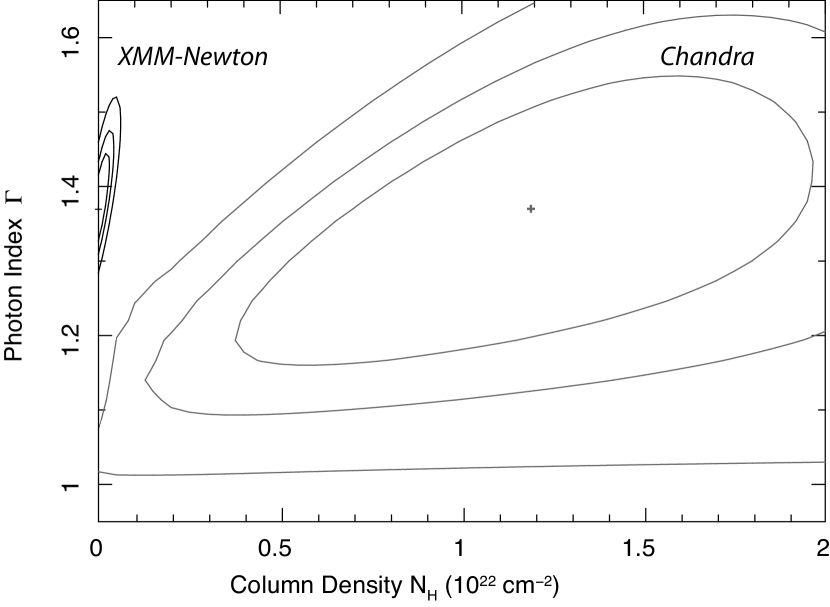
Given the BALs observed in the UV by Wills et al. (1999) and the correlation between BALs and X-ray absorption (e.g., Gallagher et al. 2002), we anticipated potential X-ray absorption at low energies. In an effort to disentangle the underlying power-law from any intrinsic absorption, we initially fit only the data in the 2–8 keV range with a power-law model. The photon index obtained by jointly fitting the pn, MOS1, and MOS2 data from XMM-Newton is = 1.57, consistent with the Chandra result of = 1.52. This photon index is typical for the high-energy spectra of radio-loud quasars (RLQs); e.g., Reeves & Turner (2000) found = 1.66 with = 0.22 for an ASCA sample of 35 RLQs, while Page et al. (2005) determined = 1.55 with = 0.29 for an XMM-Newton sample of 16 RLQs at 2. The 2–8 keV XMM-Newton pn model flux is 2.5710-13 erg cm-2 s-1, 23% lower than the Chandra result of 3.3210-13 erg cm-2 s-1; this flux difference exceeds cross-calibration uncertainties, which are on the order of 12% (S. Snowden 2005, private communication).
Many AGNs with significant X-ray absorption also have strong Fe K emission lines (e.g., see the ASCA observations of Seyfert 2 galaxies by Turner et al. 1997). This was predicted by Krolik & Kallman (1987), who argued that the prominence of iron features produced in the scattering and reflection regions increases as the observed X-ray continuum becomes dominated by reprocessed radiation. Examination of the residuals from the power-law fit described above did not show any obvious emission features in the X-ray spectrum of PG 1004+130. We tested for Fe K emission by adding an unresolved ( = 0.01 keV) redshifted Gaussian emission line to the 2–8 keV power-law model. Here we fit the ungrouped data (with the XSPEC -statistic), as the large energy bins at high energy would tend to smooth out any narrow line in the binned spectra. The XMM-Newton pn and MOS spectra show no evidence for neutral or ionized Fe K emission and an upper limit of 105 eV (90% confidence) can be placed on the rest-frame equivalent width of a narrow line at a fixed rest-frame energy of 6.4 keV from the pn spectrum. Modeling the Chandra spectrum by adding a narrow line at rest-frame 6.4 keV imposes an upper limit of 121 eV on the intrinsic equivalent width. If the line energy is allowed to vary, there is marginal evidence for emission at 6.57 keV; the rest-frame equivalent width of the line is only 105 eV. Since this line energy does not match the transition energy for Fe K emission from either neutral/low ionization (6.4 keV), He-like (6.7 keV), or H-like (6.9 keV) iron, if the marginal detection is assumed to be indicative of physical conditions then there must be a range of ionization states in the scattering material. Overall, the lack of strong Fe K emission argues against a scenario in which the nucleus of PG 1004+130 is heavily absorbed and the weak continuum arises chiefly from scattering or reflection.
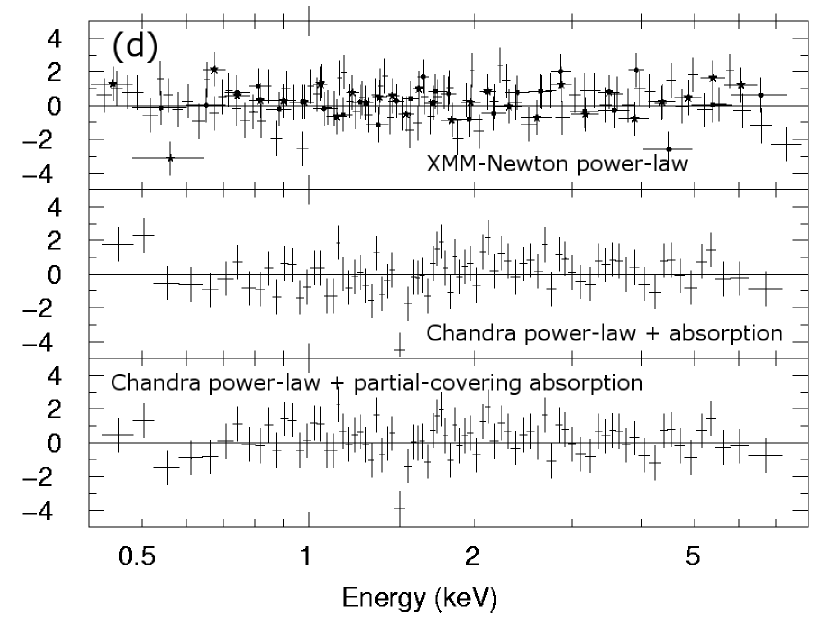
We extrapolated the 2–8 keV power-law fits to lower energies to search for X-ray absorption, as illustrated in Figures 3a and 3b. Many quasars, including radio-loud objects, show enhanced flux above a power-law model below 2 keV (Porquet et al. 2004; Brocksopp et al. 2006); no such soft excess is observed from PG 1004+130. While there is only minimal evidence for intrinsic absorption in the XMM-Newton spectra, the large systematic negative residuals in the Chandra spectrum indicate substantial absorption. This significant change in the absorption properties of PG 1004+130 occurred over only 494 rest-frame days. We characterized this absorption by adding a redshifted neutral absorber to our model and expanding the range of the fit to 0.4–8 keV. The XMM-Newton spectra do not require any intrinsic absorption (the 90% confidence upper limit is 1.61020 cm-2) and the modest negative residuals in Figure 3a disappear in Figure 3d (top) when the photon index is adjusted to = 1.37. Applying this procedure to the Chandra data does indeed indicate the presence of intrinsic absorption, but the negative residuals in the Chandra spectrum of Figure 3b are accomodated primarily through an extreme flattening of the photon index to = 1.13. This model is physically implausible in light of the inconsistency with the best-fit high-energy photon index, and it is also not a particularly good fit (/ = 85/76). A lower limit to the intrinsic absorption indicated by the Chandra spectrum may be obtained by constraining to lie within the 90% errors from the high-energy fit; the resulting column density is 9.291020 cm-2, with fixed at 1.26. The residuals for this fit (shown in Figure 3d, middle) suggest that further refinements to the absorption model are required.
Complex absorption is common in BAL quasars, of both the radio-quiet (e.g., Gallagher et al. 2002) and the radio-loud (Brotherton et al. 2005) types, and thus it is perhaps not surprising that the simple intrinsic-absorption model is insufficient to fit the Chandra spectrum for PG 1004+130. A partial-covering absorber model gives a better representation (/ decreases from 85/76 to 79/75, an improvement with an -test probability of only 0.02 of occuring by chance; see Figure 3d, bottom), with parameters = 1.201022 cm-2, = 0.49, and = 1.37. Here is the fraction of the source emission that passes through an intrinsic redshifted absorber with column density given by the fitted , while the remaining 1 of the source emission experiences only Galactic absorption. Given our photon statistics, we cannot constrain the nature of the absorption complexity in detail, but the physical significance of this result is discussed further in 5.
While variable absorption appears to be required in PG 1004+130, a brief consideration of possible alternative explanations for the discrepancy between the XMM-Newton and Chandra soft-band spectra is warranted. The small-scale jet seen in the Chandra image and unresolved by XMM-Newton is much too weak to explain the differences in the soft X-ray spectra: when the larger XMM-Newton extraction region, which includes the jet, is used to extract a Chandra spectrum, the resulting parameters for the partial-covering absorber model are similar to those found above, with = 0.951022 cm-2, = 0.42, and = 1.30. Another possibility is that the change in the low-energy X-ray spectrum may be due to variable soft-band emission rather than variable absorption. It has been suggested that the “soft-excess” in FR II objects may be related to jet emission (e.g., Evans et al. 2006), and so perhaps a variable unresolved jet might explain the discrepancy between the XMM-Newton and Chandra spectra. The XMM-Newton spectra can also be adequately fitted with a partial-covering absorber with parameters fixed (except for normalization) to the best-fit Chandra values, and an additional “unresolved jet” power-law component with a likely photon index fixed at = 1.8. The “unresolved jet” would then have had to decrease in brightness by a factor of 15 by the Chandra observation; flaring on that order has been observed in the inner jet knot of M87 (Harris et al. 2006), so it is possible (albeit somewhat contrived) that the XMM-Newton observation occurred during a flaring episode. However, the “unresolved jet” must contribute approximately one-fourth of the total XMM-Newton 2–8 keV flux to avoid worsening the fit, and as the XMM-Newton hard-band flux is already observed to be lower than that measured by Chandra, additional variability of the nuclear X-ray emission would be required. The coincidental brightening of the “unresolved jet” during the presumed flare episode to the level necessary to mimic the unbroken, continuous power-law seen in the XMM-Newton spectra further suggests that variable absorption is a more logical explanation than such conspiratorial combinations of variable emission components. Note that disfavoring an additional variable “unresolved jet” component does not impact interpretation of the underlying origin of the entire 0.5–8 keV nuclear X-ray emission, a topic considered further in 5.
The 0.5–2 keV observed fluxes for the best-fit models as described above are 1.0710-13 erg cm-2 s-1 for XMM-Newton and 9.3510-14 erg cm-2 s-1 for Chandra, with 2–8 keV fluxes of 2.6010-13 erg cm-2 s-1 and 3.5610-13 erg cm-2 s-1. The observed 1980 Einstein 0.5–4.5 keV soft-band limit would predict (for a = 1.5 power-law model with Galactic absorption) 0.5–2 keV and 2–8 keV fluxes of 6.710-14 erg cm-2 s-1 and 1.510-13 erg cm-2 s-1, respectively, with a greater uncertainly applying to the high-energy extrapolation; both the XMM-Newton and the Chandra soft and hard-band fluxes are higher than suggested by the Einstein non-detection. The Einstein non-detection cannot be explained by simply increasing the covering factor while holding the column density fixed to the value measured in the Chandra spectrum, as even with =1 the predicted 0.5–4 keV flux is higher than the limit measured by Einstein. If the Einstein non-detection results from variable absorption (rather than emission) then must have been a factor of 3 higher (for =1) to account for the lack of soft-band X-ray flux relative to the Chandra observation. The unabsorbed 0.5–2 keV (rest-frame 0.6–2.5 keV) luminosities are 2.081043 erg s-1 for XMM-Newton and 2.981043 erg s-1 for Chandra, with 2–8 keV (rest-frame 2.5–9.9 keV) luminosities of 4.521043 erg s-1 and 6.441043 erg s-1.
There are sufficient counts to fit the Chandra X-ray jet spectrum with a simple power-law model (assuming fixed Galactic absorption), although the small number of counts necessitates use of the XSPEC -statistic rather than . The best-fit photon index is = 1.71. A power-law model is almost universally appropriate for the X-ray spectra of jets (e.g., Worrall & Birkinshaw 2006), but with the limited counts available here other possibilities cannot be excluded. For example, a themal bremsstrahlung model also yields an acceptable fit (the -statistic value is essentially unchanged) with 5 keV, although the temperature is poorly constrained. The 0.5–2 keV and 2–8 keV fluxes associated with the power-law model are 1.8 and 3.110-15 erg cm-2 s-1, respectively, corresponding to unabsorbed luminosities of 3.6 and 5.31041 erg s-1 (quoted for isotropic, unbeamed emission; see 4.2).
4 Multiwavelength Properties
4.1 The Nucleus
The optical/UV-to-X-ray spectral slope, , describes the ratio of rest-frame luminosity density at 2500 Å to that at 2 keV as ; we take and to have units of erg s-1 Hz-1 throughout. The optical/UV and X-ray luminosities of radio-quiet quasars (RQQs) are correlated (), although not directly proportional (e.g., Strateva et al. 2005; Steffen et al. 2006). This relationship likely reflects a connection between optical/UV emission from the inner accretion disk and X-ray emission arising from Compton upscattering of disk photons in a hot corona. In RLQs this picture is complicated by additional jet emission, and in both RQQs and RLQs absorption can significantly depress X-ray flux. The ratio of optical/UV to X-ray luminosity increases with increasing optical/UV luminosity, which may be expressed as an anti-correlation between and ; Steffen et al. (2006) find = 0.139+2.680 for their sample of unabsorbed RQQs. We compare the value for PG 1004+130 with those of other quasars with 23 and 0.5 in the Palomar-Green (PG; Schmidt & Green 1983) survey.
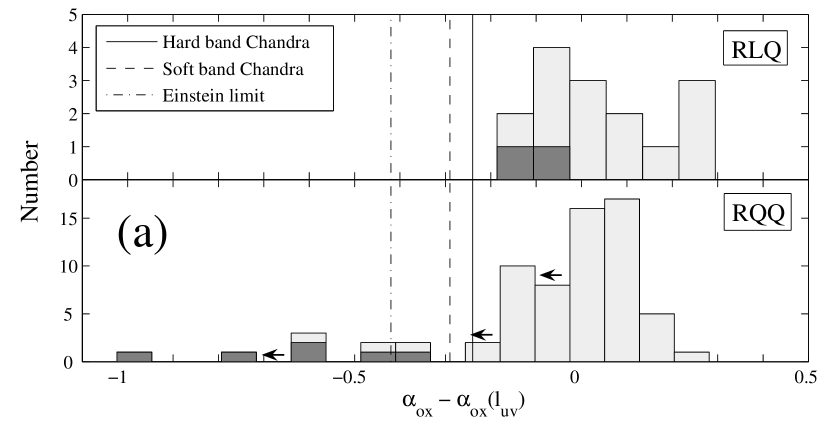
We make use of data from Steffen et al. (2006) for the PG values. They determined monochromatic UV luminosities by extrapolating known 3000 Å values to 2500 Å assuming = 0.5, and used ROSAT pointed and All-Sky Survey PSPC count rates with an assumed = 2 power-law to calculate monochromatic X-ray luminosities. The parameterization of the luminosity dependence of for RLQs is not as accurately known as it is for RQQs. Worrall et al. (1987) find that RLQs with flat radio spectra also have somewhat flatter optical/UV-to-X-ray spectra than steep-spectrum RLQs (which they attribute to stronger jet X-ray emission in the flat-spectrum sources), but both flat-spectrum and steep-spectrum RLQs have correlations with slopes consistent (within the 90% error range) with those of RQQs. We therefore remove the luminosity dependence of using the Steffen et al. (2006) relation for RQQs discussed previously, which we find also orders RLQs adequately for purposes of comparison. The resulting histograms are shown in Figure 4a. While there are some quasars in the negative tail of the RQQ distribution that lack evidence of intrinsic UV or X-ray absorption, those quasars with strong UV absorption all have anomalously steep optical/UV-to-X-ray spectral slopes. The two RLQs with confirmed intrinsic absorption (PG 1309+355 and 2251+113 both show UV and X-ray absorption) similarly have more negative values of luminosity-corrected than most of the unabsorbed RLQs.
The monochromatic UV luminosity for PG 1004+130 was determined from the XMM-Newton OM fluxes and SDSS spectroscopy, as the dates of these measurements are most nearly coincident with those of the X-ray observations. The SDSS spectrum was scaled by SDSS photometric measurements to correct for fiber inefficiencies. Extrapolation to rest-frame 2500 Å was performed by renormalizing a standard (Elvis et al., 1994) RLQ SED to fit the dereddened (Cardelli et al., 1989) optical/UV data; the scaled RLQ SED was matched to the OM UVW1 and UVM1 fluxes and is then only slightly below the continuum of the SDSS spectrum, giving a luminosity density of = 30.51. The monochromatic X-ray luminosity was calculated from the Chandra data for two different best-fit models (see 3 for details), the first a simple power-law fit over the observed 2–8 keV band (yielding a “hard” = 1.83 determined by the high-energy X-ray spectrum) and the second a partial-covering neutral absorption model fit over the observed 0.5–8 keV band (yielding a “soft” = 1.88 primarily influenced by the low-energy X-ray spectrum). The model flux densities were measured at rest-frame 2 keV (observed 1.6 keV) and converted to bandpass-corrected luminosity densities. The results of this analysis are plotted on Figure 3, along with the Einstein 2.01 limit from Elvis & Fabbiano (1984). We note that our is 2.5 times less than that used by Elvis & Fabbiano (1984) to determine , and the Einstein X-ray flux limit with our measurement would give 1.97. The 1973–1990 photographic monitoring of Smith et al. (1993) indicates that PG 1004+130 fluctuates in optical brightness by 0.5 mag on timescales of 6–10 yr. More recently, Garcia et al. (1999; 2006, private communication) found that PG 1004+130 brightened and then dimmed over a magnitude range of = 14.7–15.2 from 1993–1999 (the SDSS 2003 photometry corresponds to = 15.3), and Stalin et al. (2004) found that PG 1004+130 dimmed in by 0.09 magnitudes from 1999 March to 2000 April. The Einstein vs. Chandra discrepancy in values arises from a combination of measurement uncertainties and genuine variability at both optical/UV and X-ray frequencies. The optical/UV-to-X-ray spectral slope is indeed steeper for PG 1004+130 than for other PG RLQs, even if calculated from the hard-band emission, and it is steeper than almost all of the non-absorbed RQQs as well. To differentiate conclusively between excess “big blue bump” emission (see Elvis & Fabbiano 1984) and X-ray weakness as the cause of the low value of , it is helpful to compare the broad-band SED of PG 1004+130 with those of other quasars.
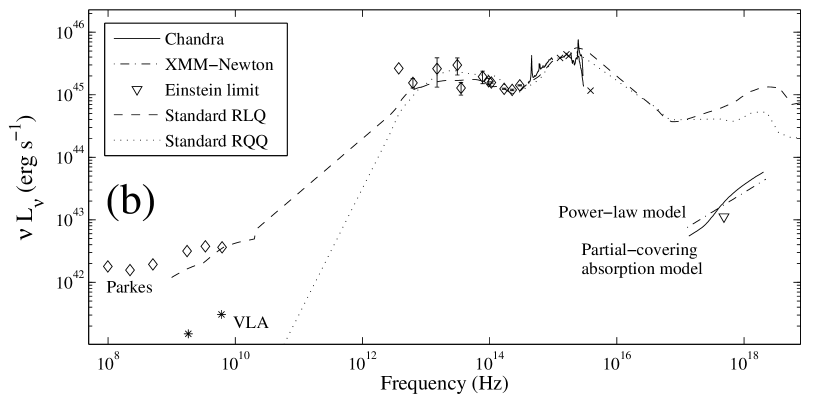
The SED of PG 1004+130 presented in Figure 4b was constructed with radio and IR fluxes, optical and UV spectra and photometry, and the X-ray best-fit models. There are two sets of radio measurements shown: the Parkes data include the extended radio emission, while the VLA data are for the nucleus alone. The optical (SDSS) and UV (HST GHRS and IUE) spectra were smoothed to reduce noise, and the geocoronal Ly region has been excluded. The SDSS spectrum was scaled to match SDSS photometric measurements, as described previously. Data were corrected for Galactic extinction (with = 0.038 mag) following Cardelli et al. (1989). We have included the best-fit XMM-Newton power-law model and the Chandra partial-covering absorber model with parameters as given in 3 (in both cases correcting for Galactic absorption), as well as the 2 keV flux density corresponding to the 0.5–4.5 keV Einstein limit. Bandpass-corrected luminosity densities at radio-to-X-ray rest-frame frequencies for PG 1004+130 are given in Table 1.
Comparing the standard quasar SEDs compiled by Elvis et al. (1994) to that of PG 1004+130 in Figure 4b, there is excellent agreement in the shapes of the SEDs at radio-to-optical/UV frequencies. There does not appear to be evidence for enhanced UV emission (relative to the radio, IR, and optical data), but PG 1004+130 is distinctly X-ray weak relative to RLQs with comparable optical/UV luminosities. Removing the intrinsic absorption apparent in the Chandra spectrum partially accounts for the weakness of the X-ray emission, but the unabsorbed Chandra and XMM-Newton power-law spectra remain below the standard RLQ X-ray emission. Some of this apparent X-ray weakness may be a consequence of the chosen method of comparison, as the Elvis et al. (1994) composite SEDs are biased toward X-ray bright objects due to selection criteria requiring an Einstein detection. Indeed, the average of the RLQs used to contruct the standard SED plotted in Figure 4b is = 1.31, corresponding to relatively greater X-ray luminosities than the = 1.54 average of the PG RLQs. However, the “hard” = 1.83 for PG 1004+130 is still 1.2 below the average of the PG RLQs; the corresponding ratio by which PG 1004+130 is X-ray weak relative to other PG RLQs is 5.4 (for similar optical/UV luminosities).
The black-hole mass for PG 1004+130 is found by Vestergaard & Peterson (2006) to be 1.87 109 M⊙ (from the FWHM of the H line and the monochromatic optical luminosity at 5100 Å), while Falomo et al. (2003) estimate a mass of 1.35 109 M⊙ (from the – relation). The black-hole masses calculated for PG 1004+130 using these different methods are in general agreement and correspond to an Eddington luminosity of 2 1047 erg s-1. We measure the bolometric luminosity for PG 1004+130 by integrating the scaled standard SED up to X-ray frequencies, then integrating the best-fit power-law model from rest-frame 0.5–10 keV, and obtain = 2.0 1046 erg s-1. The observed X-ray emission may not be representative of the true X-ray power of the source (see 5); if instead the scaled standard SED is integrated to 10 keV, the bolometric luminosity is slightly higher, = 2.3 1046 erg s-1. Both calculations suggest that PG 1004+130 is radiating at 10-1 LEdd.
4.2 The Jet
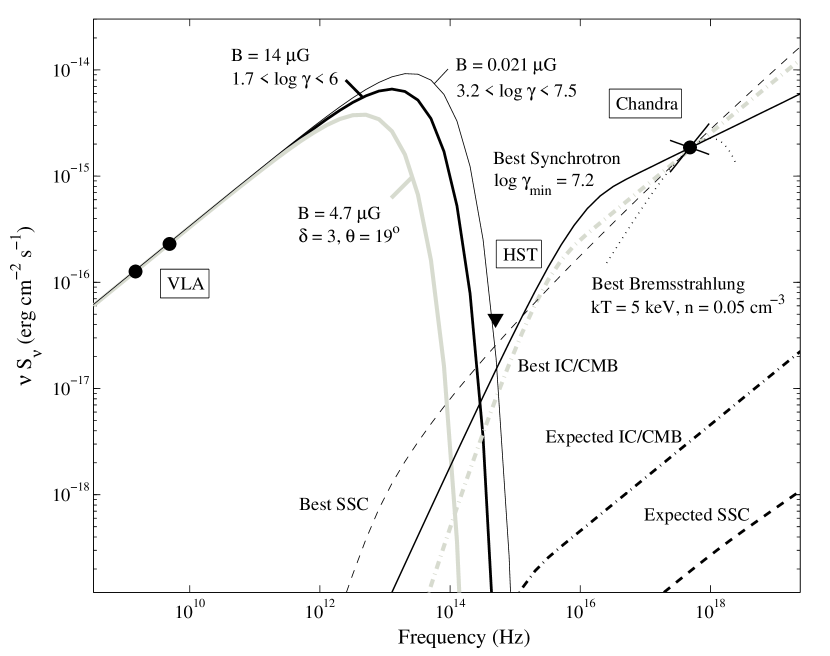
The SE radio jet is made up of a string of emission peaks (knots), presumably indicating distinct shock sites where particle acceleration takes place. The spectral index steepens downstream of each knot (see Figure 1c), perhaps reflecting an evolution in the underlying electron distribution. The observed-frame lifetimes for synchrotron cooling for plausible magnetic-field strengths are quite long, corresponding to scales orders of magnitude longer than these projected distances, so if spectral aging is the dominant factor behind this effect the electrons must remain trapped within the shock region for long periods before diffusing downstream. The X-ray emission begins upstream of the first bright radio knot, and there does not appear to be any jet-associated optical emission. Radio fluxes were extracted from the region encompassing the first knot, overlapping with the end of the X-ray jet extraction region indicated in Figure 1a and extending a short distance beyond it. A 5 optical upper limit was determined from the noise in the HST image within the X-ray jet extraction region. The 2 keV taken from the power-law fit to the jet X-ray spectrum and the error bars on are plotted in Figure 5 along with the HST limit and the VLA fluxes. The power-law fit for the jet is consistent with the 1.5 photon indices found by Sambruna et al. (2004) for the brightest X-ray knots in their Chandra and HST survey of core-dominated FR II quasars with known radio jets; however, the X-ray spectra of prominent knots in FR I jets are generally steeper, with 2.3 (e.g., 3C 66B: Hardcastle et al. 2001; 3C 31: Hardcastle et al. 2002; M 87: Marshall et al. 2002; Cen A: Hardcastle et al. 2003; B2 0755+37: Parma et al. 2003). The = 0.87 value for PG 1004+130 is similar to those seen for both FR I (FR I jet references as above) and FR II (Sambruna et al. 2004; Marshall et al. 2005) jets. The PG 1004+130 jet optical limit falls well below the power law connecting the radio and X-ray data, ruling out simple single-component synchrotron models. The broad-band spectral indices are constrained to be 1.1, 0.46, and consequently 2.3. These values are similar to those found for FR II jets (Sambruna et al. 2004) but are inconsistent with those of FR I jets, which tend to have 0.7, 1.2, and thus 0.6 (FR I jet references as above). Despite its standard FR I radio structure, the SE PG 1004+130 jet shares many of the characteristics of well-known FR II jets.
While the agreement between the multiwavelength characteristics of the SE FR I jet and powerful FR II jets initially appears somewhat surprising, this result might have been anticipated based on the radio luminosity and hybrid morphology of PG 1004+130. The radio luminosity density at rest-frame 178 MHz of PG 1004+130 is 7.1 1033 erg s-1 Hz-1 (from the flux measurement of Wright & Otrupcek 1990), more than an order of magnitude above the 2 1032 erg s-1 Hz-1 luminosity density found by Fanaroff & Riley (1974) to divide empirically the lower power FR I population from the higher power FR II sources. More recently, the radio power separating FR I from FR II sources has been observed to be an increasing function of the host galaxy optical luminosity (e.g., Ledlow & Owen 1996), and the optical magnitude (24.26; Falomo et al. 2003) of its elliptical host (Bahcall et al., 1997) places PG 1004+130 somewhat closer to the observed transition line.333As noted by Scarpa & Urry (2001), the underlying radio and optical luminosity functions lead naturally to an anti-correlation of radio power with host luminosity, and hence host luminosity need not be physically indicative of radio characteristics. Further, the NW lobe of PG 1004+130 has standard edge-brightened FR II structure. If hybrid morphology sources are reflective of dissimilar environments rather than dissimilar jets, as suggested by Gopal-Krishna & Wiita (2000), then the SE FR I jet should be as intrinsically powerful as the NW FR II jet.
We have applied various models to the multiwavelength jet emission with the goal of determining the most plausible origin for the X-ray emission. The results of this analysis are described below and representative models are shown in Figure 5. The radio-to-optical emission in jets is well-established as synchrotron radiation, with the principle observational support coming from polarization measurements. The radio data and optical limit allow determination of the magnetic field, assuming equipartition. Based on the VLA images we estimate the emission region to be roughly circular with a radius of around 1.75′′, corresponding to a spherical volume of 3.61067 cm3. As is standard practice, we assume a power-law electron energy distribution, with index =2 to match the spectral slope of the VLA radio data (see Figure 1c). The low energy cutoff for the electron spectrum is observationally unconstrained, and we choose =50, similar to values typically assumed for FR II jets. The high energy cutoff is limited by the HST non-detection, and we use =106. In the case of PG 1004+130, the large angular size, the high lobe-to-core ratio, and the optical-to-radio core luminosity ratio suggest the jet is inclined to the line-of-sight by 45∘, which would limit the allowed beaming to 1.4. We consider here the =1 case. We use standard synchrotron formulae (e.g., Worrall & Birkinshaw 2006) for a single-injection model with pitch-angle isotropization (Jaffe & Perola 1973). A continuous-injection model, in which the spectral slope steepens by 0.5 above a critical frequency (e.g., Carilli et al. 1991), would still require an exponential cutoff at frequencies below the optical limit, but a Kardashev-Pacholczyk (Kardashev 1962; Pacholczyk 1970) model with no pitch-angle scattering would allow a synchrotron cutoff at higher frequencies. The precise slope of the synchrotron spectrum above the turnover frequency does not greatly affect the X-ray emission, so a Kardashev-Pacholczyk or continuous-injection model would lead to similar qualitative conclusions. We derive a magnetic field strength = 14 G, and note that in general = / (e.g., Harris & Krawczynski 2002).
A natural explanation for the origin of the X-ray emission would be Compton upscattering by the synchrotron electrons. We consider two sources of seed photons: the synchrotron radiation itself (SSC; e.g., Hardcastle et al. 1997) or the cosmic microwave background (IC/CMB; e.g. Tavecchio et al. 2000; Celotti et al. 2001). At the distance of the X-ray jet, the photon flux from the AGN or from the host galaxy is comparatively insignificant. The X-ray emission expected from the SSC process with the above parameters is more than three orders of magnitude less than the observed X-ray flux. The X-ray SSC emission increases relative to the synchrotron emission if the magnetic-field strength decreases, but radically sub-equipartition fields are required to attribute the observed X-ray flux to SSC emission. A representative model of this type is included in Figure 5. Both the high and low electron-energy cutoffs have been adjusted to accommodate the optical limit (10107.5) but given the = 2 power-law distribution and the consistent span of 4.3 decades in energy the equipartion magnetic field remains 14 G. The actual magnetic field required to fit the X-ray flux is then 0.021 G, several hundred times less than the equipartion value. IC/CMB is often put forward as an explanation for the concave SEDs of powerful FR II jets, and this process is particularly efficient for high-redshift, relativistic jets inclined close to the line of sight. Unlike SSC, which is actually depressed by beaming, X-ray IC/CMB emission is boosted by an additional factor of 1+ relative to synchrotron emission (Dermer 1995). In the case of PG 1004+130, the expected IC/CMB emission is still several hundred times less than the observed X-ray emission; the enhanced beaming required to match the X-ray flux, =3.0, would place an upper limit (where = ) on the jet angle of 19∘, smaller than the 45∘ suggested from the optical and radio luminosities as well as the radio morphology (see 1). Further, the lifetime of the low-energy electrons ( 102) responsible for the X-ray emission in IC/CMB models greatly surpasses the length of the jet, and so X-ray emission would be expected to persist along the jet (absent deceleration; e.g., Georganopoulos & Kazanas 2004). Despite the similarities in PG 1004+130 to the SEDs and X-ray spectra of the core-dominated, highly beamed FR II jets that dominate the surveys of both Sambruna et al. (2004) and Marshall et al. (2005), the IC/CMB model commonly applied to such FR II jets does not appear to be appropriate for PG 1004+130. For both SSC and IC/CMB models, the location of the X-ray emission largely upstream of the parent synchrotron electrons is difficult to explain and the predicted X-ray spectral slope is flatter than observed. We consider it unlikely that the X-ray emission arises from either SSC or IC/CMB emission.
If the X-ray jet emission does not arise as a consequence of the low-energy synchrotron radiation (as in the SSC and IC/CMB cases), then various other emission mechanisms may be considered, such as thermal bremsstahlung or synchrotron emission from a secondary population of high-energy electrons (e.g., Atoyan & Dermer 2004). The offset of the X-ray and radio emission is perhaps more easily accomodated by such models. The X-ray emission occupies a rectangular region of approximately 5′′ by 2.4′′; for an edge-on cylinder this again corresponds to a volume of 3.61067 cm3. The best-fit temperature for a bremsstrahlung model is 5 keV, but this is only poorly constrained. Neglecting line emission (which contributes significantly to the soft X-ray emission at lower temperatures), a gas cloud with an average ion charge of 1 would be required to have a density of 0.05 cm-3 to account for the observed X-ray flux. This corresponds to a total mass of 1.5109 M⊙ and an ideal-gas pressure of 4.610-10 dynes cm-2. Such a large quantity of concentrated hot gas at so great a distance from the host galaxy seems unlikely, and as this gas cloud would be overpressured with respect to the surrounding IGM we would have to be observing it at a favorable time before it dispersed. If instead the X-ray emission from PG 1004+130 arises from a second synchrotron component generated by a population of highly relativistic electrons, the low-energy cutoff must be high enough to avoid over-predicting the optical flux. Taking the magnetic field to be 14 G and setting the electron energy index to be =2.4 as indicated by the X-ray photon index, this model provides an acceptable explanation of the X-ray emission with =1.6107, as shown in Figure 5. As the lifetime of the X-ray synchrotron electrons is quite short (electrons initially associated with 1 keV emission would have half lives of 600 years), multiple acceleration or injection sites are required along the extent of the X-ray jet. Electrons with these injection parameters would lose sufficient energy within 30,000 years to produce fluxes at optical frequencies in excess of the observed HST limit, suggesting that the energetic electrons escape the shock region before cooling to energies below 3106.
The diffuse emission extends 40–50′′ (150–190 projected kpc) from the nucleus to both the SE and the NW, tracing the path of the FR I radio jet and providing supporting evidence for the presence of the hidden FR II counterjet. There are insufficient counts for spectral analysis, but with an assumed =1.8 power law the 0.5–8 keV X-ray flux of the SE component is 4.510-15 erg cm-2 s-1, while that of the NW component is 4.210-15 erg cm-2 s-1. Most radio jets are one-sided, with the absence of a detectable counterjet generally attributed to Doppler boosting and hence yielding a constraint upon the line-of-sight angle. As the line-of-sight angle for PG 1004+130 is likely 45∘, the jet/counterjet flux ratio for twin jets is expected to be less than 15 (using and = = 1/ = 1.4; e.g., Worrall & Birkinshaw 2006). However, the observed ratio of radio emission in the SE jet to that in the undetected NW counterjet exceeds 100, indicating that Doppler boosting alone cannot explain the lack of a radio counterjet in PG 1004+130. The diffuse X-ray emission precludes the possibility of an intrinsically one-sided jet, leading us to hypothesize that the entraining environment is indeed less dense to the NW, as suggested by the hybrid radio morphology.
If the diffuse X-ray emission is thermal radiation, then the required gas density is 4.510-4 cm-3 with a total mass of 2.31011 M⊙ and a pressure of 1.510-12 dynes cm-2; while these parameters are not as restrictive as those for the thermal jet models, similar concerns apply. The mechanism for heating the gas along the jet is unclear, and a non-thermal origin seems somewhat more plausible. SSC emission alone is not a viable explanation for the diffuse X-ray emission, as the absence of a detectable radio counterjet to the NW imposes a stringent limit to the available synchrotron photon density above 1 GHz, and the concurrent lack of energetic electrons makes boosting to X-ray frequencies difficult. The diffuse X-ray emission could result from unbeamed IC/CMB emission, and indeed its apparently smooth extent along the entire jet suggests an association with long-lived electrons. The paucity of radio emission in the NW counterjet region does not greatly affect the IC/CMB X-ray yield, which is driven by low-energy electrons associated with sub-GHz synchrotron radiation. Diffuse X-ray emission unaccompanied by detectable radio emission has been observed in a handful of additional sources and can be successfully attributed to IC/CMB processes in those cases as well (e.g., Siemiginowska et al. 2002; Schwartz et al. 2005). The VLA C band limit on radio emission in the NW counterjet allows for considerable leeway in determing the high-energy cutoff and magnetic field required to generate sufficient diffuse X-ray emission via the IC/CMB process. For = 50 and = 103.5, the magnetic field is required to be lower (2 G) than in the jet region, with equipartition electron densities 30 times less than in the knots.
5 Results and Discussion
The primary results from our analysis of the first X-ray detections and spectra of PG 1004+130 are the following:
1. Variable complex absorption: Although the XMM-Newton observation of PG 1004+130 shows only minimal intrinsic absorption, the Chandra spectrum reveals significant soft X-ray absorption that cannot be modeled by a simple redshifted neutral absorber. The best-fit parameters for the preferred partial-covering model are = 1.201022 cm-2, = 0.49, and = 1.37. The 2–8 keV XMM-Newton flux is 23% lower than the 2–8 keV Chandra flux.
2. X-ray weakness: PG 1004+130 has the lowest luminosity-corrected value of among the PG RLQs, and after correcting for intrinsic absorption it is 5.4 times weaker in X-rays than the other PG RLQs, when normalizing to similar optical/UV luminosities. Examination of the SED of PG 1004+130 confirms that the anomalous value of is due to X-ray weakness rather than optical/UV brightness.
3. X-ray jet: The Chandra image reveals an X-ray counterpart to the SE radio FR I jet. The jet is undetected by HST, ruling out simple single-component synchrotron emission models, and both the X-ray spectrum and the multiwavelength SED shape are similar to those observed for prominent knots in FR II jets. Diffuse X-ray emission is observed along the path of the jet and counterjet.
Complex X-ray absorption is common in radio-quiet BAL quasars (e.g., Gallagher et al. 2002, 2006) and may be inferred by X-ray weakness coupled with relatively soft X-ray spectra for radio-loud BAL quasars as well (Brotherton et al. 2005). There is precedent for variable X-ray absorption such as that seen in PG 1004+130; Gallagher et al. (2004) found that PG 2112+059 showed a factor of 7 increase in intrinsic over three years (483 rest-frame days). The more absorbed Chandra spectrum for PG 2112+059 required either an ionized or partially covering absorber to fit the flat soft X-ray region and also revealed Fe K emission undetectable against the higher continuum of the earlier ASCA observation, with a rest-frame equivalent width of 1050 eV. The best-fit for PG 1004+130 is relatively low compared with that of most radio-quiet BAL quasars, as is the covering fraction (cf. Green et al. 2001). Together these results suggest that the nature of the X-ray absorber is broadly similar in radio-quiet and radio-loud BAL quasars, but that the column density associated with the observed X-ray absorption is lower in radio-loud BAL quasars, somewhat analogous to the trend for UV absorption to be stronger in radio-quiet BAL quasars than in radio-loud BAL quasars (Becker et al., 2000).
Although notably X-ray weak relative to non-BAL RLQs, PG 1004+130 is not as X-ray weak as the BAL RLQs examined by Brotherton et al. (2005), and it is possible that PG 1004+130 is simply an intrinsically X-ray weak RLQ that also shows variable absorption. Alternative hypotheses as to the cause of the X-ray weakness of PG 1004+130 are constrained by the characteristics of the XMM-Newton and Chandra spectra. The X-ray weakness cannot be attributed solely to attenuation by simple intrinsic neutral absorption, as the required high column densities would result in X-ray spectra significantly harder than observed. If much of the intrinsic X-ray emission is hidden by heavy absorption of significantly higher column density (51023 cm-2) than that indicated by the flat spectral shape, the observed X-ray spectrum could result from photons leaking through “holes” in the absorber or scattering off a “torus” or electron-cloud mirror into the line of sight. However, the absence of strong Fe K emission is somewhat surprising if the latter scenario is correct, and PG 1004+130 is actually brighter in X-rays than expected for a reflection-dominated continuum. If the nucleus is obscured for photon energies up to 8 keV (or extremely weak in X-rays), it is also possible that we are viewing X-ray emission from a subparsec-scale jet; this may provide a natural explanation for the absence of prominent Fe K emission, as well as the observed lack of excess low-energy emission that distinguishes the X-ray spectra of PG 1004+130 from those of other quasars.
Motivated by the observed correlation between radio and optical luminosity for narrow-line radio galaxies, Chiaberge et al. (2000) suggested a synchrotron origin for the nuclear optical emission from these sources. This correlation has been extended to the X-ray band by Evans et al. (2006), who argue that FR I RLQs derive a significant fraction of their (generally unabsorbed) nuclear X-ray emission from an unresolved jet, while FR II RLQs are dominated by (absorbed) accretion-powered X-ray emission but also contain a jet spectral component. In the particular case of PG 1004+130, the complexity and intermediate column density of the absorption in the observed Chandra X-ray spectrum could plausibly be attributed to viewing the jet through progressively diminishing BAL-wind column densities with increasing distance from the nucleus. X-ray spectra with improved photon statistics and resolution are required to constrain better the physical nature of the nuclear X-ray emission, or it may also be possible to detect direct X-rays in the 8–200 keV band if the putative absorption does not exceed 21024 cm-2 (e.g., Matt 2002). Detection of rapid X-ray variability would restrict the size of the emission region and limit the degree to which reprocessed radiation could contribute to the observed continuum, but neither the XMM-Newton nor the Chandra observation shows such variability.
Identification of the X-ray emission mechanism in the PG 1004+130 jet would be aided by an optical detection of the jet and determination of the frequency and nature of the break in the SED between radio and X-ray wavelengths. However, we consider it unlikely that the X-ray jet is dominated by IC/CMB emission, and instead favor the X-ray emission arising from a second synchrotron component. As with other X-ray jets (e.g., Marshall et al. 2002; Sambruna et al. 2004), the X-ray jet of PG 1004+130 peaks in brightness upstream of the brightest radio knot. This suggests that X-ray synchrotron emission may be more prominent in the inner jet, either because of stronger magnetic fields or a supply of highly energetic electrons (e.g., Sambruna et al. 2004). The agreement in the multiwavelength properties of the PG 1004+130 jet with those of other FR II jets indicates that the FR I radio morphology is likely due to propagation into a dense environment rather than intrinsically lower power, as suggested by Gopal-Krishna & Wiita (2000). The orientation of the jet axis demonstrates that concave jet SEDs can arise without substantial beaming. The diffuse X-ray emission traces the path of the jet and hidden counterjet and suggests that low-energy electrons inhabit the entire length from nucleus to lobes, more consistent with continuous jet emission from the central engine than with sporadic activity (e.g., Stawarz et al. 2004).
References
- Arnaud (1996) Arnaud, K. A. 1996, ASP Conf. Ser. 101: Astronomical Data Analysis Software and Systems V, ed. G. H. Jacoby & J. Barnes (San Francisco: ASP), 17
- Atoyan & Dermer (2004) Atoyan, A., & Dermer, C. D. 2004, ApJ, 613, 151
- Bahcall et al. (1997) Bahcall, J. N., Kirhakos, S., Saxe, D. H., & Schneider, D. P. 1997, ApJ, 479, 642
- Bassett et al. (2004) Bassett, L. C., Brandt, W. N., Schneider, D. P., Vignali, C., Chartas, G., & Garmire, G. P. 2004, AJ, 128, 523
- Bauer et al. (2004) Bauer, F. E., Alexander, D. M., Brandt, W. N., Schneider, D. P., Treister, E., Hornschemeier, A. E., & Garmire, G. P. 2004, AJ, 128, 2048
- Becker et al. (1995) Becker, R. H., White, R. L., & Helfand, D. J. 1995, ApJ, 450, 559
- Becker et al. (2000) Becker, R. H., White, R. L., Gregg, M. D., Brotherton, M. S., Laurent-Muehleisen, S. A., & Arav, N. 2000, ApJ, 538, 72
- Brandt et al. (2000) Brandt, W. N., Laor, A., & Wills, B. J. 2000, ApJ, 528, 637
- Brocksopp et al. (2006) Brocksopp, C., Starling, R. L. C., Schady, P., Mason, K. O., Romero-Colmenero, E., Puchnarewicz, E. M. 2006, MNRAS, 366, 953
- Brotherton et al. (2005) Brotherton, M. S., Laurent-Muehleisen, S. A., Becker, R. H., Gregg, M. D., Telis, G., White, R. L., & Shang, Z. 2005, AJ, 130, 2006
- Cardelli et al. (1989) Cardelli, J. A., Clayton, G. C., & Mathis, J. S. 1989, ApJ, 345, 245
- Carilli et al. (1991) Carilli, C. L., Perley, R. A., Dreher, J. W., & Leahy, J. P. 1991, ApJ, 383, 554
- Cash (1979) Cash, W. 1979, ApJ, 228, 939
- Celotti et al. (2001) Celotti, A., Ghisellini, G., & Chiaberge, M. 2001, MNRAS, 321, L1
- Chiaberge et al. (2000) Chiaberge, M., Capetti, A., & Celotti, A. 2000, A&A, 355, 873
- Croston et al. (2004) Croston, J. H., Birkinshaw, M., Hardcastle, M. J., & Worrall, D. M. 2004, MNRAS, 353, 879
- Dermer (1995) Dermer, C. D. 1995, ApJ, 446, L63
- Elvis & Fabbiano (1984) Elvis, M., & Fabbiano, G. 1984, ApJ, 280, 91
- Elvis et al. (1994) Elvis, M., et al. 1994, ApJS, 95, 1
- Eracleous & Halpern (2004) Eracleous, M., & Halpern, J. P. 2004, ApJS, 150, 181
- Evans et al. (2006) Evans, D. A., Worrall, D. M., Hardcastle, M. J., Kraft, R. P., & Birkinshaw, M. 2006, ApJ, 642, 96
- Falomo et al. (2003) Falomo, R., Carangelo, N., & Treves, A. 2003, MNRAS, 343, 505
- Fanaroff & Riley (1974) Fanaroff, B. L., & Riley, J. M. 1974, MNRAS, 167, 31P
- Fomalont (1982) Fomalont, E.B., in Origin of Cosmic Rays, IAU Symp. 94, eds. Setti, G., Spada, G., & Wolfendale, A. W., Reidel, Dordrecht, Holland
- Gallagher et al. (2002) Gallagher, S. C., Brandt, W. N., Chartas, G., & Garmire, G. P. 2002, ApJ, 567, 37
- Gallagher et al. (2004) Gallagher, S. C., Brandt, W. N., Wills, B. J., Charlton, J. C., Chartas, G., & Laor, A. 2004, ApJ, 603, 425
- Gallagher et al. (2006) Gallagher, S. C., Brandt, W. N., Chartas, G., Priddey, R., Garmire, G. P., & Sambruna, R. M. 2006, ApJ, 644, 709
- Garcia et al. (1999) Garcia, A., Sodré, L., Jablonski, F. J., & Terlevich, R. J. 1999, MNRAS, 309, 803
- Garmire et al. (2003) Garmire, G. P., Bautz, M. W., Ford, P. G., Nousek, J. A., & Ricker, G. R. 2003, Proc. SPIE, 4851, 28
- Georganopoulos & Kazanas (2004) Georganopoulos, M., & Kazanas, D. 2004, ApJ, 604, L81
- Gopal-Krishna & Wiita (2000) Gopal-Krishna, & Wiita, P. J. 2000, A&A, 363, 507
- Green et al. (2001) Green, P. J., Aldcroft, T. L., Mathur, S., Wilkes, B. J., & Elvis, M. 2001, ApJ, 558, 109
- Gregg et al. (2000) Gregg, M. D., Becker, R. H., Brotherton, M. S., Laurent-Muehleisen, S. A., Lacy, M., & White, R. L. 2000, ApJ, 544, 142
- Hardcastle et al. (2001) Hardcastle, M. J., Birkinshaw, M., & Worrall, D. M. 2001, MNRAS, 326, 1499
- Hardcastle et al. (2002) Hardcastle, M. J., Worrall, D. M., Birkinshaw, M., Laing, R. A., & Bridle, A. H. 2002, MNRAS, 334, 182
- Hardcastle et al. (2003) Hardcastle, M. J., Worrall, D. M., Kraft, R. P., Forman, W. R., Jones, C., & Murray, S. S. 2003, ApJ, 593, 169
- Hardcastle et al. (2004) Hardcastle, M. J., Harris, D. E., Worrall, D. M., & Birkinshaw, M. 2004, ApJ, 612, 729
- Hardcastle (2006) Hardcastle, M. J. 2006, MNRAS, 134
- Harris et al. (2006) Harris, D. E., Cheung, C. C., Biretta, J. A., Sparks, W. B., Junor, W., Perlman, E. S., & Wilson, A. S. 2006, ApJ, 640, 211
- Harris & Krawczynski (2002) Harris, D. E., & Krawczynski, H. 2002, ApJ, 565, 244
- Hewett & Foltz (2003) Hewett, P. C., & Foltz, C. B. 2003, AJ, 125, 1784
- Jaffe & Perola (1973) Jaffe, W. J., & Perola, G. C. 1973, A&A, 26, 423
- Jansen et al. (2001) Jansen, F., et al. 2001, A&A, 365, L1
- Kardashev (1962) Kardashev, N. S. 1962, Soviet Astronomy, 6, 317
- Krolik & Kallman (1987) Krolik, J. H., & Kallman, T. R. 1987, ApJ, 320, L5
- Ledlow & Owen (1996) Ledlow, M. J., & Owen, F. N. 1996, AJ, 112, 9
- Lewis et al. (2003) Lewis, G. F., Chapman, S. C., & Kuncic, Z. 2003, ApJ, 596, L35
- Lopez et al. (2006) Lopez, L. A., Brandt, W. N., Vignali, C., Schneider, D. P., Chartas, G., Garmire, G. P. 2006, AJ, 131, 1914
- Maccacaro et al. (1988) Maccacaro, T., Gioia, I. M., Wolter, A., Zamorani, G., & Stocke, J. T. 1988, ApJ, 326, 680
- Marshall et al. (2002) Marshall, H. L., Miller, B. P., Davis, D. S., Perlman, E. S., Wise, M., Canizares, C. R., & Harris, D. E. 2002, ApJ, 564, 683
- Marshall et al. (2005) Marshall, H. L., et al. 2005, ApJS, 156, 13
- Matt (2002) Matt, G. 2002, Royal Society of London Philosophical Transactions Series A, 360, 2045
- McLure & Dunlop (2001) McLure, R. J., & Dunlop, J. S. 2001, MNRAS, 321, 515
- Menou et al. (2001) Menou, K., et al. 2001, ApJ, 561, 645
- Miller et al. (1993) Miller, P., Rawlings, S., & Saunders, R. 1993, MNRAS, 263, 425
- Murphy et al. (1996) Murphy, E. M., Lockman, F. J., Laor, A., & Elvis, M. 1996, ApJS, 105, 369
- Murray et al. (1995) Murray, N., Chiang, J., Grossman, S. A., & Voit, G. M. 1995, ApJ, 451, 498
- Pacholczyk (1970) Pacholczyk, A. G. 1970, Series of Books in Astronomy and Astrophysics, San Francisco: Freeman, 1970
- Page et al. (2005) Page, K. L., Reeves, J. N., O’Brien, P. T., & Turner, M. J. L. 2005, MNRAS, 364, 195
- Parma et al. (2003) Parma, P., de Ruiter, H. R., Capetti, A., Fanti, R., Morganti, R., Bondi, M., Laing, R. A., & Canvin, J. R. 2003, A&A, 397, 127
- Porquet et al. (2004) Porquet, D., Reeves, J. N., O’Brien, P., & Brinkmann, W. 2004, A&A, 422, 85
- Proga et al. (2000) Proga, D., Stone, J. M., & Kallman, T. R. 2000, ApJ, 543, 686
- Reeves & Turner (2000) Reeves, J. N., & Turner, M. J. L. 2000, MNRAS, 316, 234
- Reichard et al. (2003) Reichard, T. A., et al. 2003, AJ, 126, 2594
- Sambruna et al. (2004) Sambruna, R. M., Gambill, J. K., Maraschi, L., Tavecchio, F., Cerutti, R., Cheung, C. C., Urry, C. M., & Chartas, G. 2004, ApJ, 608, 698
- Scarpa & Urry (2001) Scarpa, R., & Urry, C. M. 2001, ApJ, 556, 749
- Schmidt & Green (1983) Schmidt, M., & Green, R. F. 1983, ApJ, 269, 352
- Schwartz et al. (2005) Schwartz, D. A., Marshall, H. L., Gelbord, J. M., et al. 2005, in ’The X-ray Universe 2005’, ESA Press, Noordwijk
- Schwartz (2002) Schwartz, D. A. 2002, ApJ, 569, L23
- Siemiginowska et al. (2002) Siemiginowska, A., Bechtold, J., Aldcroft, T. L., Elvis, M., Harris, D. E., & Dobrzycki, A. 2002, ApJ, 570, 543
- Siemiginowska et al. (2003) Siemiginowska, A., Smith, R. K., Aldcroft, T. L., Schwartz, D. A., Paerels, F., & Petric, A. O. 2003, ApJ, 598, L15
- Spergel et al. (2003) Spergel, D. N., et al. 2003, ApJS, 148, 175
- Sprayberry & Foltz (1992) Sprayberry, D., & Foltz, C. B. 1992, ApJ, 390, 39
- Sramek & Weedman (1980) Sramek, R. A., & Weedman, D. W. 1980, ApJ, 238, 435
- Stalin et al. (2004) Stalin, C. S., Gopal-Krishna, Sagar, R., & Wiita, P. J. 2004, MNRAS, 350, 175
- Stawarz et al. (2004) Stawarz, Ł., Sikora, M., Ostrowski, M., & Begelman, M. C. 2004, ApJ, 608, 95
- Steffen et al. (2005) Steffen, A. T., Strateva, I., Brandt, W. N., Alexander, D. M., Koekemoer, A., Lehmer, B., Scheider, D. P., Silverman, J. D., & Vignali, C. 2006, AJ, 131, 2826
- Stockton (1978) Stockton, A. 1978, ApJ, 223, 747
- Strateva et al. (2005) Strateva, I. V., Brandt, W. N., Schneider, D. P., Vanden Berk, D. G., & Vignali, C. 2005, AJ, 130, 387
- Tavecchio et al. (2000) Tavecchio, F., Maraschi, L., Sambruna, R. M., & Urry, C. M. 2000, ApJ, 544, L23
- Tavecchio et al. (2003) Tavecchio, F., Ghisellini, G., & Celotti, A. 2003, A&A, 403, 83
- Turner et al. (1997) Turner, T. J., George, I. M., Nandra, K., & Mushotzky, R. F. 1997, ApJ, 488, 164
- Vestergaard & Peterson (2006) Vestergaard, M., Peterson, B. M. 2006, ApJ, 641, 689
- Weymann et al. (1991) Weymann, R. J., Morris, S. L., Foltz, C. B., & Hewett, P. C. 1991, ApJ, 373, 23
- White et al. (2000) White, R. L., et al. 2000, ApJS, 126, 133
- Willott et al. (2003) Willott, C. J., Rawlings, S., & Grimes, J. A. 2003, ApJ, 598, 909
- Wills et al. (1999) Wills, B. J., Brandt, W. N., & Laor, A. 1999, ApJ, 520, L91
- Wills & Brotherton (1995) Wills, B. J., & Brotherton, M. S. 1995, ApJ, 448, L81
- Worrall et al. (1987) Worrall, D. M., Tananbaum, H., Giommi, P., & Zamorani, G. 1987, ApJ, 313, 596
- Worrall & Birkinshaw (2006) Worrall, D. M., & Birkinshaw, M. 2006, in ‘Physics of Active Galactic Nuclei at all Scales’, ed. D. Alloin, R. Johnson, P. Lira (Springer Verlag)
- Wright & Otrupcek (1990) Wright, A., & Otrupcek, R. 1990, PKS Catalog (1990), 0
- York et al. (2000) York, D. G., et al. 2000, AJ, 120, 1579
| Band | FrequencyaaLog of rest-frame frequency in units of Hz. | LuminositybbLog of bandpass-corrected luminosity density in units of erg s-1 Hz-1, after correcting for Galactic extinction. | DateccDate is UT yyyy/mm/dd | Source |
| 8.00 | 34.26 | PKS 80 MHz | ||
| 8.34 | 33.85 | PKS 178 MHz | ||
| RadioddParkes catalog data from Wright & Otrupcek 1990; note that due to limited resolution the luminosity densities from the Parkes survey quoted here are dominated by the extended emission. Luminosities for the nucleus alone measured from VLA data are given in parentheses. | 8.70 | 33.58 | PKS 408 MHz | |
| 9.24 | 33.26 (31.92) | PKS (VLA) 1.4 GHz | ||
| 9.53 | 33.05 | PKS 2.7 GHz | ||
| 9.79 | 32.77 (31.70) | PKS (VLA) 5 GHz | ||
| 12.57 | 32.85 | 1983 | IRAS 100 m | |
| 12.79 | 32.40 | 1983 | IRAS 60 m | |
| 13.17 | 32.24 | 1983 | IRAS 25 m | |
| 13.49 | 31.98 | 1983 | IRAS 12 m | |
| 13.55 | 31.56 | 1986/01 | (BJWeeData obtained by author B.J. Wills) | |
| IR | 13.89 | 31.40 | 1986/01 | (BJWeeData obtained by author B.J. Wills) |
| 13.98 | 31.23 | 1986/01 | (BJWeeData obtained by author B.J. Wills) | |
| 14.03 | 31.17 | 1986/01 | (BJWeeData obtained by author B.J. Wills) | |
| 14.23 | 30.83 | 2000/04/06 | 2MASS | |
| 14.35 | 30.69 | 2000/04/06 | 2MASS | |
| 14.47 | 30.67 | 2000/04/06 | 2MASS | |
| 14.62 | 30.64 | 2003/01/28 | SDSS | |
| 14.70 | 30.66 | 2003/01/28 | SDSS | |
| Optical | 14.78 | 30.61 | 2003/01/28 | SDSS |
| 14.90 | 30.61 | 2003/01/28 | SDSS | |
| 15.02 | 30.61 | 2003/01/28 | SDSS | |
| 15.11 | 30.48 | 2003/05/04 | OM UVW1 | |
| UV | 15.21 | 30.44 | 2003/05/04 | OM UVM1 |
| 15.24 | 30.38 | 2003/05/04 | OM UVW2 | |
| 15.59 | 29.48 | 2000/12/17 | FUSE | |
| 17.68 | 25.36 | 1980/05/09 | Einstein | |
| X-ray | 17.68 | 25.59 | 2005/01/05 | Chandra |
| 17.68 | 25.56 | 2003/05/04 | XMM-Newton |