Intergalactic C iv absorption at redshifts 5.4 to 6
Abstract
We report the discovery of a strong C iv absorption system at in the near-infrared spectrum (-band) of the QSO SDSS J1030+0524. These observations, obtained with the Infrared Spectrometer And Array Camera (ISAAC) on the European Southern Observatory Very Large Telescope (ESO VLT), demonstrate that, with modern instrumentation, QSO absorption line spectroscopy can be successfully extended to near-infrared wavelengths to probe the intergalactic medium near the end of the reionization epoch. Although the statistics of this pilot study are limited, the mass density of triply ionized carbon implied by our data is comparable to the values of reported at lower redshifts. Neither the column density distribution of C iv absorbers nor its integral show significant redshift evolution over a period of time which stretches from 1 to 4.5 Gyr after the big bang, suggesting that a large fraction of intergalactic metals may already have been in place at redshifts above 6. Alternatively, the strong C iv system we have detected may be associated with outflowing, highly-ionized, gas from a foreground massive galaxy; deep imaging and spectroscopy of galaxies near the QSO sightline should be able to distinguish between these two possibilities.
keywords:
quasars: absorption lines, intergalactic medium, cosmology: observations1 Introduction
A major goal of extragalactic astronomy is to identify the end of the ‘dark ages’ when the first luminous objects were assembled and the Universe was reionized. It is an early generation of extremely metal-poor massive stars and/or their remnants in subgalactic halos that generated the ultraviolet radiation and mechanical energy that reheated and reionized most of the hydrogen in the cosmos. The epoch of reionization sets the stage for the subsequent evolution of stars, galaxies and the intergalactic medium (IGM) and is currently the focus of considerable observational and theoretical efforts.
The Lyman (Ly) forest properties appear to change rapidly around (Fan et al. 2006): the mean length of complete dark gaps (where the QSO light is completely absorbed) increases; the variance in the forest properties increases, indicating larger spatial fluctuations in the ultraviolet ionizing background; and the sizes of the QSOs own H ii regions decrease. Fan et al. concluded that marks the end of the overlapping stage of reionization and that the mass-averaged neutral fraction of the IGM is between 1 and 4% at . However, at present the comoving space density of massive, luminous galaxies and QSOs at these epochs appears insufficient to provide the required ionizing flux (e.g. Madau, Haardt, & Rees 1999; Fan et al. 2001; Bunker et al. 2004; Yan et al. 2006). The recent third-year Wilkinson Microwave Anisotropy Probe (WMAP) measurement of the optical depth to Thomson scattering, (Spergel et al. 2006) suggests that the Universe was reionized at higher redshifts, an indication of significant star formation activity at very early times.
The epoch of reionization is clearly a pivotal time in the history of the Universe. Despite the recent progress described above, data are still rather scarce. In particular, the properties of the Ly forest can only be determined in a statistical way at these high redshifts, since the line density is so high that individual Ly lines can no longer be resolved. In this regime, the metal lines which fall longwards of the Ly emission take on a special significance as the only tool at our disposal to recognise individual absorption systems, whether in galaxies or the IGM, and probe the metal enrichment of the Universe following the earliest episodes of star formation.
The C iv doublet ( 1548.2041, 1550.7812) is the most common pair of metal lines associated with the highly ionized Ly forest (Sargent, Boksenberg, & Steidel 1988). Metals may be transported to the IGM in large-scale outflows (‘superwinds’) from nearby actively star-forming galaxies, as proposed by Adelberger et al. (2005). Alternatively, the IGM could have been enriched by an early population of stars prior to the epoch of reionization (e.g. Madau, Ferrara, & Rees 2001), preferentially in regions around the highest matter overdensities (Porciani & Madau 2005). The first study to measure the amount of C iv in the IGM over a large range in redshift was conducted by Songaila (2001) using a sample of 32 QSOs observed with the Keck telescopes; a further analysis was presented in Songaila (2005). The somewhat surprising result of this work was the finding that the cosmological mass density of C3+ ions, , shows little, if any, redshift evolution between and 4.5. Initially there was tentative evidence for a turn-down of at . However, with improved statistics Pettini et al. (2003) later showed the turn-over to be probably due to incompleteness effects – to the best of our knowledge remains approximately constant as we look back in time up to redshift .
Searches for C iv at redshifts beyond are essential for constraining the origin of metals in the IGM, since this is the redshift where the comoving star formation rate density appears to begin to decline (Bunker et al. 2004; Giavalisco et al. 2004; Bouwens & Illingworth 2006). If the mass density of metals in the IGM drops by a similar factor, then a scenario where winds from massive star-forming galaxies pollute the IGM with metal will be favoured. On the other hand, if the mass density of metals were observed to remain constant, this may point to an epoch of very early enrichment of the IGM, presumably by smaller mass objects.
The limit of previous studies was set by the use of optical spectrographs and CCD detectors – the observations by Songaila (2001) and Pettini et al. (2003) were all obtained with optical instruments, the High Resolution Echelle Spectrograph and the Echelle Spectrograph and Imager on the Keck telescopes. At the C iv doublet moves to wavelengths beyond 9300 Å, requiring spectroscopy in the near-infrared (IR). This is a largely unexplored wavelength regime in QSO absorption line spectroscopy (with a few exceptions – see for example Kobayashi et al. 2002). On the other hand, near m there are several windows relatively free of terrestrial water vapour absorption where, with suitably long exposure times, it should be possible to achieve the signal-to-noise ratios and spectral resolution required for narrow absorption line work.
To this end, we have conducted a pilot investigation with the Infrared Spectrometer And Array Camera (ISAAC) on the ESO VLT (Moorwood et al. 1998). We targeted two of the highest redshift QSOs discovered by the Sloan Digital Sky Survey: SDSS J103027.10+052455.0 (, , abbreviated to J1030+0524) and SDSS J130608.26+035626.3 (, , abbreviated to J1306+0356) over the wavelength range 9880 to 10800 Å. Details of the observations and data reduction are given in Section 2. We report the detection of a definite, strong, C iv doublet at and of a possible doublet at . In Section 3 we describe the measurement of the column densities of these absorbers, , together with the derivation of the mass density of C3+ ions, , they imply. We discuss these results in Section 4 and consider future prospects for this work in Section 5.
2 Observations and data reduction
The ISAAC observations of J1030+0524 and J1306+0356 were obtained in service mode in March 2004 (J1306+0356) and in the period January–March 2005 (J1030+0524). ISAAC was used in its medium resolution spectroscopic mode with a 0.6 ″ slit to deliver a resolving power (FWHM km s-1 or 1.8 Å at the wavelengths of interest here) sampled with four 0.146 ″ ( km s-1, 0.45 Å) pixels of the Rockwell detector. Our proposal was to use two wavelength settings, each spanning a wavelength range Å, centred respectively at Å and 10570 Å. At the conclusion of the service observations, a total of two hours of data at the 10110 Å setting had been secured for J1306+0356. In the case of J1030+0524, the total exposure time was 11 hours at 10110 Å and 10 hours at 10570 Å. For the latter object, two additional hours were spent unintentionally at an intermediate setting centred at 10330 Å; however, these data turned out to be useful too as they provide an independent confirmation of the reality of the strong C iv system at which is detected in both wavelength settings even though it was recorded at different physical locations on the detector.
| QSO | /cm-2) | (km s-1) | |
|---|---|---|---|
| J1030+0524 | 5.7238 0.0001 | 14.37 0.05 | 63 5 |
| J1030+0524 | 5.8290 0.0002 | 14.5: (marginal) | … |
The observations were performed in the conventional beam-switching mode, with the QSO moved between two positions on the slit separated by 10 ″. After an A-B-B-A series of s long exposures, the object was reacquired at a different position along the slit (so as to use different pixel rows on the detector to record the signal) and the four-exposure sequence repeated. The 120 ″ long ISAAC slit was oriented on the sky to include a bright star in each observation, with the centre of the slit positioned approximately half way between the bright star and the faint QSO. The bright star aids target acquisition and provides a record of the seeing and sky transparency during the observations; the weather conditions were similar over most of our observations, with the seeing typically at FWHM ″.
The data reduction used as a starting point the pipeline processed two-dimensional images provided by ESO. Each of these images corresponds to a s A-B-B-A sequence where the individual 900 s exposures have been flat-fielded, combined so as to subtract the background, and mapped to a geocentric, vacuum wavelength scale. Our first step was to shift each 2D pre-processed image in the spatial direction, using the bright star for reference, so that all the exposures at a given wavelength setting are coaligned spatially; only integer pixel shifts were applied. Comparison of the OH sky line residuals between different images revealed that the pipeline wavelength calibration was only accurate to about Å; we remedied this situation by applying a new dispersion correction using the OH line list by Rousselot et al. (2000) and in the process changed to a heliocentric wavelength scale.111Fortunately, the heliocentric correction was not very different for different exposures taken at the same wavelength setting, so that this remapping of the wavelength scale did not lead to significant smearing of the sky line residuals to be subtracted at a subsequent stage of the data processing, as explained below.
The properly registered 2D images were co-added using the IRAF task imcombine. In cases where more than two images are available at the same wavelength setting, we used a ‘minmax’ algorithm to reject pixels affected by cosmic-ray events or other defects. When this was not possible, such defective pixels were identified visually and patched with the IRAF task fixpix which interpolates between adjacent areas on the image. The fully processed 2D images contain three spectra of each object on the slit – a positive spectrum flanked by a negative spectrum on either side – as a result of the way the initial A-B-B-A exposures are combined. We extracted one-dimensional spectra from the 2D images using the IRAF task apall on the central, positive, spectrum; in the extraction process we also corrected for any residual sky emission by using standard background subtraction tools available within apall.
In cases where several exposures at the same wavelength setting are available, we used the same apall parameters to extract 1D spectra from the individual 2D images (rather than from the co-added one), and then co-added the 1D extractions to produce a final spectrum. While the result of this alternative procedure is not significantly different from the 2D addition, it does have the advantage of providing an empirical measure of the associated 1D error spectrum from consideration of the rms fluctuations in each wavelength bin from its (mean) value in the final, co-added, spectrum.
In the last step, the 1D spectra were rebinned by a factor of two in wavelength to improve the signal-to-noise ratio while maintaining the sampling at the Nyquist limit. In the case of J1030+0524, we also co-added the portion of the final spectra which is in common between the two settings at central wavelengths Å and Å respectively.
3 Intergalactic C iv at redshifts 5.4 – 6
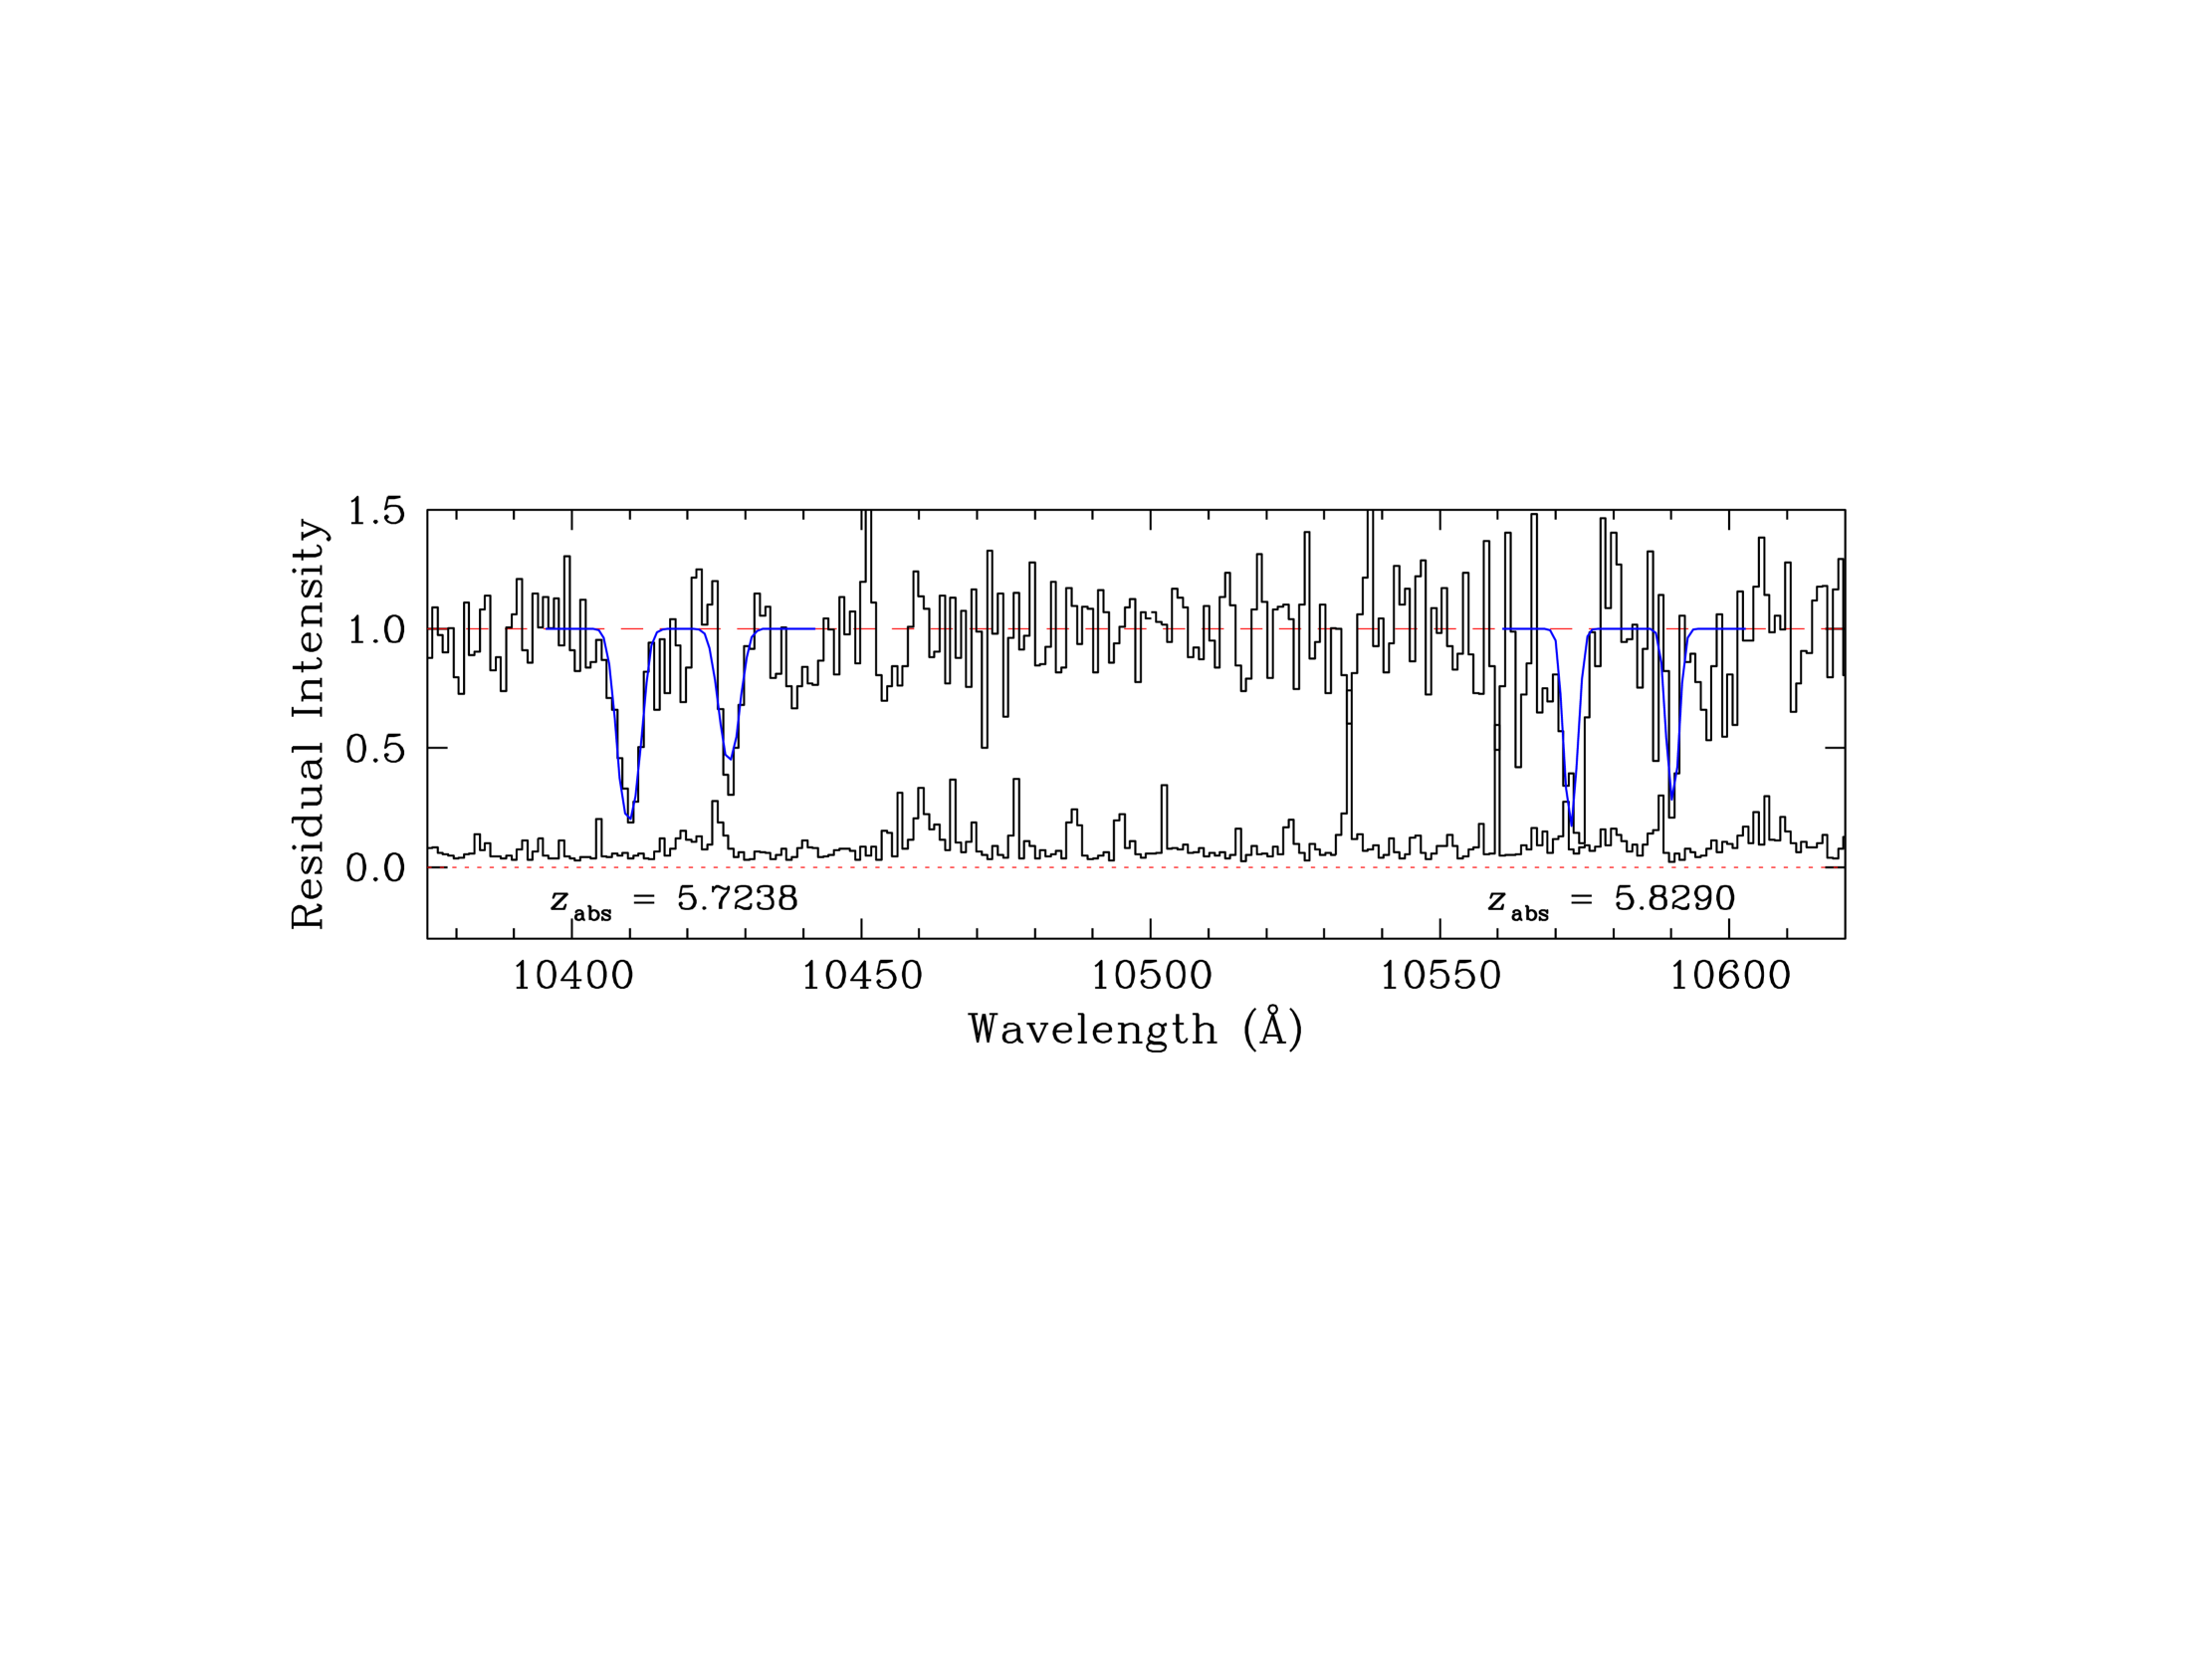
The spectra were searched by eye for absorption features separated by , where Å is the rest-frame wavelength difference between the two members of the C iv doublet. An additional requirement for the identification of such features as redshifted C iv lines is that their equivalent widths should satisfy the condition . No such features could be recognised in the wavelength interval Å (centred at Å) in the spectrum of either QSO. However, two C iv doublets, one definite and one possible, were flagged in the second spectrum of J1030+0524 which extends from 10340 to 10800 Å. As already explained, the first doublet, at Å, is also present in the spectrum of J1030+0524 centred at Å, providing additional confirmation that it is indeed real absorption rather than a detector defect or an artifact of the data processing.
The two C iv doublets are shown in Figure 1 after normalisation by the underlying QSO continuum. In order to deduce the parameters of the absorbers, we fitted the absorption lines with theoretical Voigt profiles generated by the VPFIT software package222VPFIT is available at http://www.ast.cam.ac.uk/rfc/vpfit.html .; the values of redshift , C iv column density , and Doppler parameter (and their errors) returned by VPFIT are collected in Table 1. A single absorption component was fitted in each case – a more complicated velocity structure, while plausible, is unwarranted by the quality of the present data.
The line fitting procedure shows that the system is only a tentative identification. As can be seen from Figure 1, the two absorption features are not centred at exactly the same redshift, although the wavelength mismatch could be due to the noisy character of the spectrum. Better data will be required to confirm the reality of this absorber—for the moment, we flag it as ‘possible’. Observations taken with the Gemini Near-IR Spectrograph (GNIRS) on Gemini South (Simcoe 2006) also show absorption at . In addition, two weak C iv systems identified in the GNIRS data appear as marginal features in our ISAAC data at and 5.74 respectively.
On the other hand, VPFIT confirms that the pair of absorption lines at Å is well fitted by a C iv doublet at (see Figure 1). This is a strong absorber, with cm-2, higher than any of the values of found by Pettini et al. (2003) and Songaila (2001) at . The absorption lines are wide and fully resolved—the instrumental resolution of our ISAAC spectra corresponds to a Doppler parameter km s-1, much smaller than the value km s-1 returned by VPFIT for the doublet (after deconvolution with the instrumental broadening). If such wide absorption profiles result from the superposition of multiple velocity components of smaller internal velocity dispersion, we may have underestimated the total column density of C iv absorbers and the value returned by VPFIT would in that case be a lower limit to .
Clearly, it would be unwise to draw sweeping conclusions on the basis of a single detection. On the one hand, the strong C iv system we have discovered in the spectrum of the QSO J1030+0524 may not be typical of the IGM at these redshifts (although the tentative detection of a second strong absorber, if confirmed, would argue against this interpretation). On the other, one could argue that the one detection reported here gives a lower limit to the density of intergalactic C iv because: (i) the absorption lines may be saturated and may have been underestimated, as explained above; (ii) a second C iv system of comparable column density may have been detected; and (iii) our data are only sensitive to the strongest C iv absorbers and miss the more common lower column density systems. The marginal features discussed above suggest that deeper observations are indeed likely to reveal more C iv absorbers that could make a substantial contribution to the total mass density of C iv.
Let us denote with the total absorption distance sampled by our spectra; for ease of comparison with earlier work, we adopt an Einstein-de Sitter cosmology in which the absorption distance is given by:
| (1) |
where the summation is over spectra in which C iv doublets could have been detected at redshifts between and . Although the S/N ratio of our spectrum of J1306+0356 is lower than that of either of the two spectral regions recorded in J1030+0524, it is nevertheless sufficient to detect C iv absorbers as strong as those shown in Figure 1. Thus, in the present analysis, and . (The effective pathlength is less than Å, since we have taken into account the minimum and maximum redshifts at which both components of the doublet would be detected and have not included portions of the spectra with significant skyline residuals or other lines).
Songaila’s best fit to the distribution in the redshift range is , where is the C iv column density measured in units of cm-2. If this steep slope of were to persist to the higher redshifts probed here, by integrating over the column density we would expect , that is about 0.5 absorbers with cm-2 per unit absorption distance. The detection of one absorber with cm-2 over an absorption distance of is therefore in agreement with the expected value. Within the limited statistics of our sample, it appears that there is little evolution in the density of C iv systems with cm-2.
We can calculate the mass density of C3+ ions implied by our detection using the usual statistic (Pettini et al. 2003):
| (2) |
where is the mass of a C iv ion, and is the critical density. Entering the numerical values and with km s-1 Mpc-1, eq. (2) reduces to:
| (3) |
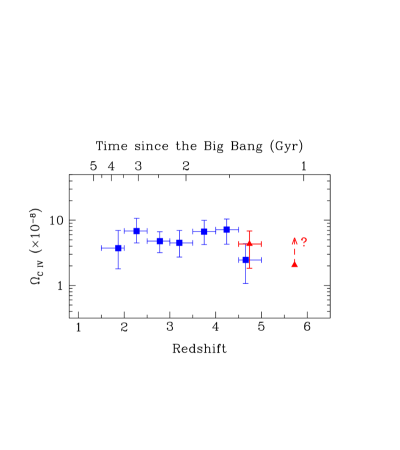
leading to at . We have plotted this value as a lower limit (for the reasons given above) in Figure 2. Comparison with analogous measurements at lower redshifts shows that, if typical of the widespread intergalactic medium, the value of deduced here is consistent with little, if any, decrease in this quantity from to the highest redshifts that can be probed with known QSOs. Specifically, the lower limit we have determined in the present work is very similar to Songaila’s (2001) first estimate of at which also based on limited statistics. Deeper observations by Pettini et al. (2003) later showed that incompleteness corrections raise this value to approximately the same level as measured at , and this may well be the case too for the data reported here.
4 Discussion
The apparent lack of evolution of the quantity from to Gyr after the Big Bang is puzzling indeed, given the dramatic changes we see in many other properties of the Universe at these epochs. Taken at face value, the approximately constant value of from to would seem to argue for an early () production of intergalactic metals, consistent with the interpretation put forward by Madau et al. (2001) and Porciani & Madau (2005). An alternative explanation, favoured by Adelberger et al. (2005; see also Adelberger 2005), is that a significant fraction of the ‘intergalactic’ C iv absorption actually occurs in the vicinity of actively star-forming galaxies undergoing mass loss on a galaxy-wide scale as a direct consequence of the star formation activity we see. The statistical association of strong C iv absorption systems with galaxies close to the QSO sightline at in the surveys by Steidel and collaborators (Steidel et al. 2004) and the ubiquitous evidence for mass outflows from these galaxies (Pettini et al. 2001; Steidel et al. 2004; Erb et al. 2006) support this picture.
In the latter case, the total amount of carbon in the IGM, , would presumably increase with the progress of time as a result of the on-going star formation activity in galaxies. Given that only a fraction of carbon is triply ionized, even under the physical conditions most favourable to C3+, we would then have to conclude that changes in the ion fraction C3+/CTOT and work in opposite directions to produce the approximately constant value of revealed by the observations. Oppenheimer & Davé (2006) have recently investigated such a scenario with hydrodynamic simulations of structure formation which incorporate outflows from star forming galaxies and shown it to be plausible.
The lack of C ii absorption at in the optical spectrum of J1030+0524 (Pettini et al. 2003) indicates that the C iv we detect arises in highly ionized, optically thin gas, as is the case for most of the C iv absorbers at lower redshifts. Conversely, Becker et al. (2006) recently reported the detection of a surprisingly large number of O i absorption systems at in the spectrum of the QSO SDSS J1148+5251 and speculated that a decrease in high ionization species such as C iv, and corresponding rise in low ionization species such as O i, may signal a shift in the ionization state of the IGM at . The results reported here suggest that the real situation is probably more complicated, in that the evidence for a widespread decrease in at is far from secure at present, as we have argued. One difficulty of course is ‘cosmic variance’ – without larger samples we do not know that the sightline to J1030+0524 does not exhibit an excess of strong C iv systems, just as the sightline to J1148+5251 shows an unusually high number of O i absorbers.
Is there any evidence that the strong C iv absorber at in J1030+0524 is associated with outflowing gas from a foreground galaxy? Songaila (2006) has proposed that about half of all high column density ( cm-2) C iv systems, which have a median full width at one-tenth maximum velocity of FWTM km s-1 could originate in galactic outflows. The absorber in J1030+0524 certainly fits into this category since the value of km s-1 we measure corresponds to FWTM km s-1. Galaxies at are known to contain metal enriched interstellar gas which is seen in absorption against the central starburst (e.g. Taniguchi et al. 2005). Low ionization metal absorption lines are also detected in the host galaxy of a -ray burst (GRB) at , possibly the result of a metal-enriched nebula swept up by a progenitor wind prior to the GRB (Kawai et al. 2006). It is also likely that massive galaxies at support significant outflows, since their rest-frame UV luminosities indicate star formation rates in the range 3 to 30 yr-1 (Yan et al. 2006).
Interestingly, the field of the QSO J1030+0524 has been imaged with the Advanced Camera for Surveys on the Hubble Space Telescope by Stiavelli et al. (2005). These authors found an excess of objects with the colours of galaxies at near the sightline to the QSO; two are located 85 and 89 proper kpc () from the QSO sightline, respectively, but their redshifts are unknown. For comparison, Adelberger et al. (2005) found that about half of the Lyman break galaxies in their sample produce strong ( cm-2) C iv absorption within kpc of the galaxy. The only galaxy in the Stiavelli et al. (2005) sample with a spectroscopically confirmed redshift ()—determined from its Ly emission line which, incidentally, exhibits the asymmetric P-Cygni profile characteristic of outflowing gas—is located 350 proper kpc from the QSO sightline, beyond the projected distance where Adelberger et al. (2005) typically find a significant excess of C iv absorbers. The four remaining galaxies are also located beyond this projected distance. It may be the case that the excess of galaxy counts is indeed evidence for a large-scale overdensity (as proposed by Stiavelli et al. 2005), where star formation and metal enrichment started at earlier times (Steidel et al. 2005). The fact that four of the six O i systems found by Becker et al. (2006) are along one line of sight may also suggest a tendency for patchy, and thus highly biased, metal enrichment at high redshift.
5 Summary and Outlook
In summary, we have detected one definite and one marginal C iv absorption line system between and 6.0 . These are the highest redshifts at which C iv has been detected to date. The column density we measure in the one definite system at gives a lower limit to the comoving mass density of C3+ ions at these redshifts ; this value is consistent with only mild or no evolution of from . The finding that a substantial fraction of intergalactic metals is already in the IGM at the highest redshifts that can be probed with known QSOs provides tantalising evidence for an early epoch of metal production. However, with the detection of just one absorption system, such a conclusion would be premature. Finding patchy enrichment in matter overdensities can be used to argue either case: early enrichment by stars at the onset of reionization or later injection of metals into the IGM from starburst winds.
Extending the search for metals to lower column density systems, coupled with deep imaging and spectroscopy of galaxies near high- QSO sightlines, would help discriminate between these two scenarios. Having demonstrated that QSO absorption line spectroscopy can be successfully performed at near-IR wavelengths, we now plan to increase the pathlength of our survey with observations towards other QSOs. Looking further ahead, the forthcoming availability of X-shooter on the VLT (Moorwood & D’Dodorico 2004), a second generation instrument which is much better suited to the requirements of QSO absorption line spectroscopy than ISAAC, promises to throw wide open the observational window on stellar nucleosynthesis during the first Gyr of the Universe.
We thank Xiaohui Fan for providing coordinates of the two QSOs prior to their publication and Massimo Stiavelli for communicating the positions of galaxies in the J1030+0524 field. We are grateful to the VLT time assignment committee for the award of ISAAC time and to the ESO support astronomers who carried out the observations on our behalf. Financial support for this work was provided by a PPARC rolling grant at the University of Cambridge (E.R-W.), and by NSF grant AST02-05738 and NASA grant NNG04GK85G (P.M.).
References
- Adelberger (2005) Adelberger K. L., 2005, IAU Colloq. 199: Probing Galaxies through Quasar Absorption Lines, 341
- Adelberger et al. (2005) Adelberger K. L., Shapley A. E., Steidel C. C., Pettini M., Erb D. K., Reddy N. A., 2005, ApJ, 629, 636
- Becker et al. (2006) Becker G. D., Sargent W. L. W., Rauch M., Simcoe R. A., 2006, ApJ, 640, 69
- (4) Bouwens R., Illingworth G., 2006, New Astronomy Review, 50, 152
- Bunker et al. (2004) Bunker A. J., Stanway E. R., Ellis R. S., McMahon R. G., 2004, 355, 374
- (6) Erb D. K., Shapley A. E., Pettini M., Steidel C. C., Reddy N. A., & Adelberger K. L., 2006, ApJ, 644, 813
- Fan et al. (2001) Fan X. et al., 2001, AJ, 122, 2833
- Fan X. et al. (2006) Fan X. et al., 2006, AJ, in press (astro-ph/0512082)
- Giavalisco et al. (2004) Giavalisco M. et al., 2004, ApJ, 600, L103
- Kawai N., et al. (2006) Kawai N. et al., 2006, Nat, 440, 184
- Kobayashi et al. (2002) Kobayashi N. Terada H. Goto M. & Tokunaga A., 2002, ApJ, 569, 676
- Madau et al. (1999) Madau P., Haardt F., Rees M. J., 1999, 514, 648
- Madau et al. (2001) Madau P., Ferrara A., Rees M. J., 2001, ApJ, 555, 92
- Moorwood et al. (1998) Moorwood A. F. M. et al., 1998, Messenger, 94, 7
- (15) Moorwood A. F. M. & D’Odorico S., 2004, Messenger, 115, 8
- (16) Oppenheimer B.D. & Davé R., 2006, MNRAS, submitted, (astro-ph/0605651)
- Pettini et al. (2003) Pettini M., Madau P., Bolte M., Prochaska J. X., Ellison S. L., Fan X., 2003, ApJ, 594, 695
- Pettini et al. (2001) Pettini M., et al., 2001, ApJ, 554, 981
- Porciani & Madau (2005) Porciani C., Madau P., 2005, ApJ, 625, L43
- Rousselot et al. (2000) Rousselot P., Lidman C., Cuby J.-G., Moreels G., Monnet G., 2000, 354, 1134
- (21) Sargent W. L. W., Boksenberg A., Steidel, C. C., 1988, ApJS, 68, 539
- Simcoe (2006) Simcoe R. A., 2006, ApJ, submitted (astro-ph/0605710)
- Songaila (2001) Songaila A., 2001, ApJ, 561, L153
- Songaila (2005) Songaila A., 2005, AJ, 130, 1996
- Songaila (2006) Songaila A., 2006, AJ, 131, 24
- Spergel, D. et al. (2006) Spergel D. et al., 2006, ApJ, submitted (astro-ph/0603449)
- Steidel et al. (2004) Steidel C. C., Shapley A. E., Pettini M., Adelberger K. L., Erb D. K., Reddy N. A., & Hunt M. P., 2004, ApJ, 604, 534
- Steidel et al. (2005) Steidel C. C., Adelberger K. L., Shapley A. E., Erb D. K., Reddy N. A., & Pettini M., 2005, ApJ, 626, 44
- Stiavelli et al. (2005) Stiavelli M. et al., 2005, ApJ, 622, L1
- Taniguchi et al. (2005) Taniguchi Y., et al., 2005, PASJ, 57, 165
- Yan et al. (2006) Yan H., Dickinson M., Giavalisco M., Stern D., Eisenhardt P. R. M., & Ferguson H. C., 2006, ApJ, in press (astro-ph/0604554)