Can We Trust the Dust? Evidence of Dust Segregation in Molecular Clouds
Abstract
Maps of estimated dust column density in molecular clouds are usually assumed to reliably trace the total gas column density structure. In this work we present results showing a clear discrepancy between the dust and the gas distribution in the Taurus molecular cloud complex. We compute the power spectrum of a 2MASS extinction map of the Taurus region and find it is much shallower than the power spectrum of a 13CO map of the same region previously analyzed. This discrepancy may be explained as the effect of grain growth on the grain extinction efficiency. However, this would require a wide range of maximum grain sizes, which is ruled out based on constraints from the extinction curve and the available grain models. We show that major effects due to CO formation and depletion are also ruled out. Our result may therefore suggest the existence of intrinsic spatial fluctuations of the dust to gas ratio, with amplitude increasing toward smaller scales. Preliminary results of numerical simulations of trajectories of inertial particles in turbulent flows illustrate how the process of clustering of dust grains by the cloud turbulence may lead to observable effects. However, these results cannot be directly applied to large scale supersonic and magnetized turbulence at present.
Subject headings:
ISM:1. Introduction
The spatial structure of interstellar clouds is the result of dynamical processes responsible for the formation and evolution of the clouds and controlling the formation of stars. Numerical simulations of star formation, coupling turbulent fragmentation, self-gravity and magnetic fields, should be able to reproduce the observed cloud structure. Maps of column densities are the most straightforward tool for the comparison of numerical and observational data, but the limitations of any column density tracer in star-forming clouds must be well understood before attempting such a comparison.
Integrated intensity maps of the 13CO J=1-0 emission line can be used to estimate column densities in the range of visual extinction mag, if spatial variations of temperature and line saturation are accounted for with the help of radiative transfer modeling. Variations of the abundance of the CO molecule at mag and mag may be expected because of the chemistry of CO formation and depletion respectively. Similar considerations apply to other molecular tracers, for different values of visual extinction.
FIR maps of dust emission have also been used to estimate column density, but the method requires a careful correction for temperature variations, which can be achieved only if various FIR bands are available and assuming some knowledge of the structure along the line of sight. At sub-mm wavelengths the temperature dependence is less critical, but, as for the FIR, the thermal emission is sensitive to the optical properties of dust grains, which are expected to vary with density, due to grain growth and ice deposition. Moreover, ground based sub-mm observations do not provide accurate maps of very extended emission, because sky fluctuations are hard to distinguish from smooth surface brightness variations.
Considering the difficulties of the various methods of measuring column densities in interstellar clouds, the NIR reddening of background stars is usually assumed to be the most reliable probe of column density. This method is not affected by any gradients in dust temperature and provides a direct measurement of the dust column density from observations of the NIR color excess. The NIR color excess is converted to a dust column density via the NIR extinction law; the dust column density is then converted to a gas column density by assuming a constant gas to dust ratio.
In this work we test the hypothesis that the dust distribution faithfully traces the total gas column density, by comparing the power spectra of maps of the Taurus region obtained with the J=1-0 line of 13CO and with 2MASS extinction measurements. The 13CO study was reported in Padoan et al. (2004). Here we present the new 2MASS results and discuss their comparison with the CO observations. We find that the dust power spectrum is significantly shallower than the gas power spectrum, even after accounting for radiative transfer, temperature distribution, CO formation, and CO depletion effects on the 13CO data and after a detailed simulation of the extinction method, based on three dimensional density fields from the highest resolution simulations of supersonic turbulence to date.
Possible variations of dust extinction efficiency due to grain growth with increasing density may contribute to this result. However, we find that the necessary variation in the extinction efficiency would require the maximum grain size to span the approximate range 0.1-0.6 m, from low to high extinction regions on the Taurus map. The available grain models and the observational constraints from the extinction curve imply a smaller range of maximum grain sizes, insufficient to explain the power spectrum discrepancy. The difference in the power spectra may therefore be due to a real difference in the structure of dust and gas column densities, with fluctuations of the dust to gas ratio increasing toward smaller scales. Preliminary results of the numerical simulation of inertial particle trajectories in turbulent flows support the idea that the cloud turbulence may cause a spatial clustering of the dust grains, resulting in the observed effect on the power spectra. However, the simulations are presently limited to transonic and non-magnetized turbulence, and so they are at best relevant only to scales pc. Simulations of the same process with supersonic and magnetized flows are required for a direct interpretation of the observations.
2. Extinction Maps and Power Spectra
The method of computing extinction maps of interstellar clouds was first discussed by Lada et al. (1994) and later improved by Lombardi & Alves (2001). The method is based on subdividing the observed region with a regular grid, and assigning to each grid cell a value of extinction equal to the average extinction of the stars within that cell. The number of stars per cell decreases with increasing average extinction in the cell, because only the brightest background stars can be seen through a large column of dust.
In this work we adopt the method of Cambrésy et al. (2002). This method takes advantage of adaptive cells with a fixed number of stars instead of cells of fixed size. In this way it is possible to keep the spatial resolution as high as allowed by the local stellar density. The spatial resolution is higher in regions of low extinction than in regions of large extinction, where fewer background stars are detected and larger cells must be used. The average spatial resolution over the whole map can be changed by changing the number of stars per cell.
The color excess is computed using the relation , where is the observed median color in a cell and is the intrinsic median color, estimated from the colors of unreddened stars. In the method of Lada et al. (1994) the mean color is used instead of the median color. We use the median color because it minimizes the effect of foreground stars (or any object with very peculiar colors), as shown by Cambrésy et al. (2002). Visual extinction values are obtained from the color excess using the Rieke and Lebofsky (1985) extinction law, which results in the relation .
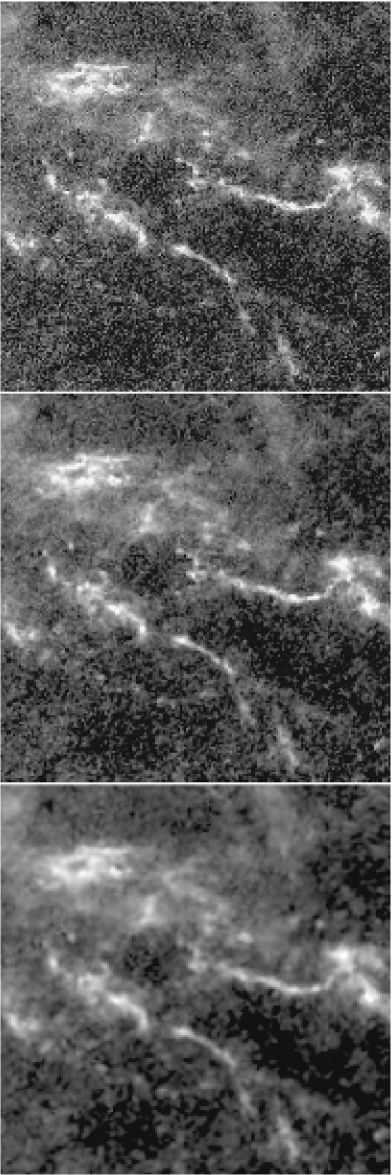
We have computed extinction maps of the Taurus region with 1, 3, 10, 30 and 100 stars per cell. The maps with 3, 10 and 30 stars per cell (top to bottom panels) are shown in Figure 1. After removing 129 young stellar objects known from the literature and detected in 2MASS, the intrinsic color is computed as the median color of stars in regions where no 12CO (Dame et al. 2001) is detected, within a field larger than the actual extinction map. The intrinsic color is found to be mag. The standard deviation of the color of these unreddened stars provides an estimate of the uncertainty in the extinction maps. The extinction map of the Taurus region with 10 stars per cell has extinction values ranging from

mag (1– detection) to mag and a mean angular resolution of arc-minutes (the largest value is 10.9 arc-minutes). Based on a standard gas to dust ratio (Bohlin et al. 1978), and a normal extinction law (), the relation of total gas column density and extinction is . The range of extinction in the Taurus map with 10 stars per cell corresponds to a range in column density from to .
The power spectra of the spatial distribution of visual extinction have been computed based on the 2MASS extinction maps. If the visual extinction is proportional to the total column density, these are also the power spectra of projected density. The power spectra are shown in Figure 2, for the maps with 3, 10 and 30 stars per cell. The noise power spectrum has been removed, assuming uniform noise over the map. The statistical noise resulting from the adaptive cell method is indeed uniform, because the number of stars per cell is constant. With a uniform grid, instead, the noise would increase with increasing extinction, as the number of stars per cell decreases, so the removal of the noise spectrum would be less trivial. Figure 2 shows that i) the power spectrum is a power law, within a range of scales, ii) the slope of the power law slightly increases with decreasing spatial resolution (increasing number of stars per cell) and iii) at a comparable spatial resolution, the slope is significantly lower than the value of approximately -1.8 found by Padoan et al. (2004), based on J=1-0 13CO observations and detailed radiative transfer modeling.
The power spectrum derived from the 13CO maps in Padoan et al. (2004) was corrected for the effects of line saturation and spatial variations of kinetic temperature, based on three dimensional radiative transfer calculations of model clouds with realistic density distributions (obtained from simulations of supersonic turbulence). Only a small fraction of the mapped area corresponds to mag, at the resolution of the 13CO map, so molecular depletion is not expected to affect significantly the power spectrum, as shown in Section 4.3. Furthermore, Padoan et al. (2004) studied two more regions, Perseus and Rosette, and found almost the same slope of approximately -1.8, which is also the power law predicted by simulations of supersonic turbulence with the same rms Mach number as found in those cloud complexes. Therefore the 2MASS extinction maps may underestimate the slope of the projected density power spectrum. This difference is presumably due to the presence of small scale intensity fluctuations of larger amplitude in the extinction map than in the 13CO map.
3. Numerical Simulations and Synthetic Extinction Maps
To verify that the extinction map method can reproduce the correct power spectrum slope, we have generated and analyzed synthetic data. We first generate a realistic three dimensional cloud model and a realistic sample of background stars with visual extinction determined by the column density of the cloud model at the positions of the stars. Synthetic extinction maps are then computed in the same way as with the 2MASS stars.
The model density field is based on a simulation of supersonic turbulence, with the ENZO code, using a direct Eulerian formulation of the Piecewise Parabolic Method (Colella & Woodward 1984) to solve the equations of gas dynamics. In order to mimic the conditions found in molecular clouds, a quasi-isothermal equation of state was used, with the ratio of specific heats = 1.001. To maintain the turbulent kinetic energy in the computational box at a given level, we use a large-scale solenoidal force per unit mass with a fixed spatial pattern and a constant power in the range of wavenumbers .
Because real molecular clouds are known to be fragmented on very small scales and each extinction measurement samples an extremely small cloud area (the apparent projected area of the star), it is important to use a model density field with a very large range of scales. For this reason, we have used our recent turbulent simulation run on a uniform mesh of computational zones (Kritsuk et al. 2006, in preparation), which is the largest numerical experiment of highly supersonic turbulence carried out to date. The rms Mach number of the flow in this experiment was approximately 6. The density field was rescaled to correspond to an rms Mach number of 10 (comparable to the estimated Mach number in the Taurus region) according to the prescription in Padoan et al. (1998), which maintains the Lognormal form of the density histogram. A supersonic simulation with an rms Mach number of 10 and including the magnetic field would be more appropriate for this study. However, for the purpose of generating synthetic extinction measurements it is more important to include a very large range of turbulent scales than the precise physical parameters of the turbulent flow, and so we have chosen to use our largest available run, despite the lack of the magnetic field and the Mach number value less than 10.
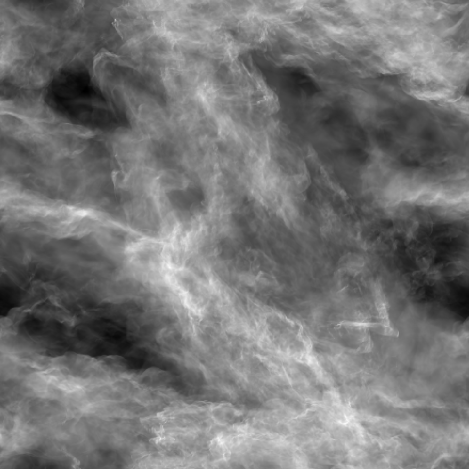
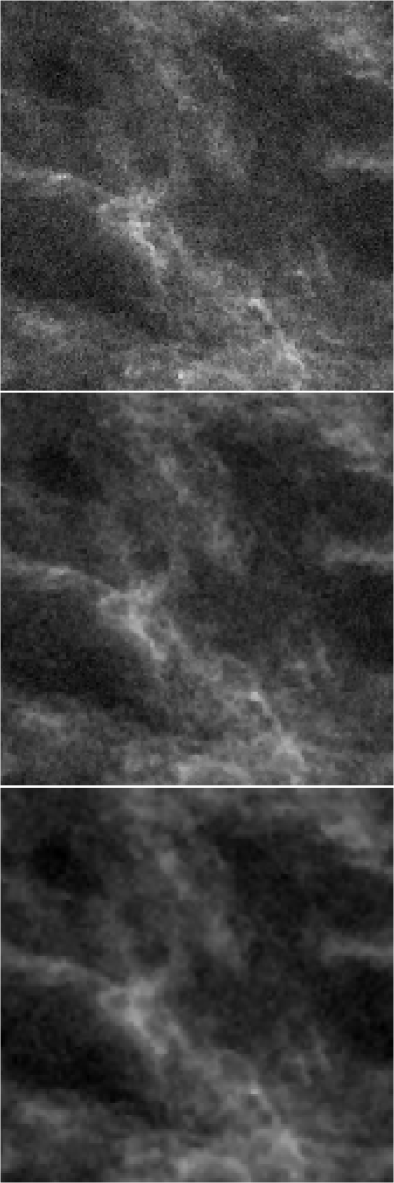
Three stellar catalogs were then generated with , and stars. A luminosity function slope of 0.33 () was imposed, while the band magnitudes were randomly generated assuming mag and mag. The stars were uniformly distributed in space with reddening proportional to the column density of the model cloud at the position of each star. To simulate the variation of stellar density with extinction, a magnitude limit was applied, which mimics the magnitude limit of the 2MASS survey. Extinction maps were finally computed on these synthetic datasets with the same method used to compute the extinction maps from the 2MASS data. The projected density of the cloud model is shown in Figure 3. Figure 4 shows the synthetic extinction maps from the catalogs with stars (comparable to the number of stars used for the Taurus region here analyzed). The maps are based on 3, 10 and 30 stars per cell, from top to bottom.
The power spectra of these synthetic extinction maps (assuming the dust accurately traces the gas) and of the projection of the original density field, are shown in Figure 5. As in the extinction maps of the Taurus region, the power law slope of the power spectrum increases with decreasing spatial resolution (this trend is stronger for maps based on a lower number of stars). The slope remains close to the correct value for the original cloud model, particularly for the map with 10 stars per cell. The variation of the slope with resolution is due to a gradual smoothing of density structures. The column density is very filamentary, both in the observations and in the simulations. When the density contrast of long coherent filaments is decreased in amplitude by the spatial smoothing, the power spectrum is slightly affected on all scales. Figure 5 shows that the synthetic data closely reproduces the correct power spectrum, particularly for the map with 10 stars per cell. Because the synthetic map is computed with approximately the same total number of stars as in the Taurus map, we assume that the observational map with 10 stars per cell should also closely match the correct power spectrum.

Furthermore, the angular resolution of the 13CO map of Taurus is intermediate between that of the extinction maps with 10 and 3 stars per cell, so it is the power spectra from these extinction maps that should be compared with the power spectrum of the CO map. The power spectrum slope for the dust is therefore approximately -1.2, much lower than the value of approximately -1.8 inferred from the CO emission.
4. Discussion
Radiative transfer effects and spatial variations of the gas temperature due to the complex cloud structure were accounted for by Padoan et al. (2004) in deriving the power spectrum slope of the 13CO map of the Taurus, Rosette and Perseus molecular cloud complexes. Depletion was estimated to be of secondary importance at the range of of the Taurus map. In their study of the Chamaeleon complex, Hayakawa et al. (2001) found evidence of variations of 13CO versus from cloud to cloud, which they attributed to chemical fractionation increasing the 13CO abundance in regions with mag. Although their result was not confirmed by Kainulainen et al. (2006), CO abundance variations may exist and may complicate the statistical analysis of CO maps. As Padoan et al. (2004) assumed a constant 13CO abundance in their models, it is possible that the 13CO power spectra they derive are affected by variations in the 13CO abundance. However, the three-dimensional spatial distribution of the 13CO abundance in a young turbulent cloud complex such as Taurus cannot be estimated with any degree of confidence, unless the chemical model is coupled with the fluid equations and computed within a large simulation of supersonic turbulence. In the absence of such a computation, we prefer to assume a constant 13CO abundance in the approximate range mag of the 13CO map of the Taurus region.
In the following we discuss two possible sources of the difference between the extinction and the 13CO maps. First we consider the variation of the extinction efficiency due to grain growth toward regions of larger density. If grain growth occurs and is not accounted for, variations in the near-infrared extinction curve could cause an overestimate of the dust column density in regions of large extinctions. Second, we study the effect of variations of CO abundance, due to the formation and depletion of CO molecules, on the gas power spectrum. We finnd that variations in extinction efficiency or CO abundance are unlikely to cause very significant variations of the power spectra.
We then briefly discuss preliminary results of numerical simulations of the clustering of heavy particles in turbulent flows, which suggest the observed power spectrum discrepancies may originate from intrinsic differences between the spatial distributions of dust and gas, particularly on small scales. Finally, we address the role of the magnetic field strength.
4.1. Grain Growth and NIR Extinction Efficiency
As explained above, in the extinction map method the NIR color excess, , is transformed into visual extinction, , based on the Rieke and Lebofsky (1985) extinction law, giving the relation . It is believed that the assumption of a standard extinction law does not introduce significant errors in the column density determination, because the NIR reddening law has been found to have little variations in different lines of sight through the Galaxy, according to results reviewed in Mathis (1990). However, the old studies inferring a universal NIR extinction laws were all based on rather low-extinction data, for example mag in Savage and Mathis (1979) and mag in Cardelli, Clayton and Mathis (1989). A more recent study of the NIR extinction curve at higher values of extinction by Moore et al. (2005) has found some evidence that the extinction curve tends to flatten with increasing extinction, as predicted in the case of grain growth.
These new results at higher extinction are not surprising, as it is well established that grain reprocessing occurs at relatively large density in interstellar clouds. Variations in the extinction parameter, , from the interstellar average of 3.1 to 4 or 5 in dark clouds and star-forming regions, are due to the flattening of the extinction curve at optical wavelengths. The flattening is interpreted as modifications of the population of small grains, due to ice mantle deposition and grain coagulation (e.g. Cardelli and Clayton 1991; Kim, Martin and Hendry 1993). Evidence of a decreased population of small grains due to grain coagulation, and formation of large fluffy aggregates has also been found at FIR wavelengths in dense filaments in Taurus (Stepnik et al. 2003), in the Polaris cirrus cloud (Bernard et al. 1999; Cambrésy et al. 2001) and in a condensation of the Orion complex (Ristorcelli et al. 1998), thanks to a combination of IRAS and PRONAOS data. Grain growth with increasing density in dark clouds has also been probed by the increase in the wavelength of maximum polarization by absorption, interpreted as the result of ice mantle deposition in Taurus (Whittet et al. 2001) and grain coagulation in Ophiuchi (Vrba, Coyne and Tapia 1993). Finally, IR scattering also provides additional evidence of grain processing (e.g. Castelaz et al. 1985; Yamashita et al. 1989).
The standard NIR extinction law corresponds to a power law , with (Cardelli et al. 1989; Martin and Whittet 1990). Moore et al. (2005) found a range of values of , between 1.11 and 1.93, toward 9 ultracompact HII regions, with a clear trend of to decrease with increasing extinction. This result indicates that grain processing operates at large extinction and the NIR extinction curves is therefore not universal as usually assumed based on low extinction data. It is therefore possible that the extinction efficiency of dust grains varies in regions of large extinction, affecting the conversion of NIR reddening into column density. Indeed, the extinction efficiency is expected to increase, causing an overestimate of the column density derived from NIR reddening, if this effect is not accounted for.
In interstellar clouds, the typical size of dust grains affecting the NIR extinction is approximately 0.2 m. A modest grain growth by a factor of two would bring the typical size to 0.4 m. This is precisely the range of sizes where the Rayleigh regime starts to be violated at the NIR bands, causing a significant increase of the scattering and extinction efficiency (Kruegel and Siebenmorgen 1994). Figure 2 of Kruegel and Siebenmorgen (1994) shows that graphite grains can increase their extinction cross section at a wavelength of 2.2 m by almost an order of magnitude, as the grain size increases from 0.2 to 0.4 m. The variation in the extinction cross section of carbonaceous grains is instead much more modest. In the models of Kruegel and Siebenmorgen (1994) the maximum extinction is obtained with a grain radius of 1 m, for silicate grains, and a radius of 0.3 m for carbonaceous grains.
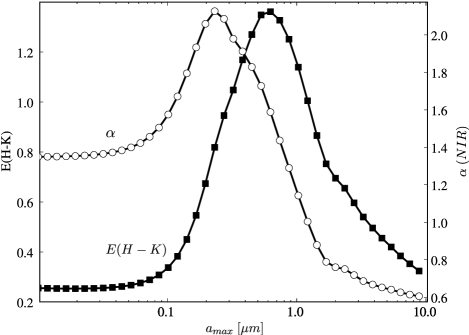
A comprehensive study of the modifications of grain chemical composition, density, shape and size with gas density in interstellar clouds and the resulting variations of the grains extinction efficiency is required to accurately convert the observed NIR reddening into column density. Realistic grain models should be non-spherical (to explain the observed polarization) and should contain a mixture of graphite, silicates, ices and empty space within each grain (Mathis and Whiffen 1989; Voshchinnikov and Mathis 1999). Such a study is beyond the scope of the present work. Here we only provide an example based on standard grain models. It is well known that the slope of the grain size distribution is constrained primarily by the value of , while the maximum grain radius, , is constrained by the UV extinction curve (Mathis 1990). Therefore, in Figure 6, we show, as an example, the variation of the NIR color excess, , as a function of (for a fixed column density of dust), based on the standard MRN grain size distribution, (Mathis, Rumpl and Nordsieck 1977).
In Figure 6, the minimum grain size is constant, =0.5 nm, and we have adopted the optical dust properties calculated by Draine (http://www.astro.princeton.edu/draine/). We plot the result for silicate and graphite grains alone and for a mixture of the two with the ratio of grain number Si:Gr=1.8. The corresponding values of the spectral index , calculated between the and bands, , using monochromatic values, are also plotted in the same figure. These values of are consistent with those found by Moore et al. (2005), if the value of for the mixture of graphite and silicate grains in the observed regions varies within the approximate range 0.3-1 m as the density increases.111Notice that Moore et al.’s study is for regions with mag, so realistic variations of in our range of values of may be smaller. On the other hand, Moore et al.’s sightlines are several kpc. Although the total Av is high, a large fraction of the material may be unshielded and at low density.
Figure 6 shows that can grow at most by a factor of 4, for the mixture of silicate and graphite grains. This maximum variation of a factor of 4 is obtained if grows from 0.1 m in low density regions to 0.6 m in high density regions. We have estimated that such a variation could explain the shallow power spectrum of the extinction maps, as due to an increasingly overestimated cloud column density toward increasing density (hence values). However, the required range of values for is probably unrealistic, given the observational constraints from the extinction curve. The interstellar extinction curve of regions of low extinctions is well reproduced by an MRN grain size distribution of spheroidal grains with m (Gupta et al. 2005). If this is the value of in regions of relatively low density, Figure 6 shows that can only increase with density by less than a factor of two, as the maximum grain size grows from m to m. In other words, neglecting the process of grain growth can only cause errors of less than a factor of two in the dust column density based on , which is insufficient to explain the difference between the gas and the dust power spectra.
4.2. CO Formation and Depletion

Padoan et al. (2004) argued that CO depletion could not affect significantly their estimate of the power spectrum of the 13CO map of the Taurus region, because only a small fraction of the mapped area would correspond to mag, at the resolution of the Nagoya University survey. However, they could not quantify that statement, because there is no way to know a priori if larger column density values are not observed because they are absent or because of depletion. Similarly, Padoan et al. (2004) argued that CO formation could not affect much the power spectrum, because that would be relevant only for mag. In reality, one dimensional PDR models show that the 13CO line intensity becomes linear with column density only around mag (van Dishoeck & Black 1988; Hollenbach & Tielens 1997). From the 13CO map alone, there is no way to estimate this CO formation effect on the power spectrum, because we don’t know if the absence of emission corresponds to very low total column density or to a low CO abundance.
However, the dust extinction map allows us to directly test the effect of CO formation and depletion. If we assume the dust faithfully traces the total column density, then the extinction map reveals the regions with mag, where depletion is expected to be important, and the regions with mag, where CO formation should be accounted for. A simple test of depletion is to recompute the power spectrum of the extinction map after imposing that mag in all regions where we actually find mag. This mimics the fact that a 13CO map of the same region suffering from strong depletion would saturate at approximately that value of . One would expect this effect to indeed yield a steeper power spectrum, by smoothing out sharp small scale structures. A simple test for CO formation is to recompute the power spectrum of the extinction map after imposing that mag in all regions where we actually find mag. This may be an exaggerated way to mimic the effect of CO formation. Nevertheless, we expect this effect to go in the direction of making the power spectrum shallower, by reducing the power in smooth large scale structures. If this is the case, accounting for CO formation can only increase the discrepancy between dust and gas power spectra, and a detailed modeling of that effect could not change the conclusion of this paper, and is therefore not necessary for our present purposes.
The result of the “depletion test” is that the slopes of the power spectra corresponding to those in Figure 2 change by an insignificant amount, from -1.20, -1.26, and -1.41 to -1.25, -1.31, and -1.41 (the change is very small even if the threshold is taken to be 7 mag instead of 10 mag). This confirms that, at a resolution of a few arc-minutes in the Taurus region, CO depletion can only have minor effects on the power spectrum of a 13CO map, as regions with mag are rare, small and barely resolved. Furthermore, it is well understood that extinction maps tend to systematically underestimate the extinction in the regions of largest column density, as such regions can be detected only if a particularly bright stars is present in the background. We don’t even try to correct for this bias, as it can only increase the already large discrepancy between the gas and the dust.
The “CO formation test” goes in the predicted direction as well; it makes the power spectrum shallower, which would further increase the discrepancy with the gas power spectrum. The slopes change from -1.20, -1.26, and -1.41 to -1.20, -1.15, and -1.18. In other words, if regions with mag had to contain a 13CO abundance much below the dark cloud value, the CO power spectrum, based on the extinction map, would be expected to yield a slope of approximately -1.20, instead of the estimated value of approximately -1.8. CO formation, therefore, is not a candidate to explain the observed discrepancy either.
The combined result of the two tests is illustrated in Figure 7. The power spectrum slope one would predict for the CO map, based on the dust extinction map (assumed to faithfully trace the total column density), are -1.23, -1.18, and -1.18, completely inconsistent with the 13CO observations.

4.3. Clustering of Dust Grains by the Cloud Turbulence
If the power spectrum of the dust column density is indeed shallower than the power spectrum of the gas column density, fluctuations in the dust to gas ratio must be present, with amplitude increasing toward smaller scales. Such fluctuations are indeed the main effect of the clustering of dust grains due to the cloud turbulence. A detailed discussion of this process in the context of molecular clouds is given in Padoan et al. (2006, in preparation). In summary, turbulent flows advect heavy particles by gas drag and concentrate them in regions of low flow vorticity, because the particles are centrifugally expelled from vorticity tubes (Maxey 1987). The amplitude of the clustering grows toward smaller scale, all the way down to the scale of Brownian diffusion. As a result, fluctuations of the dust to gas ratio are created, and can reach a few orders of magnitude at the Brownian scale, of order cm. The amplitude of the clustering depends also on the particle size, with the largest values for particles with friction timescale equal to the Kolmogorov timescale (the dynamical time of the turbulence at the Kolmogorov dissipation scale).
The relative motion of such particles is controlled primarily by the gas turbulence at the Kolmogorov dissipation scale, of order cm. However, preliminary results in Padoan et al. (2006, in preparation) show that the particles cluster on all scales, with amplitude decreasing with increasing scale. As a result, the projected density of particles exhibit a shallower power spectrum than the projected density of the turbulent gas. The power spectra of both gas and particle projected density are shown in Figure. 8 (lower and upper solid lines respectively). A difference between particle and gas power spectra on all scales is obtained for particles with friction time of the order of the Kolmogorov time (in Figure. 8 the particle power spectrum is shown for particles with friction time equal to twice the Kolmogorov time). For typical physical parameters of molecular cloud, this corresponds to dust grains of roughly the same size as the grains that dominate the NIR extinction resulting in the 2MASS maps.
The simulations of Padoan et al. (2006, in preparation) compute the trajectories of inertial particles embedded in a turbulence flow simulated on a mesh of computational cells. The turbulent flow is transonic and is not magnetized. Although the slope of the power spectrum shown in Figure 8 is roughly the same as the slope of the 2MASS extinction map of the Taurus molecular cloud, the simulations cannot be compared directly with the observations, as they are meant to represent a smaller scale ( pc), where the turbulence is not supersonic. The effect of magnetic fields can also be important in the particle transport, because the gyration time of the grains is typically shorter than their gas friction time (Yan, Lazarian and Draine 2004). However, our numerical result shows that grain clustering by the cloud turbulence can potentially be a dominant mechanism to generate small scale fluctuations of the dust to gas ratio and hence a power spectrum of dust column density shallower than the power spectrum of the gas column density. A similar mechanism may still operate in magnetized and highly supersonic turbulent flows.
4.4. Average Magnetic Field Strength
Padoan et al. (2004) concluded that the estimated power spectrum slope in the Taurus region (in the Rosette and Perseus molecular cloud complexes as well) is consistent with supersonic and super-Alfvénic turbulence, while flow models with much stronger magnetic fields are ruled out, as they predict a shallower power spectrum than observed. We are here referring to the value of the magnetic field strength volume averaged over the entire Taurus molecular cloud complex. Individual cores are likely to have an enhanced field strength much larger than the averaged value, as a natural result of shock compressions in super-Alfvénic turbulence. This idea was first proposed by Padoan and Nordlund (1999), and is still considered controversial by some researchers, due to the difficulty of directly mapping the magnetic field strength in molecular clouds.
The shallower power spectrum of the dust extinction map compared with the CO map may be taken as evidence that the average magnetic field strength in the Taurus region is stronger than inferred by Padoan et al. (2004). However, this conclusion would be incorrect for the following reason. The combined analysis of the present work and of Padoan et al. (2004) does not leave much space to believe that the 13CO power spectrum we derive is greatly unreliable and does not trace at all the total column density. Once major radiative transfer, chemistry and depletion effects are ruled out on the scales of interest, we are truly compelled to question our understanding of interstellar dust grains, their composition and optical properties, their formation and evolution, and their dynamics in a turbulent magnetized gas. In the light of these many uncertainties still characterizing the physics of interstellar dust, it is legitimate to ask “Can we trust the dust?” and to propose that the agreement between the power spectrum predicted by super-Alfvénic turbulence and the observed one is not a mere coincidence.
Finally, the main source of the three dimensional temperature and radiative transfer effects discussed in Padoan et al. (2004), and of the results of the synthetic dust extinction modeling presented here, is the strong inhomogeneity of the density field in supersonic turbulence. The detailed statistics of such a density field and their dependence on the magnetic field strength could only cause small modifications to these analysis. In this work we have used a purely hydrodynamical simulation because it is the largest simulation of supersonic turbulence to date, and the presence of a huge range of scales of turbulent density fluctuations is far more important for simulating the extinction measurements than the detailed statistics of that density field.
5. Conclusions
We have studied the power spectrum of NIR extinction maps of the Taurus region and found that it is significantly shallower than the power spectrum obtained by Padoan et al. (2004) from a 13CO map of the same region. The extinction map has a power spectrum slope of approximately -1.2, while the gas map has a slope of approximately -1.8. The 13CO study in Padoan et al. (2004) relied on detailed modeling of the observations based on three dimensional simulations of supersonic turbulence and radiative transfer calculations. Here we have further ruled out other uncertainties, related to the processes of CO formation and depletion, as a possible explanation for the observed discrepancy. The present extinction study relies on three dimensional simulations of supersonic turbulence as well, in order to reproduce the observations and compute synthetic extinction maps. The synthetic extinction maps confirm that the power spectrum derived from the observations should correspond to the power spectrum of the actual spatial distribution of the dust, if the extinction is proportional to the dust column density.
The discrepancy between the power spectrum slope of the dust and that of the gas could be in part understood if the dust column density were increasingly overestimated towards larger extinctions, due to the effect of grain growth on the grain extinction efficiency. We cannot entirely rule out this explanation, given the still limited knowledge of dust grain properties (different grain models can satisfy the same observational constraints, and most grain models are not realistic enough, as they overestimate the abundance of carbon and silicon relative to ISM values in order to explain the extinction curve –Gupta et al. 2005). However, based on available models, the UV extinction curve is best fit by a value of m, in regions of relatively low extinction. Starting from that size, grain growth can only affect the NIR color excess by less than a factor of two, assuming that grains really grow up to a value m in regions of high extinction. In order to explain the power spectrum slope, the NIR excess should vary by at least a factor of 4, which would be possible only with variations in from 0.1 to 0.6 m. Unless evidence is found in favor of values of m in low extinction regions of Taurus, or unless the available grain models are found to be very unreliable (for example due to the formation of composite fluffy aggregates), our results suggest the existence of intrinsic spatial fluctuations of the dust to gas ratio, with amplitude increasing toward smaller scale.
The comparison between the dust and the gas maps of the Taurus region presented in this work may be further improved in the near future, based on new observational data. Goldsmith et al. (2005) have recently carried out a new survey of the Taurus region, combining 13CO and 12CO spectra from the FCRAO 14 m telescope. The better resolution of this survey compared with the survey from the Nagoya University 4 m telescope (Mizuno et al. 1995) used in Padoan et al. (2004), and the increased range of column density from the combination of 12CO and 13CO spectra, will yield a much improved gas column density map of the Taurus region. One could also measure the spectral type of background stars, at least for positions of unusually large 2MASS extinction relative to CO column density, to reduce the uncertainty of the extinction measurements.
Because grain clustering is expected to be very strong on small scales, high resolution studies of the dust spatial distribution should be well suited to examine this process. Padoan et al. (2006) and Juvela et al. (2006) have extensively investigated a new method of mapping dark clouds by observing their NIR scattered light. Previous observations have already successfully detected dark clouds through the NIR scattering of the normal ISRF (Lehtinen and Mattila 1996; Nakajima et al. 2003; Foster and Goodman 2006). The combination of relatively short wavelength, large ground based telescopes and large NIR cameras will make it possible to map vast areas of interstellar clouds at an unprecedented arc-second resolution, with an estimated uncertainty in column density below 20% in the range mag, based on the simultaneous use of the J, H and K bands (Juvela et al. 2006). NIR scattering maps may therefore provide evidence of dust segregation by directly imaging the spatial clustering of dust grains.
Finally, the process of inertial particle clustering has so far been confirmed with simulations of incompressible or transonic hydrodynamic turbulence. A similar process may occur also in magnetized and highly supersonic turbulent flows such as those found in molecular clouds, and future simulations of inertial particles in this regime of turbulence will be necessary for a direct comparison with observations of parsec scale regions.
References
- Bernard et al. (1999) Bernard, J. P., et al. 1999, A&A, 347, 640
- Bohlin et al. (1978) Bohlin, R. C., Savage, B. D., & Drake, J. F. 1978, ApJ, 224, 132
- Cambrésy et al. (2001) Cambrésy, L., Boulanger, F., Lagache, G., & Stepnik, B. 2001, A&A, 375, 999
- Cambrésy et al. (2002) Cambrésy, L., Beichman, C. A., Jarrett, T. H., & Cutri, R. M. 2002, AJ, 123, 2559
- Cardelli et al. (1989) Cardelli, J. A., Clayton, G. C., & Mathis, J. S. 1989, ApJ, 345, 245
- Cardelli & Clayton (1991) Cardelli, J. A., & Clayton, G. C. 1991, AJ, 101, 1021
- Castelaz et al. (1985) Castelaz, M. W., Hackwell, J. A., Grasdalen, G. L., Gehrz, R. D., & Gullixson, C. 1985, ApJ, 290, 261
- Colella & Woodward (1984) Colella, P., & Woodward, P. R. 1984, Journal of Computational Physics, 54, 174
- Dame et al. (2001) Dame, T. M., Hartmann, D., & Thaddeus, P. 2001, ApJ, 547, 792
- Foster & Goodman (2006) Foster, J. B., & Goodman, A. A. 2006, ApJ, 636, L105
- Goldsmith et al. (2005) Goldsmith, P., Tang, Y., Heyer, M., Narayanan, G., Snell, R., Brunt, C., & Li, D. 2005, American Astronomical Society Meeting Abstracts, 207,
- Gupta et al. (2005) Gupta, R., Mukai, T., Vaidya, D. B., Sen, A. K., & Okada, Y. 2005, A&A, 441, 555
- Hayakawa et al. (2001) Hayakawa, T., Cambrésy, L., Onishi, T., Mizuno, A., & Fukui, Y. 2001, PASJ, 53, 1109
- Hollenbach & Tielens (1997) Hollenbach, D. J., & Tielens, A. G. G. M. 1997, ARA&A, 35, 179
- Juvela et al. (2006) Juvela, M., Pelkonen, V. M., Padoan, P., & Mattila, K. 2006, ArXiv Astrophysics e-prints, arXiv:astro-ph/0603354
- Kainulainen et al. (2006) Kainulainen, J., Lehtinen, K., & Harju, J. 2006, A&A, 447, 597
- Kim et al. (1993) Kim, S.-H., Martin, P. G., & Hendry, P. 1993, Bulletin of the American Astronomical Society, 25, 806
- Kruegel & Siebenmorgen (1994) Kruegel, E., & Siebenmorgen, R. 1994, A&A, 288, 929
- Lada et al. (1994) Lada, C. J., Lada, E. A., Clemens, D. P., & Bally, J. 1994, ApJ, 429, 694
- Lehtinen & Mattila (1996) Lehtinen, K., & Mattila, K. 1996, A&A, 309, 570
- Lombardi & Alves (2001) Lombardi, M., & Alves, J. 2001, A&A, 377, 1023
- Martin & Whittet (1990) Martin, P. G., & Whittet, D. C. B. 1990, ApJ, 357, 113
- Mathis (1990) Mathis, J. S. 1990, ARA&A, 28, 37
- Mathis et al. (1977) Mathis, J. S., Rumpl, W., & Nordsieck, K. H. 1977, ApJ, 217, 425
- Mathis & Whiffen (1989) Mathis, J. S., & Whiffen, G. 1989, ApJ, 341, 808
- Maxey (1987) Maxey, M. R. 1987, Physics of Fluids, 30, 1915
- Mizuno et al. (1995) Mizuno, A., Onishi, T., Yonekura, Y., Nagahama, T., Ogawa, H., & Fukui, Y. 1995, ApJ, 445, L161
- Moore et al. (2005) Moore, T. J. T., Lumsden, S. L., Ridge, N. A., & Puxley, P. J. 2005, MNRAS, 359, 589
- Nakajima et al. (2003) Nakajima, Y., et al. 2003, AJ, 125, 1407
- Padoan et al. (1998) Padoan, P., Juvela, M., Bally, J., & Nordlund, A. 1998, ApJ, 504, 300
- Padoan et al. (2004) Padoan, P., Jimenez, R., Juvela, M., & Nordlund, Å. 2004, ApJ, 604, L49
- Padoan et al. (2006) Padoan, P., Juvela, M., & Pelkonen, V.-M. 2006, ApJ, 636, L101
- Rieke & Lebofsky (1985) Rieke, G. H., & Lebofsky, M. J. 1985, ApJ, 288, 618
- Ristorcelli et al. (1998) Ristorcelli, I., et al. 1998, ApJ, 496, 267
- Savage & Mathis (1979) Savage, B. D., & Mathis, J. S. 1979, ARA&A, 17, 73
- Stepnik et al. (2003) Stepnik, B., et al. 2003, A&A, 398, 551
- van Dishoeck & Black (1988) van Dishoeck, E. F., & Black, J. H. 1988, ApJ, 334, 771
- Voshchinnikov & Mathis (1999) Voshchinnikov, N. V., & Mathis, J. S. 1999, ApJ, 526, 257
- Vrba et al. (1993) Vrba, F. J., Coyne, G. V., & Tapia, S. 1993, AJ, 105, 1010
- Whittet et al. (2001) Whittet, D. C. B., Gerakines, P. A., Hough, J. H., & Shenoy, S. S. 2001, ApJ, 547, 872
- Yamashita et al. (1989) Yamashita, T., Sato, S., Nagata, T., Gatley, I., Hayashi, S. S., & Fukui, Y. 1989, ApJ, 336, 832
- Yan et al. (2004) Yan, H., Lazarian, A., & Draine, B. T. 2004, ApJ, 616, 895