A model for the infrared emission of FSC 10214+4724
Abstract
A model for the infrared emission of the high redshift ultraluminous infrared galaxy FSC 10214+4724 is presented. The model assumes three components of emission: a dusty torus viewed edge-on, clouds that are associated with the narrow-line region and a highly obscured starburst. It is demonstrated that the presence of clouds in the narrow-line region, with a covering factor of 17%, can explain why the mid-infrared spectrum of FSC 10214+4724 shows a silicate feature in emission despite the fact that its torus is viewed edge-on. It is also shown that the same model, but with the torus viewed face-on, predicts a spectrum with silicate emission features that is characteristic of the spectra of quasars recently observed with .
keywords:
galaxies: active - galaxies: individual (FSC 10214+4724) - infrared: galaxies - dust: - radiative transfer:1 Introduction
The z=2.285 galaxy FSC10214+4724 was discovered 15 years ago by Rowan-Robinson et al. (1991). At the time of its discovery it was thought to be one of the most luminous objects in the Universe. It was later found to be gravitationally lensed by a factor 10-100 (Broadhurst & Lehar 1995, Graham & Liu 1995, Serjeant et al. 1995, Eisenhardt et al. 1996). It is still the best studied ultraluminous infrared galaxy at that redshift. Rest frame optical-UV spectroscopy and spectropolarimetry showed that FSC 10214+4724 exhibits similar characteristics to Seyfert 2 galaxies (Elston et al. 1994, Lawrence et al. 1993, Goodrich et al. 1996). A large quantity of molecular gas is suggested by CO observations (Brown & Vanden Bout 1991, Solomon et al. 1992, Scoville et al. 1995). The object is also bright in the submillimetre. It is therefore likely that FSC 10214+4724 is similar to some local ultraluminous infrared galaxies which harbour simultaneously a luminous starburst and an AGN (e.g. Genzel et al. 1998).
Radiative transfer models of emission from dust in a starburst or an AGN were used in an attempt to understand the origin of the infrared emission of FSC10214+4724. Rowan-Robinson et al. (1993) showed that good fits to the overall spectral energy distribution (SED) could be obtained with both a starburst and an AGN model. The dust density in the latter falls off as and varies exponentially with azimuthal angle (Efstathiou & Rowan-Robinson 1995). Green & Rowan-Robinson (1996) concluded that starburst or AGN activity alone can not explain the SED of FSC 10214+4724 but instead a combination of the two is needed. Granato, Danese & Franceschini (1996) found that a good fit to the SED of FSC 10214+4724 and other hyperluminous infrared galaxies could be obtained with pure dust-enshrouded AGN models. The limited wavelength coverage in the infrared is the main reason why modeling attempts in the mid-90s remained inconclusive.
Recently Teplitz et al. (2006) presented a mid-infrared spectrum for FSC 10214+4724 which was obtained with the Infrared Spectrograph onboard (Houck et al. 2004). This spectrum places strong constraints on models of the infrared emission of this object. What is interesting about the spectrum presented by Teplitz et al. is that the silicate feature appears in emission. This is surprising given the type 2 nature of the AGN in FSC 10214+4724. Local examples of type 2 AGN (e.g. NGC1068) show silicate features in absorption in agreement with radiative transfer models of dusty tori viewed almost edge-on (Pier & Krolik 1992, Granato & Danese 1994, Efstathiou & Rowan-Robinson 1995). The spetrum presented by Teplitz et al. shows no signs of PAH features except possibly a weak 6.2 feature. This implies that the starburst if present is weak or highly obscured.
In this letter radiative transfer models of dusty AGN and dusty starbursts are used to fit the now detailed SED of FSC 10214+4724. Section 2 describes briefly the radiative transfer models to be used. In section 3 the results are presented and briefly discussed. A flat Universe is assumed with and H0=71Km/s/Mpc.
2 Radiative transfer models
2.1 Starburst models
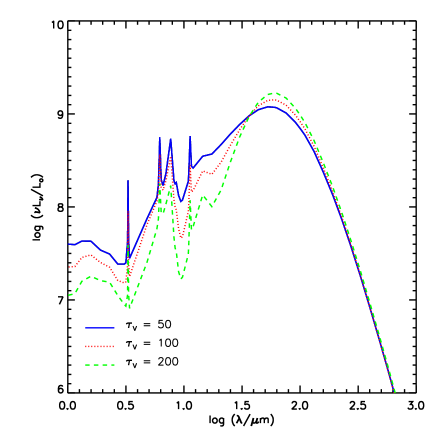
Radiative transfer models for starbursts were presented by Rowan-Robinson & Crawford (1989), Rowan-Robinson & Efstathiou (1993), Krügel & Siebenmorgen (1994), Silva et al. (1998), Efstathiou et al. (2000), Siebenmorgen et al (2001), Tagaki et al. (2003), Dopita et al. (2005). For this study the models of Efstathiou et al. (2000) which were extended to higher optical depths by Efstathiou & Siebenmorgen (2005) will be used. The models incorporate the stellar population synthesis models of Bruzual & Charlot (1993), a simple model for the evolution of the molecular clouds that constitute the starburst and detailed radiative transfer that includes the effect of transiently heated particles/PAHs (Siebenmorgen & Krügel 1992). In Fig. 1 the model predictions for starbursts of different optical depths are compared. As expected the ratio of far- to mid-infrared luminosity increases with optical depth whereas the submillimeter spectrum remains largely unaffected. The model with predicts an SED similar to that of the nearby starburst galaxy M82 whereas the most optically thick model gives an SED similar to that of the heavily obscured ultraluminous infrared galaxy Arp220.
2.2 AGN torus models
Models of the infrared emission from dusty tori and discs were presented by Pier & Krolik (1992, 1993), Granato & Danese (1994), Efstathiou & Rowan-Robinson (1995), van Bemmel & Dullemond (2003), Dullemond & van Bemmel (2005). Discussion centred on the problem of minimizing the silicate emission features at 10 which were not observed in the ground-based 8-13 observations of predominantly Seyfert galaxies by Roche et al. (1991). The non-detection of silicates was attributed either to the torus geometry (Pier & Krolik 1992, Efstathiou & Rowan-Robinson 1995) or to the destruction of silicate dust in the inner torus (Granato & Danese 1994). Rowan-Robinson (1995) and more recently Nenkova et al. (2002) proposed that the non-detection of silicates is due to the clumpiness of the dust but Dullemond & van Bemmel (2005) showed that clumpiness does not necessarily eliminate the silicate features.
Recent results from (Siebenmorgen et al. 2005, Hao et al. 2005) showed that quasars emit emission features both at 10 and 18. Although a detection of silicate emission in a LINER was also reported by Sturm et al. (2005) it seems that silicate emission is found mainly in high luminosity AGN. This is an observational fact that models of the infrared emission of AGN must therefore explain. The models should also explain the fact that some luminous type 2 AGN like FSC 10214+4724 (see also Sturm et al 2006) also show emission features at 10.
Another observational fact is that about half of the mid-infrared emission of the prototypical Seyfert 2 galaxy NGC1068 is extended and coincides with the narrow line region (e.g Cameron et al 1993, Braatz et al 1993, Galliano et al. 2005). Efstathiou, Hough & Young (1995) presented a model for the nuclear spectrum of NGC1068 that involved a tapered disc (Efstathiou & Rowan-Robinson 1995) and optically thin dust in a conical region. The latter may actually reside in the narrow line region (NLR) clouds. The model considered in this letter for the AGN contribution to the spectrum of FSC 10214+4724 is a combination of the tapered disc models of Efstathiou & Rowan-Robinson (1995) and a simple model for the emission of clouds that are associated with the NLR. A tapered disc has a thickness that increases linearly with distance from the central source in the inner part of the disc but assumes a constant height in the outer disc. Although the models of Efstathiou & Rowan-Robinson do not consider clumping of the dust in clouds they can be considered as a reasonable approximation to the dust distribution in AGN if the distance between clouds is much less than the size of the torus.
3 Results and discussion
Detailed modeling of the emission of NLR clouds that are illuminated by a central source is beyond the scope of this letter. The emission of such clouds is approximated with that of spherical clouds of dust at a constant temperature. It is assumed that the density in the cloud is uniform and the optical depth in the V band from the center to the surface is 10. The same grain mixture used for the dusty starburst radiative transfer calculations is assumed. A good fit to the spectrum can be obtained by assuming that the NLR dust is concentrated in clouds at a temperature of 200 and 610K with the 200K cloud(s) being about an order of magnitude more luminous. This is broadly in agreement with the findings of Teplitz et al. (2006). The starburst model assumed is the model shown in Fig. 1.
The model assumed for the torus is the most geometrically thin of the models considered by Efstathiou & Rowan-Robinson (). This implies a torus half opening angle of 60o which, however, is very poorly constrained. The model also assumes a ratio of inner to outer disc radius of 0.05, a ratio of height to outer radius of 0.5 and an equatorial optical depth at 1000Å of 1000. It is assumed that the tapered dusty disc in FSC 10214+4724 is viewed edge-on. This means that its mid-infrared radiation is heavily suppressed. The sum of the emission of the NLR dust and the disc is shown in Fig. 2 and 3 whereas the individual spectra are shown in Fig. 4. Note that because the starburst is very optically thick it does not make a significant contribution to the mid-infrared flux. This can explain why there is no evidence of PAH features in the spectrum published by Teplitz et al. except for a weak 6.2 feature that is reproduced by the model.
As can be seen from the plot of the edge-on and face-on spectra emitted by the torus in Fig. 4, the AGN luminosity is highly anisotropic. To obtain the total luminosity one needs to multiply the ‘apparent’ torus luminosity with the anisotropy correction factor which is defined to be
where is the bolometric emission at angle . For the particular tapered disc model and inclination, is found to be 18.1. The emission by the NLR dust is assumed to be isotropic. With this correction the AGN luminosity is predicted to be . The luminosity of the 200K NLR dust is predicted to be or 15% of the total AGN luminosity. As mentioned above the luminosity of the 610K dust is about an order of magnitude lower or 2% of the total. As the NLR clouds are assumed to be optically thick, the fraction of total AGN luminosity emitted by the 200 and 610K dust is also the covering factor of the NLR dust. The starburst luminosity is predicted to be . Note that all of the quoted luminosities need to be reduced by a factor 10-100 due to gravitational lensing. Lens models suggest that the optical emission may be more highly magnified than the infrared emission that dominates the bolometric luminosity. Eisenhardt et al. (1996) estimate a magnification factor for the infrared emission of 30 which implies that the AGN luminosity is of the order of . Note, however, that since the emission by the NLR dust and the torus does not arise from the same region it is possible that their magnification will be different.
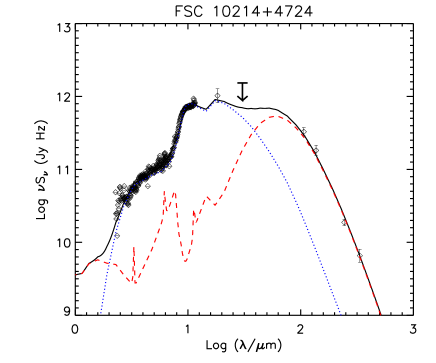
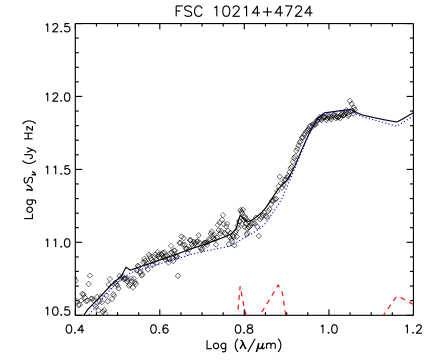
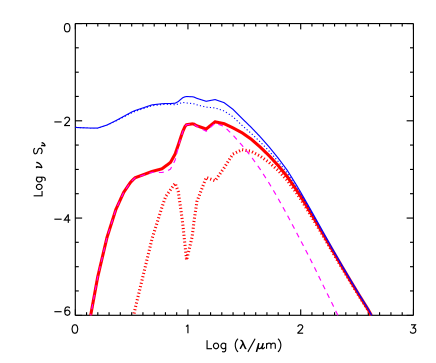
As it is demonstrated in Figs. 2, 3 and 4 the presence of dust in the narrow-line region of an AGN nucleus, with a covering factor of 17%, can explain the fact that silicate features appear in emission both in luminous type 2 and type 1 AGN. The presence of these features in type 2 AGN is entirely consistent with the unified scheme (Antonucci 1993) as a dust torus that makes an insignificant contribution in the mid-infrared may still be present. The anisotropy of the emission from such a torus is so high that when the same system is viewed face-on the torus emission dominates and the effect of the presence of the NLR dust is to make the silicate emission features more prominent. The face-on spectrum shown in Fig. 4 is similar to the spectra of quasars recently observed with .
A question that naturally arises is why lower luminosity type 2 AGN do not show the same effect. There are probably two reasons for this: firstly in lower luminosity type 2s the ratio of the luminosity of the acompanying starburst to that of the AGN is higher so what we see in the mid-infrared is the complex of PAH features and silicate absorption features emitted by the starburst. Secondly the torus opening angle in lower luminosity AGN may be smaller and therefore the fraction of the source luminosity that is intercepted by NLR dust is smaller. This was already suggested by Lawrence (1991) who estimated the statistics of type 1 and type 2 AGN from different surveys. As proposed by Lawrence this dependence on luminosity may arise if the thickness of the torus is independent of luminosity and its inner radius is controlled by dust sublimation.
Acknowledgments
I thank Harry Teplitz for providing the spectrum of FSC 10214+4724 in electronic form and Ralf Siebenmorgen for useful discussions. I also thank the referee Andy Lawrence for his comments and suggestions that led to a significant improvement of this letter.
References
- [] Antonucci R. 1993, ARA&A, 31, 473
- [] Braatz, J.A., Wilson, A.S., Gezari, D.Y., Varosi, F., Beichman, C.A. 1993, ApJ, 409, L5
- [] Broadhurst, T., & Lehar, J. 1995, ApJ, 450, L41
- [] Brown, R.L., & Vanden Bout, P.A. 1991, AJ, 102, 1956
- [Bruzual & Charlot(1993)] Bruzual A.G., Charlot S. 1993, ApJ, 405, 538
- [] Cameron, M., Storey, J.W.V., Rotaciuc, V., Genzel, R., Verstraete, L., Drapatz, S., Siebenmorgen, R., Lee, T.J. 1993, ApJ, 419, 136
- [] Dopita, M.A., et al. 2005, ApJ, 619, 755
- [] Dullemond, C.P., van Bemmel, I.M. 2005, A&A, 436, 47
- [Efstathiou & Rowan-Robinson(1995)] Efstathiou A., Rowan-Robinson M. 1995, MNRAS, 273, 649
- [Efstathiou et al 1995] Efstathiou, A., Hough, J.H., & Young, S. 1995, MNRAS, 277, 1134
- [Efstathiou, Rowan-Robinson & Siebenmorgen(2000)] Efstathiou A., Rowan-Robinson M., Siebenmorgen R. 2000, MNRAS, 313, 734
- [] Efstathiou, A., & Siebenmorgen, R. 2005, AA, 439, 85
- [] Eisenhardt, P.R., Armus, L., Hogg, D.,W., Soifer, B.T., Neugebauer, G., Werner, M.W. 1996, ApJ, 461, 72
- [] Elston, R., McCarthy, P.J., Eisenhardt, P., Dickinson, M., Spinard, H., Januzzi, B.T., & Maloney, P. 1994, AJ, 107, 910
- [] Galliano, E., Pantin, E., Alloin, D., Lagage, P.O. 2005, MNRAS, 363, L1.
- [Genzel et al.(1998)] Genzel R. et al. 1998, ApJ, 498, 579
- [] Goodrich, R.W., Miller, J.S., Martel, A., Cohen, M.H., Tran, H.D., Ogle, P.M., & Vermeulen, R.C. 1996, ApJ, 456, L9
- [] Graham, J.R., & Liu, M.C. 1995, ApJ, 449, L29
- [Granato & Danese(1994)] Granato G.L., Danese L. 1994, MNRAS, 268, 235
- [] Granato, G.L., Danese, L., & Franceschini, A. 1996, ApJ, 460, L11
- [] Green, S., & Rowan-Robinson, M. 1996, MNRAS, 279, 884
- [] Hao, L., et al. 2005, ApJ, 625, L75
- [] Houck, J.R., et al. 2004, ApJS, 154, 18
- [Krugel & Siebenmorgen(1994)] Krügel E., Siebenmorgen R., 1994 A&A, 282, 407
- [] Lawrence, A. 1991, MNRAS, 252, 586
- [] Lawrence, A., et al. 1993, MNRAS, 260, 28
- [] Miller J.S., Goodrich R.W. 1990, ApJ, 355, 456
- [] Nenkova M., Ivezic Z., Elitzur M. 2002, ApJ, 570, L9
- [Pier & Krolik(1992)] Pier E. A., Krolik J. H. 1992, ApJ, 401, 99
- [] Pier E. A., Krolik J. H. 1993, ApJ, 418, 673
- [] Roche P.F., Aitken D.K., Smith C.H., Ward M.J. 1991, MNRAS, 248, 606
- [] Rowan-Robinson M. 1992, MNRAS, 258, 787
- [] Rowan-Robinson M. 1995, MNRAS, 272, 737
- [] Rowan-Robinson M. 2000, MNRAS, 316, 885
- [] Rowan-Robinson M. Crawford J., 1989 MNRAS, 238, 523
- [Rowan-Robinson & Efstathiou(1993)] Rowan-Robinson, M., Efstathiou, A. 1993, MNRAS, 263, 675
- [] Rowan-Robinson, M., et al. 1991, Nature, 351, 719
- [] Rowan-Robinson M. et al. 1993, MNRAS, 261, 513
- [] Serjeant, S., Rawlings, S., Lacy, M., McMahon, R.G., Lawrence, A., Rowan-Robinson, M., & Mountain, M. 1995, MNRAS, 298, 321
- [] Siebenmorgen, R., & Krügel, E. 1992, A&A, 259, 614
- [] Siebenmorgen R., Krügel E., Laureijs 2001, A&A, 377, 735
- [] Siebenmorgen, R., Hass, M., Krügel, E., Schulz, B. 2005, A&A, 436, L5
- [] Scoville, N.Z., Yun, M.S., Brown, R.L., & vanden Bout, P.A. 1995, ApJ, 449, L109
- [Silva et al. (1998)] Silva L., Granato G. L., Bressan A. & Danese L. 1998, ApJ, 509, 103
- [] Solomon P.M., Downes, D., & Radford, S.J.E. 1992, ApJ, 398, L29
- [] Sturm, E., et al. 2005, ApJ, 629, L21
- [] Sturm, E., Hasinger, G., Lehmann, I., Mainieri, V., Genzel, R., Lehnert, M.D., Lutz, D., & Tacconi, L.J. 2006, ApJ, in press
- [] Tagaki, T., Arimoto, N., Hanami, H., 2003, MNRAS, 340, 813
- [] Teplitz et al. 2006, ApJ, in press (astro-ph/0601061)
- [van Bemmel and Dullemond(2003)] van Bemmel I. M. Dullemond C.P. 2003, A&A, 404, 1
- [] Verma A., Rowan-Robinson M., McMahon R., Efstathiou A. 2002, MNRAS, 335, 574