MOST111Based on data from the MOST satellite, a Canadian Space Agency mission, jointly operated by Dynacon Inc., the University of Toronto Institute of Aerospace Studies and the University of British Columbia with the assistance of the University of Vienna. DETECTS G- AND P-MODES IN THE B SUPERGIANT HD 163899 (B2Ib/II)
Abstract
The Microvariability and Oscillations of Stars (MOST) satellite observed the B supergiant HD 163899 (B2 Ib/II) for 37 days as a guide star and detected 48 frequencies 2.8 c d-1 with amplitudes of a few milli-magnitudes (mmag) and less. The frequency range embraces g- and p-mode pulsations. It was generally thought that no g-modes are excited in less luminous B supergiants because strong radiative damping is expected in the core. Our theoretical models, however, show that such g-modes are excited in massive post-main-sequence stars, in accordance with these observations. The nonradial pulsations excited in models between at and at are roughly consistent with the observed frequency range. Excitation by the Fe-bump in opacity is possible because g-modes can be partially reflected at a convective zone associated with the hydrogen-burning shell, which significantly reduces radiative damping in the core. The MOST light curve of HD 163899 shows that such a reflection of g-modes actually occurs, and reveals the existence of a previously unrecognized type of variable, slowly pulsating B supergiants (SPBsg) distinct from Cyg variables. Such g-modes have great potential for asteroseismology.
1 INTRODUCTION
The B star region in the HR diagram contains a wide range of variables. The most luminous (luminosity classes of 0-Ia; ) are known as Cyg variables and show semi-regular light and radial-velocity variations on timescales of 1 – 6 weeks (e.g., van Leeuwen et al., 1998). Those variations are thought to be a combination of pulsation and rotational modulation of winds (e.g., van Genderen, 1991; Kaufer et al., 1996, 1997). Pulsations in such very luminous stars can be excited mainly by the Fe-bump of opacity (Rogers & Iglesias, 1992) at a temperature of about K. The excitation mechanism is, however, more affected by the strange-mode character in more luminous stars (Kiriakidis et al., 1993; Glatzel & Mehren, 1996; Dorfi & Gautschy, 2000). The target star discussed in this paper, HD163899 (B2Ib/II), is a supergiant that is less luminous and less affected by winds than the Cyg variables.
There are also many less luminous B-type variable stars whose light and radial-velocity variations are caused by radial and nonradial pulsations. These pulsations are excited by the classical -mechanism at the Fe-bump of opacity. The type of mode excited depends mainly on the effective temperature of the stars; radial and nonradial p-mode pulsations are excited in hotter stars and nonradial g-mode pulsations are excited in relatively cooler stars (see e.g., Pamyatnykh, 1999). Most of the stars are main-sequence stars. Hotter p-mode pulsators ( Cephei stars) are more luminous or more massive () than the relatively cooler (B3 – B8) g-mode pulsators, slowly pulsating B (SPB) stars (Waelkens, 1991). Mainly based on line-profile variations, g-modes are known to be excited also in early-type Be stars (e.g., Rivinius et al., 2003).
The Cephei stars have been known for more than a century, but the excitation mechanism was identified only in the early 1990s (Kiriakidis et al., 1992; Moskalik & Dziembowski, 1992) after the emergence of OPAL opacity tables (Rogers & Iglesias, 1992). The observational properties of the Cephei stars are thoroughly discussed by Stankov & Handler (2005).
The SPB stars are nearly perfectly confined to the main-sequence band (e.g., De Cat et al., 2004), in accordance with the theoretical prediction that the radiative core in a post-main-sequence star strongly damps g-modes where they have very short wavelengths (Gautschy & Saio, 1993; Dziembowski et al., 1993). In this paper, however, we show that reflection of pulsation modes at the convective zone associated with the hydrogen-burning shell quenches the radiative damping in the core, and hence the Fe-bump can excite some g-modes in a post-main-sequence massive star with a radiative core.
The Microvariability & Oscillations of STars (MOST) photometric satellite was launched on June 2003 and is fully described by Walker et al. (2003). The first scientific results were published by Matthews et al. (2004).
MOST observations have significantly clarified the properties of pulsating B stars. MOST detected clear light variations in the rapidly rotating O9Ve star Oph (Walker et al., 2005a), which revealed the presence of Cephei-type pulsations in this line-profile variable. MOST found that the mono-periodic Cephei star Ceti is actually multiperiodic with three additional frequencies (Aerts et al., 2006a). MOST discovered a new SPB star, HD 163830 (B5II/III), near the edge of the main-sequence band, detecting 20 g-mode frequencies (Aerts et al., 2006b). MOST detected g-modes and possibly r-modes in the rapidly rotating Be star HD 163868 (Walker et al., 2005b). The latter observations showed, for the first time, that many g-modes can be excited in a rapidly rotating Be star, and provided a natural interpretation of Eri-type variables as SPBe stars. This finding suggests that nonradial pulsations might play a crucial role in Be phenomena.
In this paper, we report another important discovery by the MOST satellite – g-modes in the B supergiant HD 163899.
2 THE MOST OBSERVATIONS
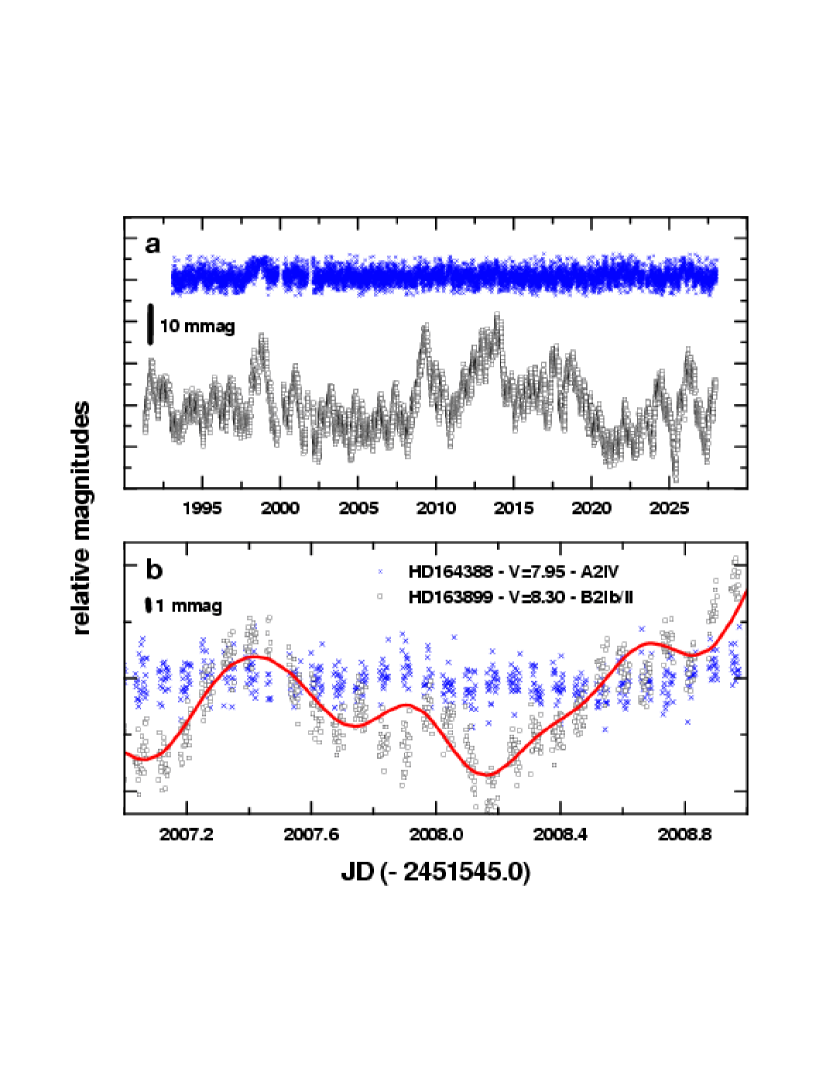
HD 163899 (=8.3, B2 Ib/II) was observed as one of 20 guide stars for the photometry of WR 103 (HD 164270) by the MOST satellite. The observing conditions and the data reduction method were the same as for the SPBe star HD 163868 described in Walker et al. (2005b). Observations were made from 2005 June 14 to July 21 for a total of 36.6 days with values recorded for HD 163899. The data are binned in 2 minute intervals. Since the WR 103 field is outside the MOST Continuous Viewing Zone, the duty cycle was limited to about 50% of the 101 min orbit.
Figure 1 displays the full light curve of HD 163899 and for another guide star, HD 164388 (A2 IV, =8.0), which appears to be constant (standard deviation mmag). An expanded two day portion of the MOST light curve is included to better display the higher frequency variations. The light curve shows many periodicities ranging from about a day to a few days, indicating that many g-mode pulsations are excited in HD163899. Complete light curves for both stars can be downloaded from the MOST Public Archive at www.astro.ubc.ca/MOST.
2.1 The Frequency analysis
The frequency analysis was carried out using CAPER, a collection of Fortran driver routines which use a Discrete Fourier Transform (DFT) as a frequency and amplitude identification tool and non-linear least squares (NLLS) software (Numerical Recipes; Press et al., 1986) to refine the identified parameters. The fitting function is a series of sinusoids (see Walker et al., 2005b).
Periodicities were identified and refined as follows:
a) A frequency/amplitude was identified from the DFT. The amplitude and phase were refined via NLLS. The fit function was subtracted from the data and a new set of parameters was identified from the residuals. The new amplitude and phase was refitted along with all other previously identified amplitudes and phases. The new function was then subtracted from the original time series and new parameters identified. This process is repeated until the next identified frequency has a S/N ( sigma detection) (Kuschnig et al. 1997).
Noise is defined as the mean of the amplitude spectrum c d-1 centered on the identified frequency. The amplitudes are 3 sigma clipped until the mean converges or until the noise of the entire frequency range is reached. (The frequency range between 0 and 10 c d-1 has a noise of 0.22 mmag.)
b) Once the 48 frequencies were identified, the three lowest frequencies, along with their amplitudes and phases were fitted simultaneously by NLLS.
c) The parameters from b) were fixed and all other frequencies, amplitudes, and phases were simultaneously fitted to the original light curve.
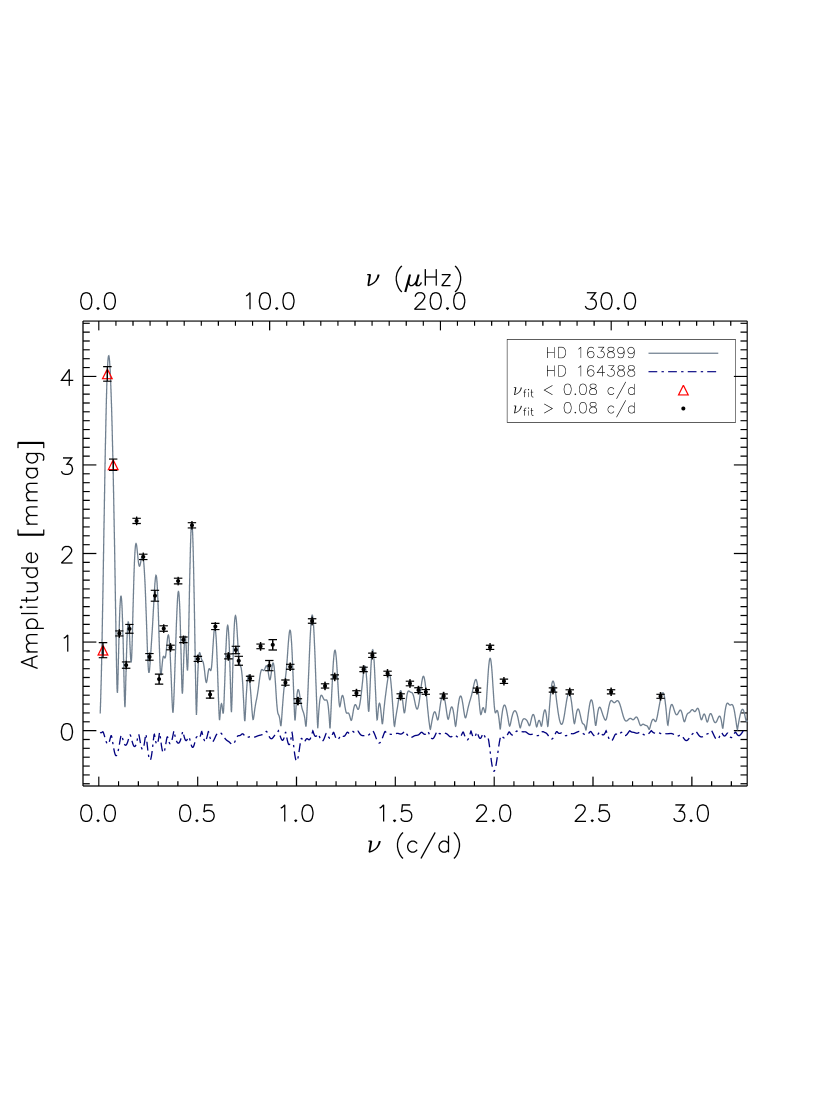
We separate the fitting of the parameters in b) and c) to ensure convergence of the fit. This procedure is similar to low pass filtering of the data (i.e. removal of as much of the long term trend as possible before proceeding). The parameters from (b) are necessary to improve the residuals. The results are presented in Table 1. Figure 2 show the DFT and the DFT of the comparison star and the fit parameters with bootstrapped errors (described in the following paragraph). The lowest frequency f3 in Table 1 has a period of 47 days which is longer than the data and likely to be less accurate.
To assess the precision of our parameter-fitting method in steps (b) and (c) we use a bootstrap technique (see e.g. Wall & Jenkins, 2003). The procedures (b) and (c) are (separately) repeated 10,000 times with a new light curve that is derived from points randomly selected from the original light curve. The new light curve has the same number of data points as the original with the possibility that some points may be repeated. This essentially introduces random gaps in the data. Figure 3 shows a typical distribution for a parameter set. The sigma of the distribution is used to estimate the 1-sigma error bars of each parameter.
It is reasonable to assume that these multiple periodicities are nonradial pulsations simultaneously excited in the star. The analysis has revealed, in addition to the dense low-frequency spectrum, the presence of relatively high frequencies up to 2.8 c d-1 which correspond to p-mode pulsations (i.e. both p- and g-modes are excited simultaneously in HD 163899). To the authors’ knowledge, it is the first clear detection of g-modes in a less luminous B supergiant, although Waelkens et al. (1998)’s list of the Hipparcos Cyg-type supergiants contains some less luminous supergiants with periods of a few days indicating the possible presence of g-modes.
3 MODELING THE OSCILLATIONS
To examine the stability of post-main-sequence models corresponding to B supergiants and bright giants, we have computed evolution models for a mass range of with an initial chemical composition of . We used a Henyey-type stellar evolution code with OPAL opacities (Iglesias & Rogers, 1996). The stability of nonradial pulsations has been examined for selected models by using a finite difference method (Saio & Cox, 1980). The stability of a selected model has also been analyzed with a Riccati shooting code (Gautschy et al., 1996). We have confirmed that the results of the two methods agree well.
Figure 4 shows positions of models in the HR diagram which excite p-modes (triangles) and g-modes (inverted triangles). (The models which excite both g- and p-modes appear as asterisks.) If the angular frequency of pulsation is larger (smaller) than , the mode is classified as a p-mode (g-mode), where and are the gravitational constant and the mean density of the model (see also Fig.5). The p-mode ( Cephei-type) instability range and the usual SPB g-mode instability range for main-sequence stars of agree with those obtained by Pamyatnykh (1999). We also note that the red edge of the radial-mode instability range of models is located at in perfect agreement with the result of Kiriakidis et al. (1993) who examined the stability of radial modes for very massive stars.
In addition to the known instability regions, Figure 4 shows a wide g-mode instability region for the post-main-sequence massive () models. The instability region has not been recognized before. In fact, the stability of g-modes in the post-main-sequence massive stars had not been examined since the emergence of OPAL opacities. [Glatzel & Mehren (1996) examined the stability of p-modes but not of higher-order g-modes.] In the next section, we focus on the the properties of unstable high-order g-modes.
In the hotter part of the instability region p-modes are also excited simultaneously. The position of HD 163899 shown in Figure 4, which is roughly estimated from its spectral type B2 Ib/II, indicates that HD 163899 lies in the newly found instability region. In other words, HD 163899 belongs to a previously unrecognized type of pulsating stars, which we call “slowly-pulsating B-supergiants” (or SPBsg). Strictly speaking, HD 163899, showing both g- and p-modes, is a hybrid of SPBsg and Cephei-type.
Figure 5 shows pulsation frequencies (cycle per day) of excited modes versus effective temperature along the evolutionary tracks of and . The left panel shows each frequency and amplitude of the periodicities of HD 163899 detected by the MOST satellite. The horizontal dotted lines in the middle and the right panels correspond to the MOST frequencies. The dashed lines show the frequency given by along the evolutionary track. This line is used to distinguish between p-modes and g-modes in Figure 4. Figure 6 shows similar plots for , , and .
P-modes are excited in hotter models, while g-modes are excited in relatively cooler ones. The frequencies of the excited g-modes tend to be higher for a larger latitudinal degree . In restricted ranges, both p-modes and g-modes are excited simultaneously, and the corresponding models are appropriate for HD 163899. Since a linear stability analysis cannot predict the amplitudes of unstable modes, we compare in this first attempt only the predicted frequency ranges of excited modes with the observed ones. The observed frequency range is reproduced by the models around and by the models . (These are indicated by vertical dash-dotted lines in Fig. 5.) On the other hand, for and models the frequency gap between p-modes and g-modes looks too large to be consistent with the observed frequency distribution.
Taking into account that the estimated range of for B2Ib/II is roughly between 4.22 and 4.32 (Fig. 4), a model at looks best to reproduce the observed frequency range of HD 163899. Although the frequency gap is still large, it would be filled, at least partially, by rotational splittings. (If a higher is allowed, models at work better.)
In our models, rotation is completely disregarded. In the presence of rotation a pulsation frequency measured in the observer’s frame, (obs), shifts as
| (1) |
from the frequency in the co-rotating frame, (rot), where is the azimuthal order () and is the rotation frequency.
If we assume that HD 163899 rotates at a speed of about 100km/s, an average for B2Ib/II (Abt et al., 2002), the rotation frequency would be c d-1. If we assume for observed pulsation modes, we expect that observed frequencies would be shifted by at most c d-1 from (rot)s which we assume to be close to those obtained for . This effect would nearly fill the frequency gap between p- and g-modes, and make the predicted frequency distribution roughly consistent with the observed one for HD 163899.
It is not possible to perform a detailed comparison between the detected frequencies and theoretical predictions until accurate information on the parameters of HD 163899, such as the effective temperature, the luminosity, and the rotation speed is available. The most important finding in our modeling exercises is the fact that g-modes can be excited in post-main-sequence models, which suggests the presence of a new group of variable stars. We discuss, in the next section, the properties of excited g-modes.
Figures 4 and 5 indicate that earlier B-supergiants should pulsate in p-modes. This theoretical prediction is consistent with the recent observational result of Kaufer et al. (2006) who detected short-period line-profile variations in HD 64760 (B0.5 Ib).
Before we proceed to the next section, we note that there are strongly-excited very-low frequency modes, which are most clearly seen as a lowest-frequency branch in the frequency- diagram for in Figure 5. The amplitude of these modes is strongly confined to the exterior of the bottom of the Fe-convection zone. The frequencies are so low that these modes are propagative even at the outer boundary. Since we use a reflective boundary condition at the outer boundary, we do not regard the stability of these modes to be accurate. Also, the property of these modes would be modified significantly in the presence of slow rotation. Therefore, we have not included these modes in Figure 4. We leave these modes for future investigations.
4 EXCITATION OF G-MODES
We have found that g-modes are excited in massive post-main-sequence stars, whose central part is in radiative equilibrium. This looks contrary to the general thought that g-modes should be damped due to very strong dissipation expected in a radiative core where the Brunt-Väisälä frequency is very high. The excitation becomes possible, however, due to the presence of a fully-developed convective shell associated with the hydrogen-burning shell in a massive star. (Fully-developed convection means that convective mixing is strong enough to homogenize the chemical composition.) Since a g-mode pulsation is evanescent in the convection zone, it can be reflected at the boundary. In other words, the convective shell can prevent a g-mode from penetrating into the radiative core.
Figure 7 shows runs of Lamb frequency , and Brunt-Väisäla frequency , which is approximately written for an ideal gas as
| (2) |
where is the adiabatic sound speed, is the distance from the stellar center, is the local gravity, is the pressure scale height, is the pressure, and is the mean molecular weight. Frequencies of excited g-modes of are shown by dotted horizontal lines. In this figure all quantities are normalized by .
Roughly speaking, the radial wavenumber of a g-mode which pulsates with an angular frequency is proportional to . Therefore, g-modes are radially propagative only if and , and evanescent otherwise (see e.g. Unno et al, 1989; Cox, 1980, for details). Since both and are very large in the radiative core, we expect a very large wavenumber (i.e. very short wavelength) and hence a large radiative damping for a g-mode in the central part. This is the reason why we do not generally expect g-modes to be excited in a post-main-sequence star with a radiative non-degenerate core.
In a massive post-main-sequence star, however, a fully developed convection zone appears at the hydrogen-burning shell, which is seen as a narrow gap around in Figure 7. This zone, where g-modes are evanescent, can reflect some g-modes and prevent them from penetrating into the core. This effect reduces radiative damping in the core significantly, and hence helps the -mechanism in the envelope excite the mode.
Figure 8 shows the work , differential work , radial displacement amplitude, and kinetic energy distribution (top panel) of an excited g-mode. The pulsation is excited if the value of is positive at the surface. ( means that the zone drives pulsation.) We see that the amplitude and the kinetic energy suddenly becomes very small interior to the point at , where the fully convective zone is located. This indicates that the reflection at the convective shell actually occurs for this mode. Such a reflection at the convective shell is essential for a g-mode to be excited in a post-main-sequence star by the -mechanism at the Fe-bump of opacity. All post-main-sequence models which excite g-modes in Figure 4 have a fully-developed convection zone associated with the hydrogen-burning shell. On the other hand, in a stable range of for (Fig. 6), for example, no fully-developed convective zone is present at the hydrogen-burning shell (i.e. the whole convectively-unstable layers are semiconvective only).
Only a few selected g-modes are reflected at the convection zone and excited by the Fe-bump in an appropriate frequency range. Figure 9 compares the kinetic energy distribution of an excited g-mode (thick solid line) to that of a damped mode (thin solid line) as a function of the fractional radius (). (In this diagram the right hand side is the stellar surface.) The pulsation frequencies of the two modes are very close; 0.324 c d-1 and 0.326 c d-1. These eigenfunctions were calculated by the Riccati shooting method (Gautschy et al., 1996), completely resolving the spatial oscillations with roughly 16,500 integration steps. It is obvious that the kinetic energy in the core of the excited mode is significantly reduced and hence the radiative damping is quenched, while the kinetic energy of the damped mode is strongly confined to the central part.
Most of the g-modes in the frequency range where excited modes reside are confined to the radiative core and are damped due to strong radiative damping. Only those selected g-modes whose spatial oscillations have the right phase at the boundary of the chemically homogeneous shell convection zone are reflected and confined to the envelope. Therefore, which g-modes are excited depends on details of the structure around the convective shell. In the model shown in Figure 7 the layer in is semi-convective (i.e. convective zone with an inhomogeneous chemical composition). We have treated semi-convective mixing based on the model of Spruit (1992). Everyone admits that many uncertainties lie in the theory of convective mixing. Since the Brunt-Väisälä frequency depends sensitively on the distribution of chemical elements [Eq.(2)], frequency spacings of the excited g-modes depend on the treatment of convective mixing. This indicates that comparing observed frequencies with the predicted ones from models can constrain the theory of convective mixing. We also note that the lower luminosity boundary of the g-mode instability region, which is the boundary of the presence of a fully developed shell convection, depends on the efficiency of convective mixing. Thus, g-modes in SPBsgs have great potential for asteroseismology.
As discussed above, the presence of a convective shell is crucial to excite g-modes in the post-main-sequence models. The appearance of a convective shell in the post-main-sequence phase of massive stars has been known for more than 30 years (e.g. Barbaro, et al., 1972). It has also been known for a long time that g-modes can be reflected at the boundary of a convection zone, and that the reflection quenches a strong radiative dissipation in the core. Nevertheless, we can find no published evidence of stability analyses of g-modes in massive post-main-sequence stars since the emergence of OPAL opacities. The discovery of light variations in HD163899 by the MOST satellite, which prompted us to perform stability analyses for such modes, played a crucial role in our eventually finding the excited high-order g-modes. On the HR diagram, the region with unstable g-modes seems to extend to the region of Cyg variables suggesting that g-mode pulsations might play an important role in understanding these luminous variable stars. The spatio-temporal evolution of the H-shell convection zone in very massive stars during their post-main-sequence evolution can be judged from figures in e.g. Lamb et al. (1976) or Maeder (1981).
5 CONCLUSION
The MOST satellite discovered that the B type supergiant HD 163899 pulsates in g-modes as well as in p-modes, showing, for the first time, SPB-type g-mode pulsations in a less luminous B supergiant. We have performed pulsation stability analyses for evolutionary models in the mass ranges of , and found that g-modes are excited by the Fe-bump of opacity in post-main-sequence stars in a wide range of effective temperatures if the stellar mass is larger than . Our results indicate the existence of a previously unrecognized group of variable stars; slowly pulsating B supergiants (SPBsg) distinct from Cyg variables.
The excitation of g-modes in B supergiants becomes possible by a reflection of g-modes at the fully-developed convection zone associated with the hydrogen-burning shell. This reduces significantly the radiative damping in the radiative core of the star. Since the frequencies of excited g-modes depend on the structure around the convective shell, SPBsg have a great potential for asteroseismology.
HD 163899 is the first member of the SPBsg family. Strictly speaking, HD 163899, showing both g- and p-modes, is a hybrid of SPBsg and Cephei-type. The B supergiant CMa (B3 Ib/II) could be another SPBsg member. Balona & Engelbrecht (1985) obtained a 0.717 c d-1 periodicity for CMa. Since the light curve looks irregular, it is likely multi-periodic. Another possible candidate could be HD 98410 (B2/B3 Ib/II) which is listed in Stankov & Handler (2005) as one of the “poor and rejected Cephei candidates” with a Hipparcos-deduced period of 1.453 days. We also note that Waelkens et al. (1998)’s list for Cyg-type supergiants includes some less luminous B supergiants or bright giants such as HD54764 (B1Ib/II), HD141318 (B2II), and HD168183 (B1Ib/II). These stars could also be SPBsg candidates. Further observations of these stars are needed to confirm their membership. Also, for a detailed asteroseismological study of HD 163899, spectroscopic observations are important to properly identify the pulsation modes that are responsible for the photometrically observed frequencies.
References
- Abt et al. (2002) Abt, H.A., Levato, H., & Grosso, M. 2002, ApJ, 573, 359
- Aerts et al. (2006b) Aerts, C., De Cat, P., Kuschnig, R., Matthews, J. M., Guenther, D. B., Moffat, A. F. J., Rucinski, S. M., Sasselov, D., Walker, G. A. H., & Weiss, W. W. 2006b, ApJ, 642, L165
- Aerts et al. (2006a) Aerts, C., Marchenko, S. V., Matthews, J. M., Kuschnig, R. Guenther, D.B., Moffat, A. F. J., Rucinski, S. M., Sasselov, D., Walker, G. A. H., & Weiss, W. W. 2006a, ApJ, 642, 470
- Balona & Engelbrecht (1985) Balona, L.A., & Engelbrecht, C.A. 1985, MNRAS, 214, 559
- Barbaro, et al. (1972) Barbaro, G., Chiosi, C., & Nobili, L. 1972, A&A, 18, 186
- De Cat et al. (2004) De Cat, P., Daszyńska-Daszkiewicz, J., Briquet, M., Dupret, M.-A., Scuflaire, R., De Ridder, J., Niemczura, E., & Aerts, C. 2004, ASP. Conf. Ser., 310, 195 (eds. Kurtz, D.W., & Pollard, K.R.)
- Cox (1980) Cox, J.P. 1980, Theory of Stellar Pulsation, Princeton: Princeton University Press, Ch.17
- Dorfi & Gautschy (2000) Dorfi, E.A., & Gautschy, A. 2000, ApJ, 545, 982
- Dziembowski et al. (1993) Dziembowski, W.A., Moskalik, P., & Pamyatnykh, A.A. 1993, MNRAS, 265, 588
- Gautschy et al. (1996) Gautschy, A., Ludwig, H.-L., & Freytag, B. 1996, A&A, 311, 493
- Gautschy & Saio (1993) Gautschy, A. & Saio, H. 1993, MNRAS, 262, 213
- Glatzel & Mehren (1996) Glatzel, W. & Mehren, S. 1996, MNRAS, 282, 1470
- Iglesias & Rogers (1996) Iglesias, C.A., & Rogers, F.J. 1996, ApJ, 464, 943
- Kaufer et al. (2006) Kaufer, A., Stahl, O., Prinja, R.K., & Witherick, D. 2006, A&A, 447, 325
- Kaufer et al. (1996) Kaufer, A., Stahl, O., Wolf, B., Gäng, Th. Gummersbach, C.A., Kovács, J., Mandel, H., & Szeifert, Th. 1996, A&A, 305, 887
- Kaufer et al. (1997) Kaufer, A., Stahl, O., Wolf, B., Fullerton, A.W., Gäng, Th. Gummersbach, C.A., Jankovics, I., Kovács, J., Mandel, H., Peitz, J., Rivinius, Th., & Szeifert, Th. 1997, A&A, 320, 273
- Kiriakidis et al. (1992) Kiriakidis, M., El Eid, M.F., & Glatzel, W. 1992, MNRAS, 255, 1p
- Kiriakidis et al. (1993) Kiriakidis, M., Fricke, K.J., & Glatzel, W. 1993, MNRAS, 264, 50
- Kuschnig et al. (1997) Kuschnig, R., Weiss, W. W., Gruber, R., Bely, P. Y., & Jenkner, H. 1997, A&A, 328, 544
- Lamb et al. (1976) Lamb, S.A., Iben, I., & Howard, W.M. 1976, ApJ, 207, 209
- Maeder (1981) Maeder, A. 1981, A&A, 99, 97
- Matthews et al. (2004) Matthews, J.M., Kusching, R., Guenther, D.B., Walker, G.A.H., Moffat, A.F.J., Rucinski, S.M., Sasselov, D., Weiss, W.W. 2004, Nature, 430, 51
- Moskalik & Dziembowski (1992) Moskalik, P., & Dziembowski, W.A. 1992, A&A, 256, L5
- Pamyatnykh (1999) Pamyatnykh, A.A. 1999, Acta Astron., 49, 119
- Press et al. (1986) Press, W. H., Flannery, B. P., Teukolsky, S. A., & Vetterling, W. T. 1986, Numerical Recipes, Cambridge, Cambridge University Press, ch.14
- Rivinius et al. (2003) Rivinius, Th., Baade, D., & Štefl, S. 2003, A&A, 411, 229
- Rogers & Iglesias (1992) Rogers, F.J., & Iglesias, C.A. 1992, ApJS, 79, 507
- Saio & Cox (1980) Saio, H., & Cox, J.P. 1980, ApJ, 236, 549
- Spruit (1992) Spruit, H.C. 1992, A&A, 253, 131
- Stankov & Handler (2005) Stankov, A., & Handler, G. 2005, ApJS, 158, 193
- Unno et al (1989) Unno, W., Osaki, Y., Ando, H., Saio, H., & Shibahashi, H. 1989, Nonradial Oscillations of Stars, Tokyo: University of Tokyo Press, Ch.3
- van Genderen (1991) van Genderen, A.M. 1991,in ESO Workshop on Rapid Variability of OB-Stars: Nature and Diagnostic Value, ed. D. Baade, 117
- van Leeuwen et al. (1998) van Leeuwen, F, van Genderen, A.M., & Zegelaar, I. 1998, A&AS, 128, 117
- Waelkens (1991) Waelkens, C. 1991, A&A, 246, 453
- Waelkens et al. (1998) Waelkens, C., Aerts, C., Kestens, E., Grenon, M., & Eyer, L. 1998, A&A, 330, 215
- Walker et al. (2003) Walker, G. A. H., Matthews, J., Kuschnig, R., Johnson, R., Rucinski, S., Pazder, J., Burley, G., Walker, A., Skaret, K., Zee, R., Grocott, S., Carroll, K., Sinclair, P., Sturgeon, D., & Harron, J. 2003, PASP, 115, 1023
- Walker et al. (2005a) Walker, G. A. H., Kuschnig, R., Matthews, J. M., Reegan, P., Kallinger, T., Kambe, E., Saio, H., Harmanec, P., Guenther, D. B., Moffat, A. F. J., Rucinski, S. M., Sasselov, D., Weiss, W. W., Bohlender, D. A., Božić, H., Hashimoto, O., Koubskiý, Mann, R., Ruždjak, D., Škoda, P., Šlechta, M., Sudar, D, Wolf, M., & Yang, S. 2005a, ApJ, 623, L145
- Walker et al. (2005b) Walker, G. A. H., Kuschnig, R., Matthews, J. M., Cameron, C., Saio, H., Lee, U., Kambe, E., Masuda, S., Guenther, D. B., Moffat, A. F. J., Rucinski, S. M., Sasselov, D., & Weiss, W. W. 2005b, ApJ, 635, L77
- Wall & Jenkins (2003) Wall, J. V., & Jenkins, C. R. 2003, Practical Statistics for Astronomers, Cambridge, Cambridge University press, Ch.6
| Freq[c d-1] | Amp[mmag] | phase[rad]aa Phases are referenced to the first observation in the data set. | S/N | |
|---|---|---|---|---|
| f1 | 0.0431 0.0003 | 4.03 0.08 | 1.77 0.04 | 19.2 |
| f2 | 0.0726 0.0003 | 3.00 0.06 | 3.97 0.04 | 11.6 |
| f3 | 0.0211 0.0009 | 0.91 0.09 | 5.12 0.12 | 10.2 |
| f4 | 0.4711 0.0003 | 2.32 0.03 | 4.34 0.03 | 11.9 |
| f5 | 0.1911 0.0002 | 2.37 0.03 | 6.05 0.02 | 10.9 |
| f6 | 0.2246 0.0003 | 1.96 0.03 | 1.48 0.03 | 11.0 |
| f7 | 0.2840 0.0002 | 1.52 0.06 | 6.63 0.02 | 8.5 |
| f8 | 0.4009 0.0003 | 1.69 0.03 | 1.16 0.04 | 8.4 |
| f9 | 0.6931 0.0009 | 0.91 0.04 | 6.68 0.12 | 7.5 |
| f10 | 0.5894 0.0007 | 1.18 0.03 | 4.80 0.08 | 7.3 |
| f11 | 1.0789 0.0003 | 1.24 0.03 | 4.90 0.05 | 7.1 |
| f12 | 0.1550 0.0004 | 1.15 0.05 | 5.68 0.07 | 7.4 |
| f13 | 0.1035 0.0006 | 1.10 0.03 | 3.14 0.08 | 6.3 |
| f14 | 0.3283 0.0003 | 1.15 0.03 | 6.86 0.04 | 6.5 |
| f15 | 0.9683 0.0011 | 0.72 0.03 | 5.25 0.13 | 6.0 |
| f16 | 0.6552 0.0006 | 0.84 0.03 | 2.32 0.09 | 5.9 |
| f17 | 0.4279 0.0006 | 1.03 0.03 | 1.64 0.07 | 6.0 |
| f18 | 1.9790 0.0004 | 0.94 0.02 | 3.11 0.06 | 6.0 |
| f19 | 0.3626 0.0006 | 0.94 0.03 | 4.06 0.07 | 5.6 |
| f20 | 1.3835 0.0006 | 0.85 0.02 | 4.52 0.08 | 5.8 |
| f21 | 0.5010 0.0008 | 0.81 0.03 | 3.25 0.11 | 5.4 |
| f22 | 1.1936 0.0005 | 0.61 0.02 | 5.18 0.06 | 5.1 |
| f23 | 0.8182 0.0005 | 0.95 0.03 | 4.60 0.07 | 5.0 |
| f24 | 0.2562 0.0006 | 0.83 0.04 | 3.29 0.06 | 5.1 |
| f25 | 0.8798 0.0009 | 0.97 0.06 | 6.62 0.10 | 5.0 |
| f26 | 0.7077 0.0011 | 0.79 0.05 | 3.41 0.13 | 5.0 |
| f27 | 1.3391 0.0010 | 0.69 0.03 | 6.38 0.13 | 4.7 |
| f28 | 1.4606 0.0008 | 0.65 0.02 | 6.34 0.11 | 4.2 |
| f29 | 2.0495 0.0004 | 0.56 0.02 | 5.80 0.07 | 4.5 |
| f30 | 0.8625 0.0011 | 0.73 0.06 | 4.86 0.14 | 4.5 |
| f31 | 2.2975 0.0010 | 0.46 0.02 | 2.29 0.12 | 4.1 |
| f32 | 0.9439 0.0011 | 0.54 0.03 | 6.74 0.14 | 4.7 |
| f33 | 0.7648 0.0009 | 0.59 0.03 | 5.37 0.11 | 4.4 |
| f34 | 1.6542 0.0016 | 0.44 0.03 | 3.20 0.15 | 3.9 |
| f35 | 1.1444 0.0007 | 0.50 0.02 | 6.39 0.08 | 4.1 |
| f36 | 1.9131 0.0010 | 0.46 0.02 | 2.28 0.15 | 4.0 |
| f37 | 0.5628 0.0016 | 0.41 0.04 | 4.53 0.19 | 3.9 |
| f38 | 2.5915 0.0009 | 0.44 0.02 | 6.93 0.13 | 4.0 |
| f39 | 1.5739 0.0008 | 0.53 0.03 | 6.96 0.10 | 4.0 |
| f40 | 0.1381 0.0008 | 0.74 0.04 | 3.63 0.11 | 4.0 |
| f41 | 0.3047 0.0004 | 0.58 0.06 | 5.46 0.05 | 3.9 |
| f42 | 1.3032 0.0011 | 0.42 0.03 | 3.69 0.08 | 4.1 |
| f43 | 2.3823 0.0007 | 0.44 0.02 | 5.93 0.11 | 4.0 |
| f44 | 2.8416 0.0010 | 0.39 0.02 | 6.54 0.18 | 4.1 |
| f45 | 1.7444 0.0014 | 0.39 0.02 | 3.31 0.12 | 3.9 |
| f46 | 1.5269 0.0014 | 0.39 0.03 | 5.52 0.19 | 3.7 |
| f47 | 1.6172 0.0014 | 0.46 0.03 | 7.17 0.18 | 3.6 |
| f48 | 1.0069 0.0018 | 0.33 0.03 | 4.23 0.23 | 3.6 |