PHOTOMETRY OF GLOBULAR CLUSTERS NGC 6293 AND NGC 6541: THE FORMATION OF THE METAL-POOR INNER HALO GLOBULAR CLUSTERS111Based on Observations made with the NASA/ESA Hubble Space Telescope, obtained at the Space Telescope Science Institute, which is operated by AURA, Inc., under NASA contract NAS 5-26555.
Abstract
We present photometry of the metal-poor inner halo globular clusters NGC 6293 and NGC 6541 using the planetary camera of the WFPC2 on board Hubble Space Telescope (HST). Our color-magnitude diagrams of the clusters show well-defined blue horizontal branch (BHB) populations, consistent with their low metallicities and old ages. NGC 6293 appears to have blue straggler stars in the cluster’s central region. We discuss the interstellar reddening and the distance modulus of NGC 6293 and NGC 6541 and obtain = 0.40 and = 14.61 for NGC 6293 and = 0.14 and = 14.19 for NGC 6541. Our results confirm that NGC 6293 and NGC 6541 are clearly located in the Galaxy’s central regions ( 3 kpc). We also discuss the differential reddening across NGC 6293. The interstellar reddening value of NGC 6293 appears to vary by 0.02 – 0.04 mag within our small field of view.
The most notable result of our study is that the inner halo clusters NGC 6293 and NGC 6541 essentially have the same ages as M92, confirming the previous result from the HST NIC3 observations of NGC 6287.
1 INTRODUCTION
Understanding the formation of our Galaxy has always been one of the key quests in modern astrophysics for decades. During the last decade, a tremendous amount of observational data have accumulated regarding the formation of our Galaxy, in particular due to the advent of HST. However, questions associated with the formation and early evolution of our Galaxy remain unanswered.
One of the earliest models for the formation of the Galaxy was that of Eggen, Lynden-Bell, & Sandage (1962), who postulated a rapid, monolithic “collapse” of a proto-Galaxy. Using similar data, Isobe (1974) and Saio & Yoshii (1979) suggested the formation process could have been much longer than a free-fall timescale, occurring over several billion years. An alternate view of the halo formation process was presented by Searle & Zinn (1979). Under the assumption that variations in the numbers of blue and red horizontal branch stars in globular clusters is an age indicator, they argued for somewhat more youthful clusters at larger Galactocentric distances. If true, they argued that the Galactic halo may have formed from accretion of “proto-Galactic fragments”, implying a more chaotic view of the halo’s formation. Carrying the argument further, Zinn (1993) argued that the bulk of the old halo globular clusters formed during a monolithic dissipative collapse while the young halo globular clusters formed independently of the Galaxy and later accreted into our Galaxy. The longer timescale of a monolithic formation process and the fragmentary accretion model both suggest a variation in the ages of globular clusters, and a natural assumption is that the Galactic halo may have formed “inside-out”, with star formation beginning earlier in center due to the smaller free collapse time scale ().
The discoveries that the Universe’s expansion and self-gravity are dominated by dark energy and dark matter have led to the basic “CDM” model, and the formation of galaxies within this model is a much more elaborate yet tractable variant of the original Searle & Zinn (1978) hypothesis, and that of White & Rees (1978). Numerous sub-galactic mass concentrations form rapidly in the early Universe, and undergo mergers to form the larger galaxies we see today (see Navarro, Frenk, & White 1997). Mergers are still going on in the current epoch, in our own Milky Way Galaxy, and in many others as well. Qualitatively, this “hierarchical assembly” model implies an “inside-out” formation of our Galaxy, and detailed calculations show this to be the case for the dark matter (Helmi et al. 2003) and the stars as well (Robertson et al. 2005; Font et al. 2006).
What do we know about how when star formation began and how rapidly it proceeded in these fragments and the young Galaxy? Two techniques are available to answer these questions. Element-to-iron (or other elemental) ratios provide valuable clues due to different elements’ different nucleosynthesis sites. For example, light elements such as magnesium, calcium, and silicon are manufactured more readily in short-lived stars that explode as Type II supernovae, whereas iron is more readily synthesized in Type Ia supernovae, which are thought to arise from mass transfer or mergers of white dwarfs, a process which is thought to require a longer period of time, perhaps years or more. Thus in a closed system of stars and gas, stars with high [/Fe] abundance ratios were likely born prior to significant contributions from Type Ia supernovae. The discovery that the Galaxy’s dwarf spheroidal galaxy neighbors have unusually low [/Fe] ratios, even at very low [Fe/H] values (Shetrone et al. 2001, 2003; Venn et al. 2004) thereby presented a challenge to the idea that the Galaxy’s halo was assembled from proto-Galactic fragments, since, apparently, some of the surviving fragments have not shared the same chemical enrichment history as the Galactic halo. The difficulty with relying on element-to-iron ratios is that they do not monitor ages directly. Small galaxies producing stars very slowly will experience enrichment from Type Ia supernovae before the overall [Fe/H] value has risen significantly. Further, incorporation of supernovae ejecta in subsequent generations of stars depends on the host galaxy’s ability to retain gas. Font et al. (2006) have shown that the CDM model is able to explain the differences in [/Fe] vs. [Fe/H] patterns in the local dwarf spheroidal galaxies vs. the Galactic halo due to the different rates of star formation in the systems that were absorbed by the Galaxy compared to the survivors.
The second method of age dating is the most direct: comparisons of main sequence turn-offs with stellar model isochrones. While the derived ages do not depend on the history of nucleosynthesis, the method is difficult to apply with the same level of precision. For example, if the timescale for significant contributions of Type Ia supernovae to manifest their presence in subsequent generations of stars, a change in [/Fe] can be expected to be revealed in stars whose ages differ by less than years in a closed system111It is even more problematical in ensembles constructed from merger fragments, each that may have experienced a different star formation history.. Measurement of even relative ages with such precision using main sequence data is very challenging. Nonetheless, much careful work has already been done in this area.
We are interested in the particular question of how rapidly did star formation begin throughout the Galaxy and its then more numerous proto-Galactic fragment. The HST observations of one of the most remote metal-poor halo clusters NGC 2419 ( 90 kpc) of Harris et al. (1997) have shown that NGC 2419 and M92 ( = 9.6 kpc) essentially have the same age within 2 Gyr, suggesting that globular-cluster formation must have started at everywhere at about the same time in our Galaxy (Richer et al. 1996; see also the counterargument of Chaboyer, Demarque, & Sarajedini 1996). Moreover, the local dwarf galaxies Carina (Mighell 1997), Draco (Grillmair et al. 1998), Leo I & II (Held et al. 2000; Mighell & Rich 1996), and Ursa Minor (Mighell & Burke 1999) and the globular clusters in the Fornax dwarf galaxy (Buonanno et al. 1998), LMC (Johnson et al. 1999), and the Sagittarius dwarf galaxy (Montegriffo et al. 1998; Layden & Sarajedini 2000) appear to be coeval with typical globular clusters of similar metallicity in our Galaxy. These similar ages suggest that globular cluster formation may have begun everywhere at the same time not only in our Galaxy but also in the local dwarf galaxies, despite the differences in the initial physical environments.
The “inside-out” model led van den Bergh (1993) to suggest that the most metal-poor globular cluster near the Galactic center NGC 6287 ([Fe/H] = 2.01, Lee & Carney 2002; = 1.6 kpc, Lee et al. 2001) may be the oldest globular cluster in our Galaxy, based on its metallicity, horizontal branch (HB) population, and its spatial location in our Galaxy. The recent HST NIC3 observations of the cluster (Lee et al. 2001) have shown that NGC 6287 and M92 essentially have the same age within 2 Gyr, suggesting that the metal-poor globular cluster formation must have been triggered roughly everywhere at the same time in our Galaxy. It should be noted that, however, HST NIC3 photometry can be vulnerable to the variation in the intrapixel sensitivity (Lauer 1999) and the temperature dependence of the interstellar reddening law in the HST NICMOS F110W/F160W photometric system (Lee et al. 2001). Therefore, a photometric study with an expanded sample, preferably employing detector plus filter systems not suffering such effects as can be seen in HST NIC3, is necessary to rank the formation epoch of metal-poor inner halo globular clusters in comparison to the intermediate or the outer halo globular clusters.
NGC 6293 ( = 17:10:10.42; = :34:54.2; = 357.62; = +7.83) and NGC 6541 ( = 18:08:02.20; = :42:19.7; = 349.29; = ) are the second and the third most metal-poor globular clusters within 3 kpc from the Galactic center. NGC 6293 and NGC 6541 are located 1.4 kpc and 2.2 kpc from the Galactic center and 1.2 kpc and 1.4 kpc from the Galactic plane, suffering interstellar reddening of = 0.41 and 0.14, respectively (Harris 1996). In Table 1, we list clusters’ properties. Since both clusters are thought to be post core-collapsed, as can be more frequently found in the inner halo region than other parts of our Galaxy (Barbuy, Bica, & Ortolani 1998), ground-based photometric study of these two clusters has been limited.
Janes & Heasley (1991) presented photometry of NGC 6293. Their color-magnitude diagram (CMD) showed that the red-giant branch (RGB) and the BHB morphologies of NGC 6293 are similar to those of M92, indicating that the cluster is both old and metal-poor. By comparing with M92, they suggested that = 0.46 and 16.0. Since their observations reached just to the main-sequence turnoff (MSTO), however, they were not able to address the age of the cluster. They also made an interesting point that the RGB-tip magnitude of NGC 6293 appears to be a full magnitude fainter than that of M92. They suggested that this may reflect that the cluster has undergone core collapse. Trager et al. (1995) found that the cluster has indeed undergone core collapse, as may NGC 6541. More recent work by Noyola & Gebhardt (2006), relying on HST WFPC2 data, confirms that both clusters show sharply rising surface brightness levels into the innermost regions.
Alcaino (1971, 1979) obtained photographic photometry and Alcaino et al. (1997) presented multi-color CCD photometry of NGC 6541. Alcaino (1979) noted that NGC 6541 has BHB stars and its CMD appears to be similar to that of M13. He also noted that NGC 6541 appears to be deficient in bright RGB stars. With deeper CCD photometry, Alcaino et al. (1997) claimed that the CMD of NGC 6541 is similar to those of M13 and M79, finding = 0.15 and [Fe/H] 1.8 for NGC 6541. They noted a discrepancy in the position of NGC 6541 BHB stars in and diagrams, in the sense that magnitude of BHB stars in NGC 6541 appear to be 0.3 – 0.4 mag brighter than those in M79. Using an isochrone fitting method, they claimed that NGC 6541 is very old, one of the oldest clusters they had studied.
Lee & Carney (2002) presented high-resolution echelle spectroscopy of both clusters. They noted that both clusters appear to be silicon enhanced and titanium depleted compared to the intermediate halo clusters. In particular, they suggested that [Si/Ti] ratios appear to be related to Galactocentric distances, in the sense that [Si/Ti] ratios decrease with Galactocentric distance, and they proposed that these [Si/Ti] gradients with Galactocentric distance may be due to the different masses of the SNe II progenitors. The high [Si/Ti] ratios toward the Galactic center may be due to higher-mass SNe II contributions. This is an additional hint that both clusters may have formed particularly early. Lee & Carney (2002) also derived the radial velocity of the clusters (see also Table 1). Their results suggest that the radial velocities of NGC 6293 and NGC 6541 are small enough that they are most likely genuine inner halo clusters unless their tangential motions are extremely large. Unfortunately, neither cluster has a measured proper motion as yet.
In this paper, we explore the relative ages of inner halo clusters NGC 6293 and NGC 6541 using HST PC2 photometry. As mentioned earlier, both clusters have high central concentrations so that only HST can provide the necessary high angular resolution to study main-sequence photometry of these clusters. In section 2, data acquisition and data reduction are discussed. We present the CMDs of the clusters and discuss the main sequence fittings of the clusters to M92 and NGC 2419 in section 3. The interstellar reddening and the distance modulus are also discussed in this section. Finally, we discuss the formation epoch of the metal-poor inner halo clusters in section 4.
2 OBSERVATIONS AND DATA REDUCTION
The observations of NGC 6293 and NGC 6541 were carried out on 23 March 1995 (UT) and 15 October 1994 (UT), respectively. HST PC2 is equipped with a 800 800 pixel Loral CCD. The FOV is 36 36 arcsec, and which gives 0.0455 arcsec/pixel (f/28.3). For both clusters images at two different locations with a small overlap region were obtained. For NGC 6293, the locations of the pointings were = 17:10:12.55, = :33:58.66 (J2000; NGC 6293-F1) and = 17:10:11.06, = :35:18.66 (NGC 6293-F2). The integration times were 40 sec and 500 sec for the F555W passband and 60 sec and 700 sec for the F814W passband. For NGC 6541, the locations of the pointings were = 18:08:06.30, = :41:51.21 (NGC 6541-F1) and = 18:08:04.46, = :42:11.21 (NGC 6541-F2). The integration times were 12 sec and 140 sec for the F555W passband and 20 sec and 260 sec for the F814W passband. No problems were reported during the observations. Table 2 lists the journal of observations.
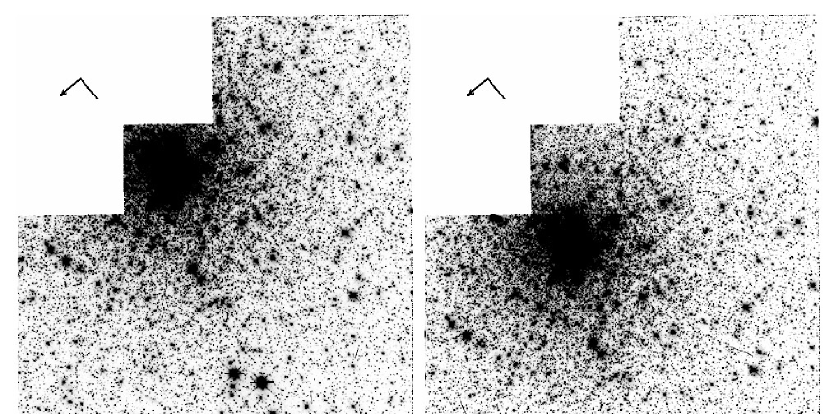
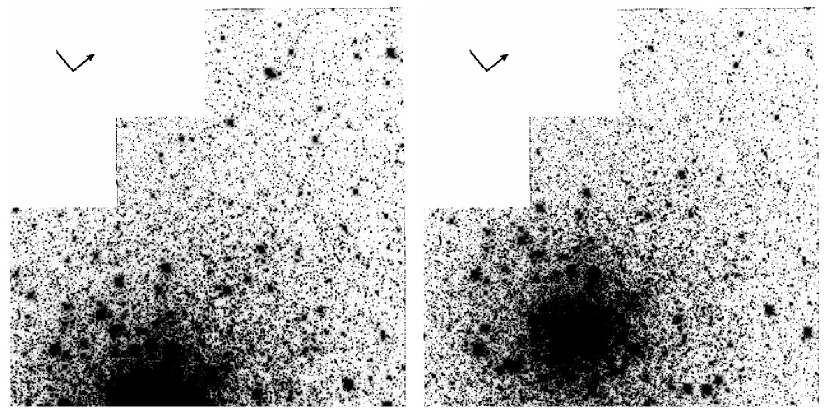
The raw images were calibrated using the HST standard calibration pipeline to perform bias subtraction, dark current subtraction, flat field correction, and shutter shade correction (WFPC2 Group 1998). The final processed F555W images for NGC 6293 and NGC 6541 are presented in Figure 1 and Figure 2, respectively. With the calibrated images, we masked the vignetted portions of the PC chip, which are not usable for further analysis.
To perform point-spread function (PSF) photometry for all calibrated images, we used DAOPHOTII, ALLSTAR and ALLFRAME (Stetson 1994, 1995; Turner 1995) following the procedure described in Lee & Carney (1999a) and Lee et al. (2001). With the PSF magnitudes returned from the final ALLFRAME run, we performed the aperture corrections. Holtzman et al. (1995a) adopted aperture magnitudes with a 0.5 arcsec ( 11 pixel in HST PC) aperture size and the sky annuli of 4 arcsec ( 88 pixel) to 6 arcsec ( 132 pixel) in deriving their transformation relations between the HST F555W/F814W photometric system and the standard Johnson-Cousins photometric system. Johnson et al. (1999) claimed that, however, the sky annuli that Holtzman et al. (1995a) used are too large for crowded field photometry and they adopted sky annuli of 2.0 arcsec ( 44 pixel) and 2.5 arcsec ( 55 pixel). They suggested that this reduces the effects of badly subtracted neighbors in crowded regions and uneven sky brightness across the clusters. They noted that the magnitude difference between using the larger and the smaller sky annuli is only 0.001 mag and it appears to be much smaller than the errors induced by other effects. We compare the aperture magnitude differences using the two different sizes of the sky annuli in NGC 6541-F1, which is the least crowded among our fields, and we obtain 0.002 0.015 mag. The difference appears to be negligible and therefore we adopt a 0.5 arcsec aperture size and the sky annuli of 2.0 arcsec and 2.5 arcsec during our aperture corrections.
The HST WFPC2 cameras introduce a geometric distortion as a result of their optical design (Holtzman et al. 1995b). The geometric distortion causes the effective pixel area to vary across the CCD chip and affects astrometry and the point source photometry. The pixel area effect is corrected during the flat field correction and consequently, after flattening, all pixels are normalized to the same area. Photometrically, this preserves surface brightness but causes a change in the pixel scale with the biggest effect at the edges of the chip (see, for example, Figure 15 of Holtzman et al. 1995b). Thus, the geometric distortion does not affect surface photometry, but does alter point source photometry. We corrected the geometric distortion effect in our images using the prescription of WFPC2 group (1998).
The HST WFPC2 CCDs also have a significant charge transfer efficiency (CTE) problem which causes some signal to be lost when charge is transferred down the chip during readout. This has the effect of making objects at higher row numbers appear fainter than they would if they were at low row numbers because more of the charge gets trapped for the objects near the top of the chip. The effect also depends on the temperature of the chip, the brightness of the sources, in the sense that the CTE effect is larger for the faint sources, and the amount of background charge on the chip, such that there is significantly less CTE effect due to the enhanced pedestal charge level of the chip when the background is bright. Hence the CTE effect on the PC2 chip is expected to be larger than those on the WF2 chips due to the lower background. We corrected the CTE problem in our images using the prescription of Whitmore & Heyer (1997).
Finally, the transformation to the standard Johnson-Cousins photometric system was performed using the relations given by Holtzman et al. (1995a). Following Holtaman et al. (1995a), the calculations were performed iteratively and magnitudes and colors converged to 0.001 mag within 3 iterations.
In Figure 3, we show the differences in magnitudes and colors as functions of magnitudes of the stars in the overlap regions in NGC 6293 and NGC 6541. The residuals are in the sense of the field F1 minus the field F2 in each cluster. For our calculations, we used stars with 23.0 mag for NGC 6293 and 22.5 mag for NGC 6541 and we excluded the stars detected within 10 pixels from the edges of the chip. As shown in the Figure, the magnitudes and colors are in good agreement between the two fields in each cluster with = 0.003 0.006 mag and = 0.001 0.003 mag for NGC 6293 (431 stars) and = 0.002 0.005 mag and = 0.007 0.004 mag for NGC 6541 (122 stars), suggesting that the zero-point adjustments are not necessary in combining photometry of the two fields. (The errors are those of the mean.) Therefore, zero-point offsets were not applied in our results.
3 RESULTS AND DISCUSSIONS
3.1 Color-Magnitude Diagrams
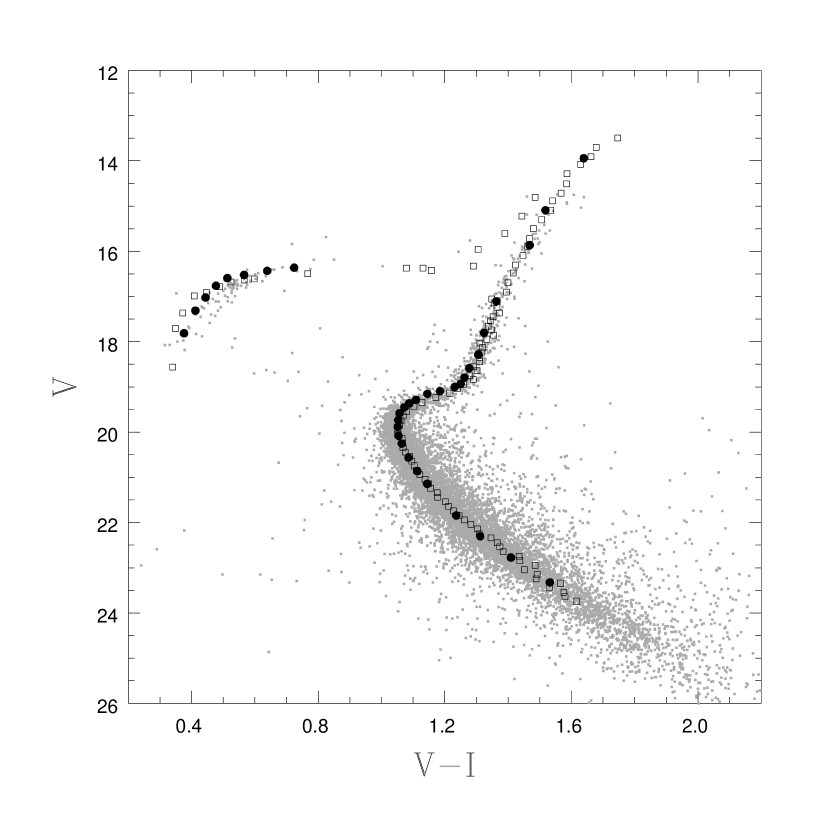
In Figure 4, we present CMDs of NGC 6293 for the stars in the fields F1 (6761 stars), F2 (3150 stars), and the overlap region (844 stars). Our CMDs for NGC 6293 show a well-developed BHB morphology, in particular in the central part of the cluster (the field F1), confirming the previous result of the ground-based photometry of Janes & Heasley (1991). As discussed by Lee & Carney (2002), NGC 6293 has a low metallicity ([Fe/H] = 1.99) and its BHB morphology is consistent with its metal-poor nature. Since the RGB stars brighter than 14.5 mag were saturated even in the short exposure frames during the observations, we are not able to test the Janes & Heasley (1991) observation that the RGB tip is a full magnitude fainter than that of M92.
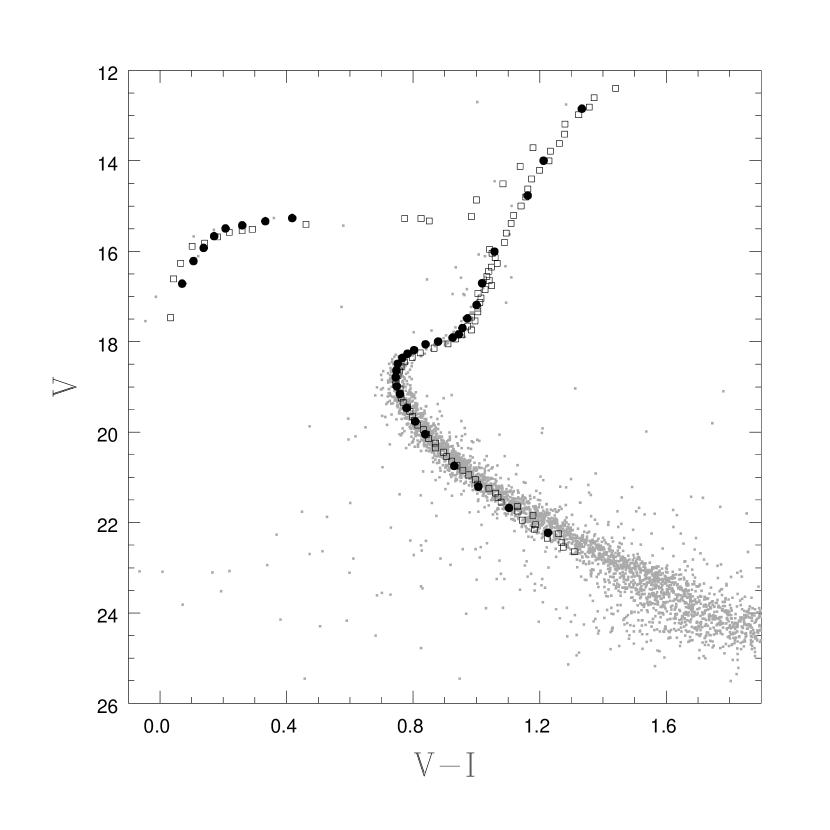
Figure 5 shows CMDs of NGC 6541 for the stars in the fields F1 (1086 stars), F2 (2162 stars), and the overlap region (235 stars). Our CMDs show the BHB population in NGC 6541, confirming the previous result of Alcaino (1979). Our CMDs may support the idea (Alcaino 1979) that NGC 6541 is deficient in luminous RGB stars. Since the FOV of the HST PC is small and the two fields are located 78 arcsec and 53 arcsec from the cluster center, however, the lack of RGB stars in NGC 6541 may not be conclusive.
Our CMD data for NGC 6293 and NGC 6541 are available upon request to the authors or the electronic version of the journal. Sample CMD data for NGC 6293 are shown in Table 3. Note that the first column of Table represents the field identification (“1” for the field F1 only, “2” for the field F2 only, and “o” for the overlap region) and the positions (columns 3 and 4) are presented in the pixel coordinate unit of the detector (0.0455 arcsec pixel-1).
3.2 Blue Stragglers
Blue straggler stars (BSS) are located in the region between the MSTO and the BHB. We found 22 BSS candidates in NGC 6293 (19 BSS candidates in the field F1 only, 1 in the field F2 only, and 2 in the overlap region). Since the observations did not cover off-cluster fields, we are not able to correct for field star contamination in our CMDs. However, the BSS candidates in NGC 6293 appear to be more centrally concentrated (i.e. the frequency of the BSS candidates is higher in the field F1 than in the field F2) and, therefore, they seem more likely related to the cluster rather than the off-cluster field populations. Are the numbers of blue stragglers enhanced by the dynamical state of a cluster? While this is plausible, in that binary star orbits should harden by interactions in dense environments, evidence to support the conjecture is hard to find. Ferraro et al. (1995), Davies et al. (2004), Piotto et al. (2004), and Sandquist (2005) do not support the idea. We have followed the approach of Piotto et al. (2004), and compared the numbers of blue stragglers (22) to horizontal branch stars (74). Therefore, = 0.297, and log = . NGC 6293 does not seem out of place in Figure 1 of Piotto et al. (2004), where log is compared to () and the logarithm of the central density (log = 5.22).
3.3 Main-Sequence Fitting And The Relative Age Estimates
We obtain the mean loci of the clusters by using a combination of subjective removal of outliers followed by use of iterative sigma-clipping mean color calculations. The mean loci of the clusters are presented in Tables 4 and 5 for NGC 6293 and NGC 6541, respectively. Note that the fifth and the tenth columns of the Tables represent the number of stars used in our calculations, not the clusters’ luminosity functions. The magnitudes and colors of the MSTO are 20.01 mag and 1.05 mag for NGC 6293 and 18.81 mag and 0.75 mag for NGC 6541. Our MSTO magnitude and color of NGC 6541 agree well with those of Alcaino et al. (1997), who obtained = 18.9 0.1 mag and = 0.750 mag for the NGC 6541 MSTO.
We explore the relative ages of NGC 6293 and NGC 6541 with respect to M92 using, in essence, color differences between the base of the RGB (BRGB) and the MSTO. VandenBerg, Bolte, & Stetson (1990) described a method to derive accurate relative cluster ages with similar chemical compositions. They recommended shifting the clusters’ CMDs in color until the TO colors agreed, then shifting the magnitudes until the upper main-sequence is matched at a point 0.05 mag redder than the TO. The color differences of the resulting BRGB could then be used to estimate the relative age of the clusters, since the color difference between the TO and the BRGB is a monotonic and inverse function of age. Further, this color difference is independent of differences in cluster distances and reddenings, as well as differences in photometric zero-points. This method is known to be nearly insensitive to metallicity within moderately large ranges in metallicity (see below). However, it should be emphasized that this method is vulnerable to the oxygen abundance. Since oxygen has a higher ionization potential than the other abundant heavy elements (magnesium, silicon, calcium, iron), the difference in the oxygen abundance affects the color and the luminosity of TO stars but not those of RGB stars, in the sense that higher oxygen abundance makes a redder and less luminous TO. Oxygen also plays a vital role in the hotter part of CNO bi-cycle, so the TO luminosity is also affected (VandenBerg 1992). VandenBerg & Stetson (1991) studied the effect of the oxygen abundance on the relative age estimations using this method (see also VandenBerg & Bell 2001). Their results suggested that changes in the oxygen abundance could mimic age differences, in the sense that the higher oxygen abundance imitates an older age at a given metallicity. However, VandenBerg & Stetson (1991) also pointed out that this effect is less important at the lowest metallicities and at the oldest ages.
Lee & Carney (2002) discussed the elemental abundance analyses of two RGB stars in NGC 6293 and NGC 6541. The metallicities of NGC 6293 and NGC 6541 are [Fe/H] = 1.99 and 1.76 from the ionized iron lines and they appear to be 0.2 and 0.45 more metal-rich than M92. The mean -element abundances for NGC 6293 and NGC 6541 are [/Fe] = +0.32 and +0.36, slightly lower than that of M92, [/Fe] = +0.41. Using the relation given by Chieffi et al. (1991), we obtained the overall metallicity = 0.0003 for NGC 6293 and 0.0006 for NGC 6541, respectively, and they are larger than that of M92 ( =0.0002). Therefore, a slight metallicity effect in the relative age estimate would be expected, in particular for NGC 6541 (see below). The original stellar oxygen abundances are hard to determine for highly-evolved RGB stars since oxygen appears to be depleted due to internal mixing. We obtained [O/Fe] = 0.14 from one RGB star in NGC 6293 and 0.58 and 0.09 from two RGB stars in NGC 6541. (We are not able to determine the oxygen abundance from one RGB star in NGC 6293, because its oxygen lines are too weak to be measured reliably.) A low sodium abundance ([Na/Fe] 0) appears to be a good indicator of minimal mixing in globular cluster RGB stars (Langer, Hoffman, & Sneden 1993; Kraft 1994). The sodium abundances of the RGB stars in NGC 6293 and NGC 6541 are [Na/Fe] +0.3, suggesting that they have experienced some mixing. The oxygen abundances of the clusters should be determined using an expanded sample at fainter magnitudes in the future. For the present, we assume that the initial [O/Fe] ratios for NGC 6293, NGC 6541, and M92 are very similar ([O/Fe] [/Fe]) and, therefore, the TO luminosities of the clusters are not affected by the difference in the oxygen abundance.
Figure 6 plots versus of enhanced -element ([/Fe] = +0.3) model isochrones (Bergbusch & VandenBerg 2001) with different metallicities at the age of 14 Gyr to illustrate the metallicity dependence of the color difference between the BRGB and the MSTO. In the Figure, is the color of the MSTO and is the magnitude of the upper MS at a point 0.05 mag redder than the MSTO. By comparing the color difference at = 2.5 mag, we obtain /[Fe/H] = 0.040 mag dex-1, which is larger than found in the color difference between the BRGB and the MSTO at = 2.5 mag using the same model isochrones, /[Fe/H] = 0.013 mag dex-1 (see the inset of the Figure). Therefore, the relative age estimate using the color difference between the BRGB and the MSTO is more vulnerable to metallicity in than in . [Note that this method was initially introduced using color differences.]
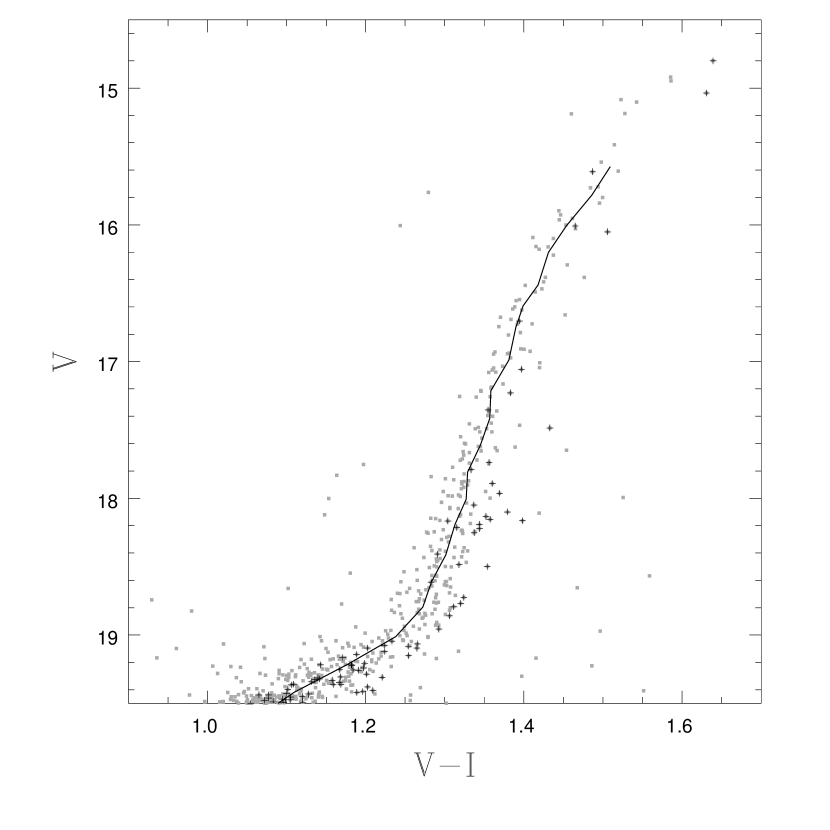
Figure 7 shows a plot of versus for MS/RGB fiducial sequences of NGC 6293 and M92. Since HST WFPC2 photometry for M92 using the F555W/F814W passbands does not exist, we adopted the ground-based M92 photometry of Johnson & Bolte (1997). In the Figure, we used the enhanced -element model isochrones of Bergbusch & VandenBerg (2001) for [Fe/H] = 2.01 and [/Fe] = +0.30 from 10 Gyr to 18 Gyr. As discussed above, NGC 6293 is 0.2 dex more metal-rich than M92, which results in 0.008 mag in the sense that the color difference between the BRGB and the MSTO in NGC 6293 is expected to be 0.008 mag smaller than that in M92 if these two clusters have the same ages. As shown in the Figure, we also obtain / = 0.015 mag Gyr-1 using the model isochrones with [Fe/H] = 2.01. A comparison of the fiducial sequences between NGC 6293 and M92 shows excellent agreement from the lower main-sequence to the RGB within our measurement error and the clusters’ fiducial sequences appear to be almost identical. Therefore, our result shows that the relative age difference between the two clusters is less than 0.5 – 1 Gyr. It should be noted that at the highest luminosities, the RGB slopes of the model isochrones brighter than 4.0 mag do not agree with the fiducial sequences of NGC 6293 and M92.
In Figure 8, we show a plot of versus for fiducial sequences of NGC 6541 and M92. The metallicity effect appears to be visible. The locations of the lower MS of the two clusters are slightly different, most likely due to the difference in metallicity (see the difference in the lower main-sequence between the models with [Fe/H] = 2.31 and 1.71 in Figure 6). In the Figure, the color difference between the BRGB and the MSTO at 2.5 mag in NGC 6541 appears to be 0.005 – 0.010 mag smaller than that in M92, indicating that the difference in the relative age between NGC 6541 and M92 is very small, 0.5 – 1 Gyr. However, recall that our fiducial sequence of the BRGB in NGC 6541 relies on a small number of stars (n 10) as shown in Table 5 and, therefore, the uncertainty is large. In Figure 9 is a plot of versus for the fiducial sequences of NGC 6293 and NGC 6541. Again, our results suggest that NGC 6293 and NGC 6541 essentially have the same ages within 0.5 – 1 Gyr.
3.4 Interstellar Reddening and Distance Modulus
We explore the interstellar reddenings and distance moduli of the clusters following the similar scheme described in Lee et al. (2001). We assume that the clusters’ MS/RGB fiducial sequences are identical and we compare the magnitude and the color of the clusters.
In Figure 10, we adopt = 1.193 mag and = 0.496 mag for M92 and = 4.008 mag and = 0.374 mag for NGC 2419 to match clusters’ [, ] points, in the sense of NGC 6293 minus M92 or NGC 2419. In Figure 11, we adopt = 0.096 mag and = 0.190 mag for M92 and = 5.105 mag and = 0.068 mag for NGC 2419, in the sense of NGC 6541 minus M92 or NGC 2419. From these values, we derive the interstellar reddening and the distance modulus of NGC 6293 and NGC 6541 with respect to those of M92 or NGC 2419, assuming = 0.02 and = 14.60 for M92 (see Lee et al. 2001) and = 0.11 and = 19.54 for NGC 2419 (Harris et al. 1997).
Table 6 lists our interstellar reddening and distance modulus estimates of the clusters. For NGC 6293, we obtain = 0.40 and = 14.61 with respect to those of M92, and = 0.40 and = 14.64 with respect to those of NGC 2419. Our reddening estimates for NGC 6293 agree well with that of Harris (1996), while our distance modulus estimates are 0.1 mag smaller than that of Harris (see below). For NGC 6541, we obtain = 0.17 and = 14.24 with respect to those of M92, and = 0.16 and = 14.27 with respect to those of NGC 2419. Our reddening estimates for NGC 6541 are 0.03 mag larger than that of Harris (1996), while the distance modulus estimates are in good agreement. The 0.03 mag difference in is likely due to the difference in metallicity of the clusters. As shown in Figures 8 and 11, the lower MS fiducial sequences of M92 and NGC 2419 show a slight disagreement with the NGC 6541 lower MS stars most likely due to the difference in metallicity, suggesting that a correction for the different metallicity is necessary. By comparing and of the enhanced -element model isochrones for [Fe/H] = 2.31, 2.14, 2.01, and 1.84, we derived the change rates in and with metallicity [Fe/H] = 0.075 mag dex-1 and [Fe/H] = 0.303 mag dex-1 at 15 Gyr. Assuming the metallicity difference between NGC 6293 and M92 is [Fe/H] 0.45 dex, the correction values become = 0.034 mag and = 0.136 mag, in the sense that a higher metallicity causes a redder TO color and a fainter magnitude at a given age. Applying these correction values, we obtain = 0.14 and = 14.19 for NGC 6541 with respect to M92, and = 0.14 and = 14.22 with respect to NGC 2419. Our results compare remarkably well with the earlier summaries provided by Harris (1996).
Since the interstellar reddening and the distance modulus of M92 are probably more accurate than those of NGC 2419, due to M92 being much closer to the Sun and at a higher Galactic latitude, we adopt M92 as our reference cluster. Therefore, our final estimates of the interstellar reddening and the distance modulus for NGC 6293 are = 0.40 mag and = 14.61 mag and those for NGC 6541 are = 0.17 mag and = 14.24 mag without a metallicity effect correction and = 0.14 mag and = 14.19 mag with such a correction. Schlegel, Finkbeiner, & Davis (1998) have provided tools to estimate reddening total reddening along essentially any line of sight, which should reflect the total reddening to our two clusters. The results are E() = 0.60 mag for NGC 6293 and E() = 0.16 mag for NGC 6541. While the latter agrees well with our derived value, their estimate for NGC 6293 exceeds ours by 50%. Dutra & Bica (2000) noted that interstellar reddening estimates by Schlegel et al. (1998) for clusters near the Galactic plane appear to be larger than those based on stellar contents, possibly due to background dust. Arce & Goodman (1999) have cautioned their readers that Schlegel et al. (1998) may over-estimate reddening by a factor of 1.3 to 1.5 in regions with E() or so. Our results appear to confirm these cautionary remarks about the use of the Schlegel et al. (1998) reddening maps in regions of high reddening.
We also explore the of the clusters. Figure 12 shows the CMDs of the HB region of NGC 6293 and NGC 6541. Since both clusters have blue tails, we select HB stars redder than the “knee” of the BHB by eye [ 0.1 mag], which are those with 0.65 mag for NGC 6293 and 0.30 mag for NGC 6541. We then calculate the mean magnitude of these HB stars and obtain = 16.34 0.04 mag (8 stars) for NGC 6293 and = 15.35 0.09 mag (2 stars) for NGC 6541. In the Figure, we show the HB stars used in our calculations and the magnitudes of the clusters. Our for NGC 6293 is 0.16 mag brighter than that of Harris (1996), who obtained = 16.50 mag using the data obtained by Janes & Heasley (1991). It is thought that this difference in the NGC 6293 magnitude may explain a 0.1 mag difference in the distance modulus of NGC 6293 in Table 6, since the previous distance modulus of NGC 6293 mainly relies on the magnitude. For NGC 6541, our is 0.25 mag and 0.15 mag fainter than those of Alcaino (1979) and Alcaino et al. (1997), who obtained = 15.1 mag and 15.2 mag, respectively. It should be noted that, however, our for NGC 6541 is rather uncertain since our measurement is based on only two HB stars. It also should be noted that the HB stars that we used in our calculations appear to be located in the instability strip222In Figure 12, we also show the first harmonic blue edge and the fundamental red edge of M3 RR Lyrae variables (Carretta et al. 1998). and they are likely either membership RR Lyrae variables or non-variable off-cluster field populations that appear to lie inside the instability strip. As shown in Table 1, the HB type () of NGC 6541 is 1.00, i.e. NGC 6541 is known to have neither RR Lyrae variables nor red HB stars, and therefore the HB stars in Figure 12 could be off-cluster field populations. Since our photometric measurements of bright stars in our fields rely on the three short exposure frames (see Table 2), our estimate may not be appropriate to estimate mean magnitude of RR Lyrae variables.
If we adopt the intensity-weighted = = 0.44 0.03 mag for M92 (see Lee et al. 2001), = 14.66 0.05 mag for NGC 6293 and = 14.38 0.09 mag for NGC 6541 if = 0.17 and = 14.47 0.09 mag if = 0.14. Our distance modulus using the HB stars agrees well with that in Table 6 for NGC 6293. For NGC 6541,333 The luminosity of the RR Lyrae variables or HB stars are also affected by metallicity. If we use the relation of Carney, Storm, & Jones (1992), (1) for NGC 6541 is 0.06 mag fainter than that of M92 and consequently = 14.41, which is still larger than those in Table 6. the distance modulus using the two HB stars is 0.15 mag larger than that in Table 6, suggesting that perhaps 15.2 mag is correct for NGC 6541, which is adopted by Harris (1996) and Alcaino et al. (1997). If we adopt our distance modulus values = 14.61 mag and 14.24 mag for NGC 6293 and NGC 6541, the distances of the clusters from the Sun become 8.4 kpc and 6.9 kpc, respectively. The Galactocentric distances of NGC 6293 and NGC 6541 are 1.2 kpc and 2.3 kpc, respectively, for = 8.0 kpc (Reid 1993). Therefore, NGC 6293 and NGC 6541 are clearly located in the Galaxy’s central regions.
3.5 Differential Reddening in NGC 6293?
In Figure 10, the MS/RGB fiducial sequences of M92 and NGC 2419 show an excellent agreement with NGC 6293 MS/RGB stars, while the HB sequences of M92 and NGC 2419 appear to be slightly brighter and bluer than the NGC 6293 HB stars. On the other hand, the NGC 6541 BHB stars show better agreement with the HB fiducial sequences of M92 or NGC 2419 in Figure 11.
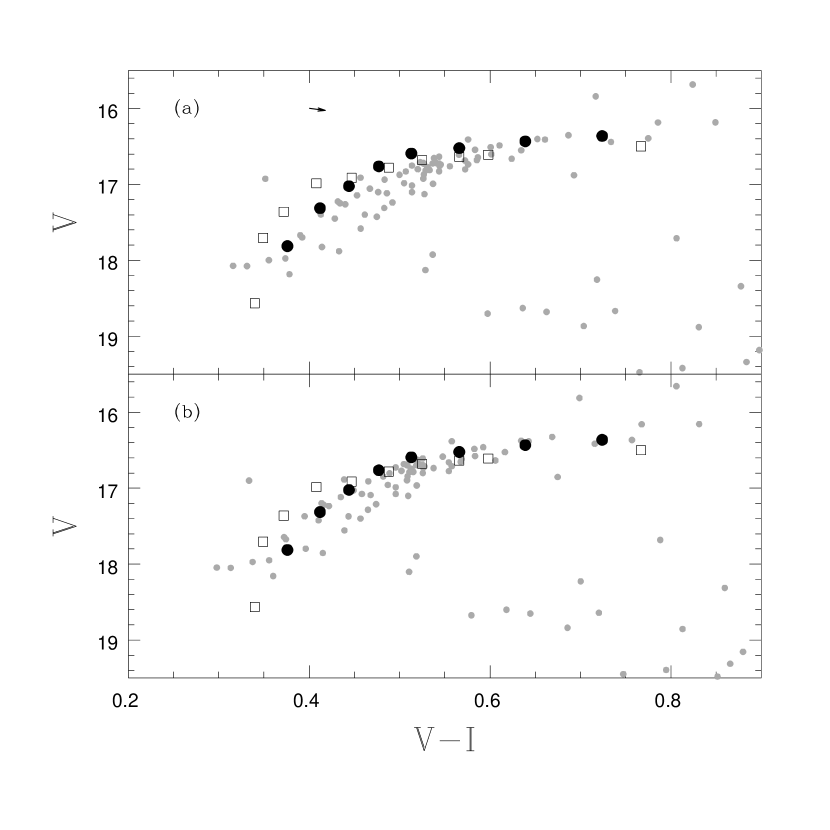
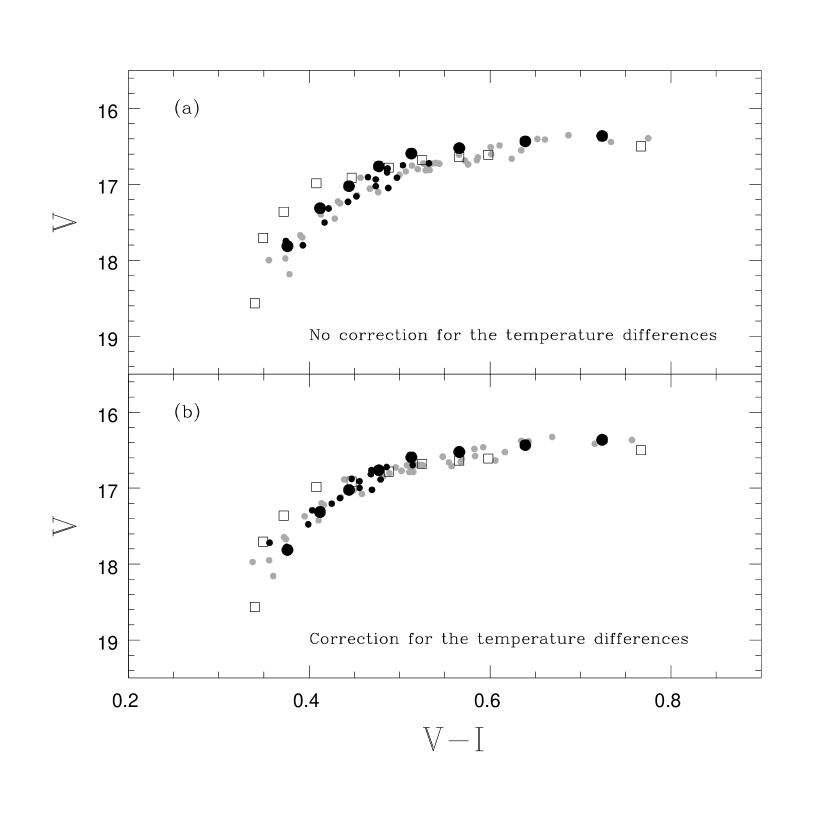
The disagreement in HB magnitudes or colors between NGC 6293 and M92 (or NGC 2419) seems hard to explain, since NGC 6293 and M92 appear to have similar chemical compositions and ages as we discussed above. We can imagine two possible explanations, predicated on the assumption that the CMDs for all three clusters should be very similar. First, there is apparently a source temperature sensitivity to reddening corrections. This can be a significant effect in the HST WFPC2 F550W/F814W photometric system, in the sense that the interstellar extinction values for NGC 6293 HB stars are larger than those for NGC 6293 MS/RGB stars due to differences surface temperature. As Holtzman et al. (1995a) pointed out, the bandwidths of HST WFPC2 F555W/F814 filter system are wider than the ground-based filter system, so the interstellar extinction in the HST WFPC2 photometric system is slightly vulnerable to the temperature (i. e., ) of the source [for example, see the Appendix A of Lee et al. (2002) for the detailed discussion of the temperature dependence in the interstellar extinction law for the HST NICMOS photometric system]. More recently, Romaniello et al. (2002) presented interstellar extinction coefficients of the HST WFPC2 photometric system for selected stellar temperatures (see their Table 8). Using their results, we obtain differential reddening correction values between = 6500 K ( of the MSTO) and 10000 K ( of the HB), of = 0.027 mag and = 0.018 mag assuming = 0.40 for NGC 6293, in the sense that blue HB stars suffer more extinction than MSTO stars. We show our results in Figure 13. In the upper panel of the Figure, we show the differential reddening correction vector due to the difference in temperature by an arrow. In the bottom panel of the Figure, we show the NGC 6293 CMD after applying the differential reddening correction due to the temperature difference between the MSTO and the HB. The agreement in HB locations is slightly improved in the Figure.
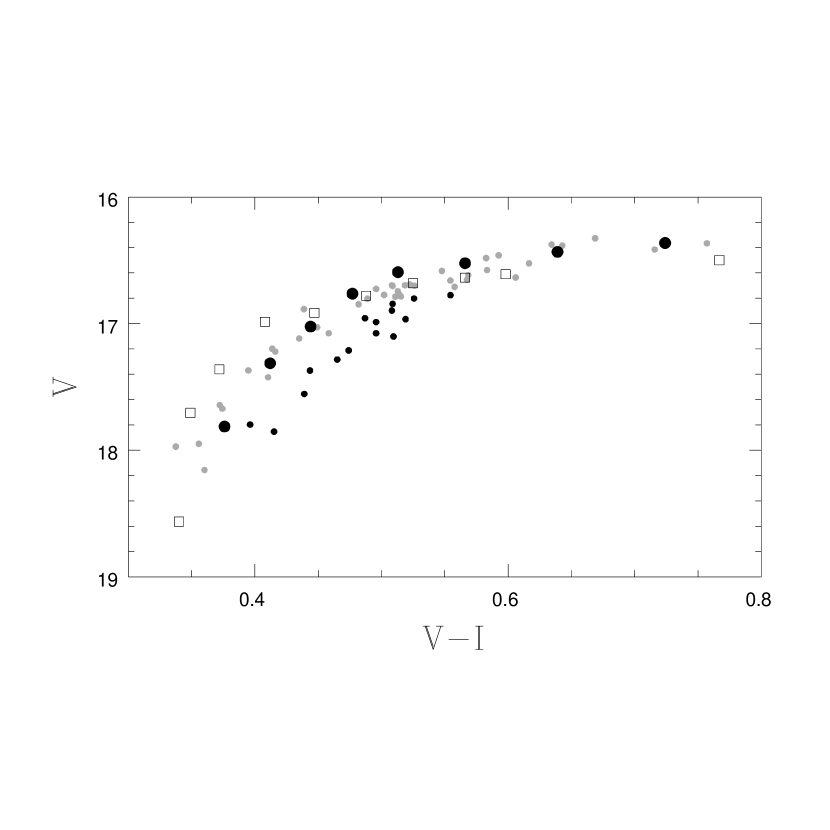
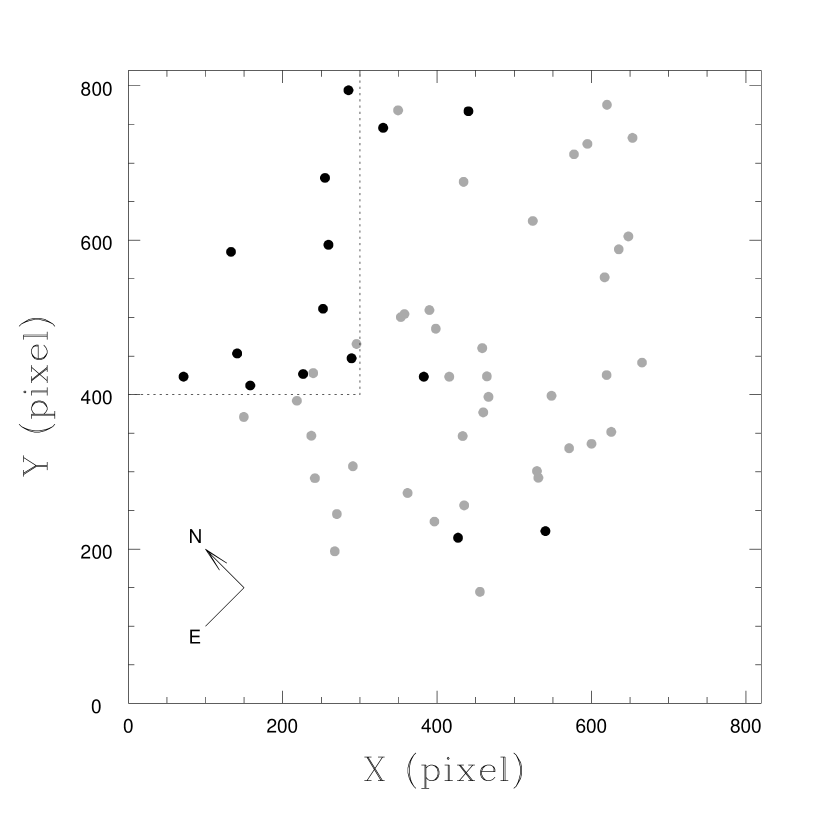
However, many of the NGC 6293 HB stars still appear to have fainter magnitudes or redder colors than M92 HB stars, suggesting that the discrepancy may not be mainly due to the induced differential reddening due to differences in the temperatures of the stars. True differential reddening and variations in interstellar absorption may also be at work. We approach this possibility by considering the apparently under-luminous HB stars in the field NGC 6293-F1 by eye (see Figure 14). We show their spatial distribution in Figure 15. In the Figure, gray dots represent the HB stars with normal luminosity and black dots represent the under-luminous HB stars in the field NGC 6293-F1. Figure 15 clearly indicates that most under-luminous HB stars are located to the north of the cluster (the upper left corner of the Figure), suggesting that differential reddening exists in the cluster. We also explore this differential reddening effect using the NGC 6293 RGB stars. We select stars with 300 and 400 detected in the field NGC 6293-F1 (inside the dotted lines in Figure 15; this area does not overlap with the field NGC 6293-F2) and we show their CMD superposed on the CMD of stars detected in the rest of the field in Figure 16. As can be seen, the colors of RGB stars in this region appears to be 0.03 – 0.05 mag redder than the mean color of the fiducial sequence of the cluster. Therefore, if this color difference is due to the differential reddening, the interstellar extinction toward the north of the cluster is = 0.02 – 0.04 mag and = 0.06 – 0.12 mag larger. In Figure 17, we show the CMD of the HB region in the field NGC 6293-F1 after applying the mean differential reddening correction, = 0.04 mag and = 0.08 mag. It should be recalled that this differential reddening correction value came from the RGB stars and applying this correction value to the NGC 6293 HB stars shows good agreement with the M92 HB fiducial sequence.
We conclude that the disagreement in HB magnitudes or colors between NGC 6293 and M92 (or NGC 2419) in Figure 10 are mainly due to true differential reddening across NGC 6293.
4 AGES OF THE METAL-POOR INNER HALO CLUSTERS
The absolute and relative ages of globular clusters are of considerable interest in trying to resolve when star formation began in the Galaxy and how long the Galactic halo formed stars. In this study, we are concerned primarily with the most metal-poor clusters, which are presumably the oldest, and the key question to which we seek the answer is whether star formation began at different times in the higher density central regions compared to the lower density outer regions. We are not the first to address this question, of course. Rosenberg et al. (1999) employed two relative age-dating techniques, one relying on the magnitude difference between the horizontal branch and the main sequence turn-off (the “vertical” method) and the other relying on the color difference between the turn-off and a point 2.5 mag brighter on the red giant branch (the “horizontal” method). They found that the most metal-poor clusters had ages that were not distinguishably different, but their innermost metal-poor cluster ([Fe/H] ) lies at = 6.0 kpc. Salaris & Weiss (2002) also addressed globular cluster relative ages, relying on a mix of “vertical” and “horizontal” methods, although in the latter case they relied on the color differences defined by VandenBerg et al. (1990), which is the same approach that we have adopted. They found results very similar to Rosenberg et al. (1999), which is not too surprising since very similar clusters were analyzed using very similar techniques. Again, the innermost metal-poor cluster, NGC 6397, lies at = 6.0 kpc. The most recent such study is that of De Angeli et al. (2005), who relied on a mix of HST and ground-based data of high quality. Using the Zinn & West (1984) metallicity scale, their sample includes four clusters with 5.0 kpc: NGC 6093 (3.8 kpc); NGC 6273 (1.6 kpc); NGC 6287 (1.7 kpc); and NGC 6809 (3.9 kpc). Using a “normalized age”, defined to be the ratio of the derived age to that of the ensemble of all metal-poor clusters, these four clusters were found to have normalized ages of , , , and . In other words, not only do the ensemble of metal-poor clusters show no detectable differences in derived relative ages, neither do the innermost metal-poor clusters.
Our work on relative cluster ages has concentrated on the innermost globular clusters with blue horizontal branches. Our logic, like that of van den Bergh (1993), has been that if the color of the horizontal branch is determined by both metallicity and age, these may be the oldest clusters in the Galaxy. Our earlier work on NGC 6287 (Lee et al. 2001) showed that the most metal-poor inner halo globular cluster NGC 6287 and M92 have the same ages within 2 Gyr ( 14 % if the absolute age of M92 is 14 Gyr; VandenBerg 2000). De Angeli et al. (2005) likewise concluded that NGC 6287 was not distinguishably different in age from outer halo metal-poor clusters, presumably using the same HST data as did we.
In this paper we have discussed the relative ages of the inner halo globular clusters NGC 6293 and NGC 6541 with respect to the intermediate halo globular cluster M92 and the remote halo globular cluster NGC 2419. The blue horizontal branches that dominate these clusters have made employment of any “vertical” method of relative age dating problematical, and we have had to rely, instead, on the “horizontal” method defined by VandenBerg et al. (1990). We have shown here that NGC 6293 and NGC 6541 essentially have the same ages as M92 and NGC 2419 within 1 Gyr ( 7 %), in spite of very different current Galactocentric distances. We have also discussed the effect of -elements on our relative age estimates and we suggested that their contribution is negligibly small, in particular for NGC 6287 and NGC 6293. Derived ages of globular clusters also depend on the adopted helium abundances, since the helium abundance governs stellar evolutionary timescales and stellar internal structures (primarily due to its influence on mean molecular weight). The most frequently used method for the helium abundance estimation of the globular clusters is the -method, where is defined to be the number ratio of HB stars and RGB stars brighter than the zero-age HB stars, , (Buzzoni et al. 1983; Caputo et al. 1987). The number ratio is then related to the helium abundance of the clusters. In our study, we were not able to estimate the helium abundances of our program clusters using the -method mainly due to the saturation of the bright RGB stars. Also we do not have photometric measurements for the off-cluster field populations to correct the field star contamination in deriving the number ratio. Therefore, the helium abundance of our program clusters is still an open question. However, the recent study of Sandquist (2000) suggested that the helium abundance of the globular clusters appears to be constant (Y 0.20) with metallicity, as expected if Y scales proportionately with Z.
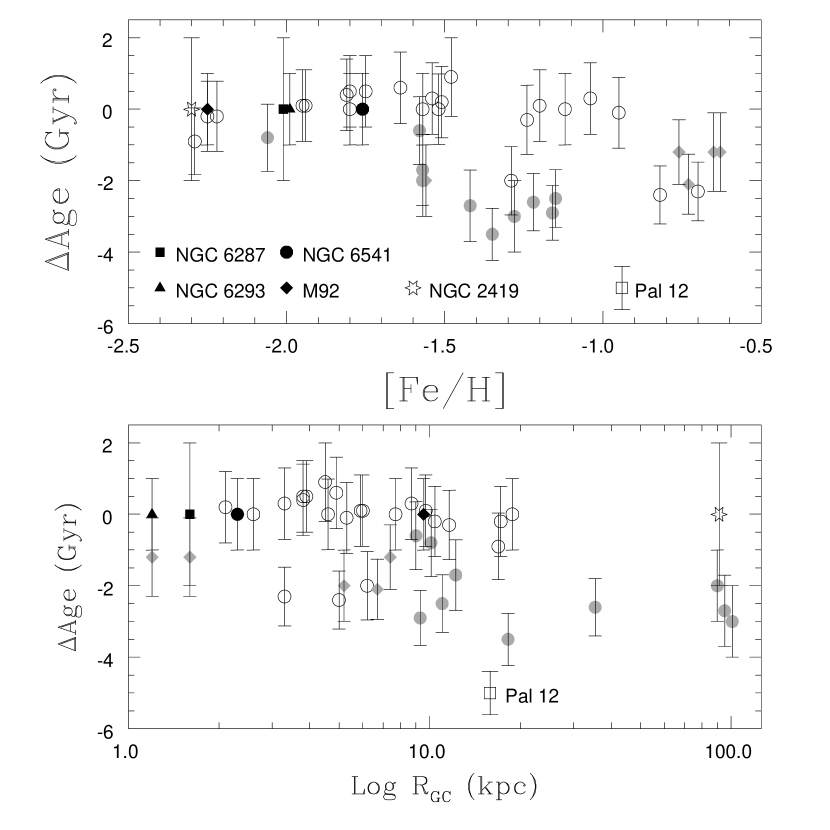
In Figure 18, we show relative ages of the globular clusters as functions of metallicity and the Galactocentric distance using the combined results of our work, Harris et al. (1997), Heasley et al. (2000), Lee et al. (2001), Rosenberg et al. (1999),444It should be noted that the relative age estimates of Rosenberg (1999) may be slightly inaccurate. Lee & Carney (1999b) argued that M2, which is most likely as old as M92, is 2 Gyr older than M3, while Rosenberg et al. (1999) claimed that M3 and M92 have the same ages. VandenBerg (2000) also claimed that M3 appears to be 1 - 1.5 Gyr younger than M92. Recently, Rey et al. (2001) studied M3 vs M13 and they concluded that M13 is 1.7 0.7 Gyr older than M3, while Rosenberg et al. (1999) suggested the same ages between the two clusters. Another example is M5 compared to NGC 6752. VandenBerg (2000) obtained 2 Gyr younger ages than did Rosenberg et al. (1999) for these clusters. Although Rosenberg et al. (1999) claimed that their results are based on the homogenous data sets, an independent investigation using deep main-sequence photometry of their sample would be desirable. Figure 18 relies mainly on Rosenberg et al. (1999). and Stetson et al. (1999). The Figure shows that the ages of the oldest globular clusters (mostly the old halo population) in our Galaxy do not vary with metallicity ([Fe/H] 1.0) or Galactocentric distance. In particular, our work clearly shows that there is no age gradient in the inner part of our Galaxy. Thus, our results are consistent with the idea that the globular cluster formation must have been triggered almost everywhere at about the same time in our Galaxy. Since Harris et al. (1997) claimed that the very remote halo cluster NGC 2419 ( 90 kpc) and M92 essentially have the same age, our result and that of Lee et al. (2001) extend this to the three most metal-poor inner halo ( 3 kpc) globular clusters in our Galaxy.
5 CONCLUSIONS
We have presented HST PC2 photometry for the inner halo globular clusters NGC 6293 and NGC 6541. Our CMD for NGC 6293 shows a strong BHB population, consistent with its low metallicity and old age. It also appears to have blue straggler stars and a future study related to these objects is desirable. We could not investigate the RGB-tip luminosity, which was claimed by Janes & Heasley (1991) to be abnormally faint, since the bright RGB stars were saturated in our images. Our magnitudes and colors for the NGC 6541 main-sequence TO are in good agreement with the ground-based photometry of Alcaino (1997). Our CMD for NGC 6541 appears to be deficient in bright RGB stars, confirming the finding of Alcaino (1997).
We have discussed the interstellar reddening and the distance modulus of NGC 6293 and NGC 6541 with respect to those of M92. For NGC 6293, our interstellar reddening estimate is consistent with previous results, while our distance modulus is 0.1 mag smaller than the previous estimate by Harris (1996). We also discussed the differential reddening across NGC 6293. It appears that the interstellar reddening value of NGC 6293 varies by 0.02 – 0.04 mag. For NGC 6541, our age-dating method, which makes use of M92 as a template, appears to suffer from modest metallicity difference effects. Our interstellar reddening and distance modulus of NGC 6541 are = 0.17 and = 14.24 without the correction for the metallicity effect, and = 0.14 and = 14.19 with such a correction. Nevertheless, NGC 6293 and NGC 6541 are clearly located in the Galaxy’s central regions ( 3 kpc).
The most interesting result of our study is that the inner halo clusters NGC 6293 and NGC 6541 essentially have ages that are indistinguishably different from one of the oldest globular clusters in our Galaxy M92, consistent with the previous result of NGC 6287 by Lee et al. (2001), and the large study of De Angeli et al. (2005). Furthermore, they appear to have the same ages as the most remote metal-poor globular cluster NGC 2419 ( 90 kpc). Our results strongly support the idea that the globular cluster formation must have begun everywhere at the same time to within 0.5 – 1 Gyr in our Galaxy.
References
- (1)
- (2) Alcaino, G. 1971, A&A, 13, 339
- (3)
- (4) Alcaino, G. 1979, A&AS, 35, 233
- (5)
- (6) Alcaino, G., Liller, W., Alvardo, R., Kravtsov, V., Ipatov, A., & Samus, N. 1997, AJ, 114, 2638
- (7)
- (8) Arce, H. G., & Goodman, A. A. 1998, ApJ, 512, L135
- (9)
- (10) Barbuy, B., Bica, E., & Ortolani, S. 1998, A&A, 333, 117
- (11)
- (12) Bergbusch, P. A., & VandenBerg, D. A. 2001, ApJ, 556, 322
- (13)
- (14) Buonanno, R., Corsi, C. E., Zinn, R., Fusi Pecci, F., Hardy, E., & Suntzeff, N. B. 1998, ApJ, 501, L33
- (15)
- (16) Buzzoni, A., Fusi Pecci, F., Buonnano, R., & Corsi, C. E. 1983, A&A, 128, 94
- (17)
- (18) Caputo, F., Roger, C. M., & Paez, E. 1987, A&A, 183, 228
- (19)
- (20) Carney, B. W., Storm, J., & Jones, R. V. 1992, ApJ, 386, 663
- (21)
- (22) Carretta, E., Cacciari, C., Ferraro, F. R., Fusi Pecci, F., & Tessicini, G. 1998, MNRAS, 298, 1005
- (23)
- (24) Chaboyer, B., Demarque, P., & Sarajedini, A. 1996, ApJ, 459, 558
- (25)
- (26) Chieffi, A., Straniero, O., & Salaris, M. 1991 in ASP Conf. Ser. Vol. 13, The Formation and Evolution of Star Clusters, edited by K. Janes (San Francisco: ASP), p. 219
- (27)
- (28) Davies, M. B., Piotto, G., & De Angeli, F. 2004, MNRAS, 349, 129
- (29)
- (30) De Angeli, F., Piotto, G., Cassisi, S., Busso, G., Recio-Blanco, A., Salaris, M., Aparicio, A., & Rosenberg, A. 2005, AJ, 130, 116
- (31)
- (32) Dutra, C. M., & Bica, E. 2000, A&A, 359, 347
- (33)
- (34) Eggen, O. J., Lynden-Bell, D., & Sandage, A. 1962, ApJ, 136, 748
- (35)
- (36) Ferraro, F. R., Fusi Pecci, F., & Bellazzini, M. 1995, A&A, 294, 80
- (37)
- (38) Font, A. S., Johnston, K. V., Bullock, J. S., & Robertson, B. E. 2006, ApJ, 638, 585
- (39)
- (40) Grillmair, C. J., Mould, J. R., Holtzman, J. A., Worthey, G., Ballester, G. E., Burrows, C. J., Clarke, J. T., Crisp, D., Evans, R. W., Gallagher, J. S., III, Griffiths, R. E., Hester, J. J., Hoessel, J. G., Scowen, P. A., Stapelfeldt, K. R., Trauger, J. T., Watson, A. M., & Westphal, J. A. 1998, AJ, 115, 144
- (41)
- (42) Harris, W.E. 1996, AJ, 112, 1487
- (43)
- (44) Harris, W. E., Bell, R. A., VandenBerg, D. A., Bolte, M., Stetson, P. B., Hesser, J. E., van den Bergh, S., Bond, H. E., Fahlman, G. G., & Richer, H. B. 1997, AJ, 114, 1030
- (45)
- (46) Heasley, J. N., Janes, K. A., Zinn, R., Demarque, P., Da Costa, G. S., Christian, C. A. 2000, AJ, 120, 879
- (47)
- (48) Held, E. V., Saviane, I., Momany, Y., & Carraro, G. 2000, ApJ, 530, L85
- (49)
- (50) Helmi, A., White, S. D. M., & Springel, V. 2003, MNRAS, 339, 834
- (51)
- (52) Holtzman, J. A., Burrows, J., Casertano, S. Hester, J. J., Trauger, J. T., Waston, A. M., & Worthey, G. 1995a, PASP, 107, 1065
- (53)
- (54) Holtzman, J. A., Hester, J. J., Casertano, S., Trauger, J. T., Waston, A. M., Ballester, G. E., Burrows, C. J., Clarke, J. T., Crisp, D., Evans, R. W., Gallagher, J. S., Griffithes, R. E., Hoessel, J. G., Matthews, L. D., Mould, J. R., Scowen, P. A., Stapelfeldt, K. R., & Westphal, J. A. 1995b, PASP, 107, 156
- (55)
- (56) Isobe, S. 1974, A&A, 36, 333
- (57)
- (58) Janes, K. A., & Heasley, J. N. 1991, AJ, 2097
- (59)
- (60) Johnson, J. A., & Bolte, M. 1998, AJ, 115, 693
- (61)
- (62) Johnson, J. A., Bolte, M., Stetson, P. B., Hesser, J. E., Somerville, R. S. 1999, ApJ, 527, 199
- (63)
- (64) Kraft, R. P. 1994, PASP, 106, 553
- (65)
- (66) Langer, R. E., Hoffman, R., & Sneden, C. 1993, PASP, 105, 301
- (67)
- (68) Lauer, T. R. 1999, PASP, 111, 1434
- (69)
- (70) Layden, A. C., & Sarajedini, A. 2000, AJ, 119, 1760
- (71)
- (72) Lee, J. -W., & Carney, B. W. 1999a, AJ, 117, 2868
- (73)
- (74) Lee, J. -W., & Carney, B. W. 1999b, AJ, 118, 1373
- (75)
- (76) Lee, J. -W., & Carney, B. W. 2002, AJ, 124, 1511
- (77)
- (78) Lee, J. -W., Carney, B. W., Fullton, L., K., & Stetson, P. B. 2001, AJ, 122, 3136
- (79)
- (80) Lee, Y. -W., Demarque, P., & Zinn, R. 1994, ApJ, 423, 248
- (81)
- (82) Mighell, K. J. 1997, AJ, 114, 1458
- (83)
- (84) Mighell, K. J., & Burke, C. J. 1999, AJ, 118, 366
- (85)
- (86) Mighell, K. J., & Rich, R. M. 1996, AJ, 111, 777
- (87)
- (88) Montegriffo, P., Bellazzini, M., Ferraro, F. R., Martins, D., Sarajedini, A., & Fusi Pecci, F. 1998, MNRAS, 294, 315
- (89)
- (90) Navarro, J. F., Frenk, C. S., & White, S. D. M. 1997, ApJ, 490, 493
- (91)
- (92) Noyola, E., & Gebhardt, K. 2006, AJ, in press (astro-ph/0604251)
- (93)
- (94) Piotto, G., De Angeli, F., King, I. R., Djorgovski, S. G., Bono, G., Cassisi, S., Meylan, G., Recio-Blanco, A., Rich, R. M., Davies, M. B. 2004, ApJ, 604, 109
- (95)
- (96) Reid, M. J. 1993, ARA&A, 31, 345
- (97)
- (98) Rey, S. -C., Yoon, S. -J., Lee, Y. -W., Cahboyer, B., & Sarajedini, A. 2001, AJ, 122, 3219
- (99)
- (100) Richer, H. B., Harris, W. E., Fahlman, G. G., Bell, R. A., Bond, H. E., Hesser, J. E., Holland, S., Pryor, C., Stetson, P. B., VandenBerg, D. A., & van den Bergh, S. 1996, ApJ, 463, 602
- (101)
- (102) Roberston, B., Bullock, J. S., Font, A. S., Johnston, K. V., & Hernquist, L. 2005, ApJ, 632, 872
- (103)
- (104) Romaniello, M., Panagia, N., Scuderi, S., & Kirshner, R. P. 2002, AJ, 123, 915
- (105)
- (106) Rosenberg, A., Saviane, I., Piotto, G., & Aparicio, A. 1999, AJ, 118, 2306
- (107)
- (108) Saio, H., & Yoshii, Y. 1979, PASJ, 31, 339
- (109)
- (110) Salaris, M., & Weiss, A. 2002, A&A, 388, 492
- (111)
- (112) Sandquist, E. L. 2000, MNRAS, 313,571
- (113)
- (114) Sandquist, E. L. 2005, ApJ, 635, 73
- (115)
- (116) Schlegel, D. J., Finkbeiner, D. P., & Davis, M. 1998, ApJ, 500, 525
- (117)
- (118) Searle, L., & Zinn, R. 1978, ApJ, 225, 357
- (119)
- (120) Shetrone, M. D., Côté, P., & Sargent, W. L. W. 2001, ApJ, 548, 592
- (121)
- (122) Shetrone, M. D., Venn, K. A., Tolstoy, E., Primas, F., Hill, V., & Kaufer, A. 2003, AJ, 125, 684
- (123)
- (124) Stetson, P. B. 1994, PASP, 106, 250
- (125)
- (126) Stetson, P. B., 1995, DAOPHOT II User’s Manual (Victoria: Dominion Astrophys. Obs.)
- (127)
- (128) Stetson, P. B., Bolte, M., Harris, W. E., Hesser, J. E., van den Bergh, S., VandenBerg, D. A.,, Bell, R. A., Johnson, J. A., Bond, H. E., Fullton, L. E., Fahlman, G. G., & Richer, H. B. 1999 AJ, 117, 217
- (129)
- (130) Trager, S. C., King, I. R., & Djorgovski, G. 1995, AJ, 109, 218
- (131) Turner, A. M. 1995, Cooking with ALLFRAME (Victoria: Dominion Astrophys. Obs.)
- (132)
- (133) VandenBerg, D. A. 1992, ApJ, 391, 685
- (134)
- (135) VandenBerg, D. A. 2000, ApJS, 129, 315
- (136)
- (137) VandenBerg, D. A., & Bell, R. A. 2001, NewA Rev., 45, 577
- (138)
- (139) VandenBerg, D. A., Bolte, M., & Stetson, P. B. 1990, AJ, 100, 445
- (140)
- (141) VandenBerg, D. A., & Stetson, P. B. 1991, AJ, 102, 1043
- (142)
- (143) van den Bergh, S. 1993, ApJ, 411, 178
- (144)
- (145) Venn, K. A., Irwin, M., Shetrone, M. D., Tout, C. A., Hill, V., & Tolstoy, E. 2004, AJ, 128, 1177
- (146)
- (147) WFPC2 Group, 1998, WFPC2 data analysis: A tutorial (Baltimore: STScI)
- (148)
- (149) White, S. D. M., & Rees, M. 1978, MNRAS, 183, 341
- (150)
- (151) Whitmore, B. & Heyer, I. 1997, Instrument Science Report WFPC2-97-08 (Baltimore: STScI)
- (152)
- (153) Zinn, R. 1993, in The Globular Cluster-Galaxy Connection, ASP Conf. Ser. Vol. 48, edited by G. H. Smith and J. P. Brodie (A.S.P., San Francisco), p. 38
- (154)
- (155) Zinn, R., & West M. J. 1984, ApJS, 55, 45
- (156)
| ID | [Fe/H]aaBased on the high-resolution echelle spectroscopy of the two giants (Lee & Carney, 2002). | l | b | HB typebbHB type = (Lee et al. 1994). | ccCluster central concentration, | aaBased on the high-resolution echelle spectroscopy of the two giants (Lee & Carney, 2002). | ||
|---|---|---|---|---|---|---|---|---|
| (km/s) | ||||||||
| NGC 6293 | -1.99 | 0.41 | 357.62 | 7.83 | 1.4 | 0.90 | 2.5 | 159.9 |
| NGC 6541 | -1.76 | 0.14 | 349.29 | 11.18 | 2.2 | 1.00 | 2.0 | 167.5 |
| ID | Field | Passband | Date/Time | |
|---|---|---|---|---|
| (UT start) | (sec) | |||
| NGC 6293 | F1 | F555W | 1995 Mar 23 12:44 | 40.0 3 |
| F555W | 1995 Mar 23 12:50 | 500.0 4 | ||
| F814W | 1995 Mar 23 14:23 | 60.0 3 | ||
| F814W | 1995 Mar 23 14.32 | 700.0 4 | ||
| F2 | F555W | 1995 Mar 23 17:24 | 40.0 3 | |
| F555W | 1995 Mar 23 17:30 | 500.0 4 | ||
| F814W | 1995 Mar 23 19:12 | 60.0 3 | ||
| F814W | 1995 Mar 23 19:21 | 700.0 4 | ||
| NGC 6541 | F1 | F555W | 1994 Oct 15 00:08 | 12.0 3 |
| F555W | 1994 Oct 15 00:14 | 140.0 4 | ||
| F814W | 1994 Oct 15 00:33 | 20.0 3 | ||
| F814W | 1994 Oct 15 00:39 | 260.0 3 | ||
| F2 | F555W | 1994 Oct 15 01:52 | 12.0 3 | |
| F555W | 1994 Oct 15 01:58 | 140.0 4 | ||
| F814W | 1994 Oct 15 02:17 | 20.0 3 | ||
| F814W | 1994 Oct 15 03:13 | 260.0 4 |
| Field11“1” – F1 only; “2” – F2 only; “o” – overlap region | ID | X22The pixel coordinate, where the image scale is 0.0455 arcsec/pixel | Y22The pixel coordinate, where the image scale is 0.0455 arcsec/pixel | |||
|---|---|---|---|---|---|---|
| 1 | 154 | 189.826 | 60.580 | 17.648 | 16.194 | 1.454 |
| 1 | 194 | 652.373 | 61.169 | 18.108 | 16.689 | 1.419 |
| 1 | 546 | 113.289 | 62.445 | 19.499 | 18.197 | 1.302 |
| 1 | 585 | 371.216 | 67.719 | 19.493 | 18.397 | 1.096 |
| 1 | 435 | 292.458 | 69.570 | 19.231 | 17.999 | 1.232 |
| 1 | 506 | 72.605 | 71.835 | 19.384 | 18.115 | 1.269 |
| 1 | 250 | 660.657 | 72.716 | 18.361 | 17.036 | 1.324 |
| 1 | 298 | 303.934 | 73.579 | 18.760 | 17.473 | 1.286 |
| 1 | 543 | 339.264 | 78.241 | 19.455 | 18.309 | 1.145 |
| n | n | |||||||||
|---|---|---|---|---|---|---|---|---|---|---|
| 15.574 | 0.020 | 1.509 | 0.010 | 4 | 20.198 | 0.003 | 1.064 | 0.001 | 415 | |
| 15.783 | 0.025 | 1.486 | 0.008 | 5 | 20.402 | 0.003 | 1.076 | 0.002 | 392 | |
| 16.005 | 0.020 | 1.454 | 0.008 | 10 | 20.604 | 0.003 | 1.093 | 0.002 | 471 | |
| 16.202 | 0.025 | 1.431 | 0.007 | 5 | 20.797 | 0.003 | 1.108 | 0.002 | 446 | |
| 16.440 | 0.019 | 1.418 | 0.005 | 5 | 20.997 | 0.003 | 1.126 | 0.002 | 505 | |
| 16.591 | 0.014 | 1.399 | 0.007 | 6 | 21.200 | 0.003 | 1.151 | 0.002 | 493 | |
| 16.749 | 0.016 | 1.390 | 0.006 | 6 | 21.394 | 0.003 | 1.175 | 0.002 | 482 | |
| 16.988 | 0.014 | 1.381 | 0.005 | 20 | 21.601 | 0.003 | 1.206 | 0.002 | 489 | |
| 17.214 | 0.011 | 1.358 | 0.006 | 10 | 21.799 | 0.003 | 1.228 | 0.002 | 507 | |
| 17.414 | 0.014 | 1.357 | 0.004 | 17 | 21.999 | 0.003 | 1.264 | 0.002 | 435 | |
| 17.611 | 0.012 | 1.345 | 0.005 | 20 | 22.198 | 0.003 | 1.296 | 0.002 | 422 | |
| 17.807 | 0.014 | 1.329 | 0.005 | 25 | 22.400 | 0.003 | 1.327 | 0.002 | 390 | |
| 18.007 | 0.012 | 1.327 | 0.006 | 23 | 22.606 | 0.003 | 1.368 | 0.003 | 316 | |
| 18.189 | 0.009 | 1.313 | 0.004 | 33 | 22.800 | 0.003 | 1.414 | 0.002 | 307 | |
| 18.416 | 0.008 | 1.301 | 0.003 | 38 | 23.000 | 0.003 | 1.454 | 0.003 | 302 | |
| 18.611 | 0.010 | 1.283 | 0.004 | 38 | 23.203 | 0.004 | 1.489 | 0.003 | 244 | |
| 18.797 | 0.008 | 1.272 | 0.005 | 39 | 23.393 | 0.004 | 1.535 | 0.003 | 179 | |
| 19.011 | 0.007 | 1.238 | 0.005 | 56 | 23.604 | 0.004 | 1.583 | 0.004 | 168 | |
| 19.215 | 0.006 | 1.177 | 0.004 | 76 | 23.798 | 0.005 | 1.632 | 0.004 | 134 | |
| 19.419 | 0.004 | 1.110 | 0.003 | 186 | 23.996 | 0.005 | 1.666 | 0.004 | 143 | |
| 19.607 | 0.003 | 1.062 | 0.002 | 245 | 24.190 | 0.005 | 1.715 | 0.005 | 105 | |
| 19.801 | 0.003 | 1.052 | 0.002 | 291 | 24.400 | 0.006 | 1.771 | 0.006 | 83 | |
| 20.009 | 0.003 | 1.051 | 0.002 | 332 | 24.589 | 0.007 | 1.803 | 0.006 | 65 |
| n | n | |||||||||
|---|---|---|---|---|---|---|---|---|---|---|
| 16.844 | 0.014 | 1.009 | 0.010 | 3 | 21.209 | 0.006 | 1.031 | 0.003 | 84 | |
| 17.227 | 0.000 | 0.983 | 0.000 | 1 | 21.394 | 0.006 | 1.073 | 0.004 | 93 | |
| 17.428 | 0.025 | 0.976 | 0.005 | 6 | 21.607 | 0.006 | 1.123 | 0.004 | 106 | |
| 17.590 | 0.032 | 0.965 | 0.006 | 5 | 21.798 | 0.006 | 1.165 | 0.004 | 105 | |
| 17.842 | 0.022 | 0.950 | 0.006 | 8 | 21.993 | 0.005 | 1.207 | 0.004 | 114 | |
| 18.017 | 0.018 | 0.894 | 0.005 | 13 | 22.189 | 0.006 | 1.251 | 0.004 | 91 | |
| 18.171 | 0.007 | 0.850 | 0.008 | 2 | 22.396 | 0.006 | 1.312 | 0.004 | 97 | |
| 18.402 | 0.016 | 0.772 | 0.007 | 19 | 22.598 | 0.006 | 1.368 | 0.005 | 95 | |
| 18.589 | 0.011 | 0.756 | 0.004 | 29 | 22.802 | 0.006 | 1.424 | 0.004 | 96 | |
| 18.811 | 0.009 | 0.745 | 0.004 | 39 | 23.001 | 0.006 | 1.482 | 0.005 | 90 | |
| 19.023 | 0.008 | 0.750 | 0.004 | 40 | 23.203 | 0.006 | 1.547 | 0.005 | 103 | |
| 19.196 | 0.008 | 0.765 | 0.003 | 64 | 23.404 | 0.006 | 1.564 | 0.006 | 89 | |
| 19.395 | 0.007 | 0.778 | 0.003 | 73 | 23.598 | 0.006 | 1.598 | 0.005 | 102 | |
| 19.613 | 0.007 | 0.798 | 0.003 | 65 | 23.803 | 0.007 | 1.649 | 0.007 | 72 | |
| 19.815 | 0.007 | 0.822 | 0.004 | 66 | 24.003 | 0.007 | 1.709 | 0.006 | 76 | |
| 19.995 | 0.007 | 0.832 | 0.003 | 78 | 24.201 | 0.007 | 1.770 | 0.006 | 78 | |
| 20.213 | 0.006 | 0.863 | 0.003 | 96 | 24.396 | 0.008 | 1.784 | 0.008 | 62 | |
| 20.392 | 0.005 | 0.892 | 0.003 | 107 | 24.589 | 0.008 | 1.873 | 0.006 | 51 | |
| 20.596 | 0.005 | 0.928 | 0.003 | 100 | 24.811 | 0.009 | 1.962 | 0.009 | 33 | |
| 20.802 | 0.005 | 0.953 | 0.003 | 101 | 24.996 | 0.013 | 1.961 | 0.011 | 20 | |
| 20.998 | 0.006 | 0.993 | 0.003 | 102 |
| NGC 6293 | NGC 6541 | Note | ||||||
|---|---|---|---|---|---|---|---|---|
| aaCorrected for the metallicity effect. | aaCorrected for the metallicity effect. | |||||||
| 0.40 | 14.61 | 0.17 | 14.24 | 0.14 | 14.19 | (1) | ||
| 0.40 | 14.64 | 0.16 | 14.27 | 0.14 | 14.22 | (2) | ||
| 0.41 | 14.72 | 0.14 | 14.24 | (3) | ||||
Note. — (1) With respect to M92; (2) with respect to NGC 2419; (3) Harris (1996)