Constraining the wind launching region in Herbig Ae stars: AMBER/VLTI spectroscopy of HD104237
Abstract
Aims. We investigate the origin of the emission of the Herbig Ae star HD104237 on Astronomical Unit (AU) scales.
Methods. Using AMBER/VLTI at a spectral resolution we spatially resolve the emission in both the line and the adjacent continuum.
Results. The visibility does not vary between the continuum and the line, even though the line is strongly detected in the spectrum, with a peak intensity 35% above the continuum. This demonstrates that the line and continuum emission have similar size scales. We assume that the K-band continuum excess originates in a “puffed-up” inner rim of the circumstellar disk, and discuss the likely origin of .
Conclusions. We conclude that this emission most likely arises from a compact disk wind, launched from a region 0.2-0.5 AU from the star, with a spatial extent similar to that of the near infrared continuum emission region, i.e, very close to the inner rim location.
Key Words.:
Stars: individual: HD104237 – Stars: pre-main sequence – Technique: interferometricemail: <etatulli@arcetri.astro.it>
1 Introduction
The spectra of pre-main sequence stars of all masses show prominent strong and broad emission lines, of both hydrogen and metals. These lines trace the complex circumstellar environment which characterizes this evolutionary phase, and are very likely powered by the associated accretion disks. The emission lines are used to infer the physical properties of the gas, and to constrain its geometry and dynamics. Their exact origin, however, is not known. The hydrogen lines, in particular, may originate either in the gas which accretes onto the star from the disk, as in magnetospheric accretion models (Hartmann et al. 1994), or in winds and jets, driven by the interaction of the accreting disk with a stellar (Shu et al. 1994) or disk (Casse & Ferreira 2000) magnetic field. For Herbig Ae stars, it is additionally possible that they form in the inner disk (Tambovtseva et al. 1999).
For all models, emission in the hydrogen lines is predicted to occur over very small spatial scales, a few AUs at most. To understand the physical processes that occur at these scales, one needs to combine very high spatial resolution with enough spectral resolution to resolve the line profile. AMBER, the three-beam near-IR recombiner of the VLTI (Petrov et al. 2003), simultaneously offers high spatial and high spectral resolution, with the sensitivity required to observe pre-main sequence stars. These capabilities were recently demonstrated by Malbet et al. (2006), who succesfully resolved the luminous Herbig Be system MWC297 in both the continuum and the line. They showed that the line emission originates from an extended wind, while the continuum infrared excess traces a dusty accretion disk.
In this Letter we concentrate on a lower mass, less active system, the Herbig Ae system HD104237. The central emission line star, of spectral type between A4V and A8, is surrounded by a circumstellar disk, which causes the infrared excess emission (Meeus et al. 2001) and drives a jet seen in Ly- images (Grady et al. 2004). The optical spectrum shows a rather narrow H emission with a P-Cygni profile (Feigelson et al. 2003). The disk is seen almost pole-on (; Grady et al. 2004), consistent with the low value of (12 km s-1; Donati et al. 1997). Donati et al. (1997) detected a stellar magnetic field of 50 G. Böhm et al. (2004) have revealed the presence of a very close companion of spectral type K3, orbiting with a period of days, and which bolometric luminosity is times fainter than the one of the central star. In the near infrared domain, spatially unresolved ISAAC observations (Garcia Lopez et al., 2006) show a strong emission line, with a peak flux 35% above the continuum.
2 Observations and data reduction
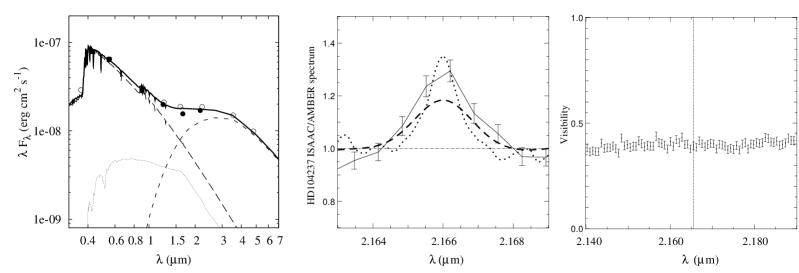
AMBER observed HD104237 on 26 February 2004 on the UT2-UT3 baseline of the VLTI, which corresponds to a projected length of . The instrument was set up to cover the spectral range with a spectral resolution of , which resolved the profile of the emission line at . The data consist of exposures of frames, with an integration time of for each frame. The integration time is a trade-off between gathering enough flux in the photometric channel and preventing excessive contrast loss due to fringe motion during the integration. At the time of these early observations the star magnitude of K= was close to the sensitivity limit of the medium spectral resolution mode, and as a result fringes are only visible in of the frames. In the photometric channels the line is under the noise level of the indivual frames, but it is well detected on their average and contributes of the total flux (Fig. 1, central panel). For comparison we overlay a higher spectral resolution spectrum (, taken with ISAAC approximately one year before the VLTI observations), as well as its smoothing to the AMBER spectral resolution. The two spectra are consistent with each other, within the combined typical line variability of Herbig Ae stars and calibration uncertainties.
Data reduction followed standard AMBER procedures (Tatulli et al. 2006). To optimize the signal to noise ratio (SNR) of the visibility derived from these relatively poor-quality data, we pre-selected frames with individual SNR greater than , ensuring that fringes are present in all short exposures that enter the visibility.
For these observations the visibility amplitude could not be calibrated to an absolute scale using an astronomical calibrator (unresolved star), due to non-stationary vibrations in the optical train of the UT telescopes. With a 100ms integration time these vibrations randomly degrade the fringe contrast of the individual frames by a large factor, and the statistics of that attenuation depends on uncontrolled factors (exact telescope and delay line pointing, recent environmental history, etc) that do not similarly affect the target star and its calibrator. Fortunately the contrast loss from vibrations is achromatic across our small relative bandpass, and as a consequence the differential visibility, that is, the relative visibility between the spectral channels, is unaffected. Our dataset therefore allows to investigate the visibility across the emission line compared to that in the adjacent continuum. The differential visibilities are accurate to approximately 5%.
The excess near infrared continuum emission in Herbig Ae stars most likely originates in the innermost regions of their dusty circumstellar disks, at the dust sublimation radius (Eisner et al. 2005; Isella et al. 2006). To approximately normalise the visibilities, we thus scaled the observed continuum value to the predictions of appropriate theoretical models of the disk inner rim emission (Isella & Natta 2005). We computed the structure of the “puffed-up” inner rim as described in Isella et al. (2006). We used for the two stars the following parameters: , for the primary and , for the secondary star, respectively. We adopted a distance of , and a disk mass surface density of g/cm2 (with in AU).
Fig. 1 (left) shows that the model using micron size astronomical silicates produces a very good fit of the SED. The star fluxes contribute approximately (respectively and for the primary and secondary star, which gives a binary flux ratio of in the K band) of the total flux, and the inner rim appears as a bright ring with radius ( at ). The resulting model visibility on the 35m baseline is (Fig 1, right). Note that the orbital period of the spectroscopic binary is days. This leads to an average separation of which corresponds to an angular separation of . The central system (A star + K3 companion) is therefore completely unresolved on the current baseline, and both stars are located inside the dust evaporation radius.
3 Results and discussions
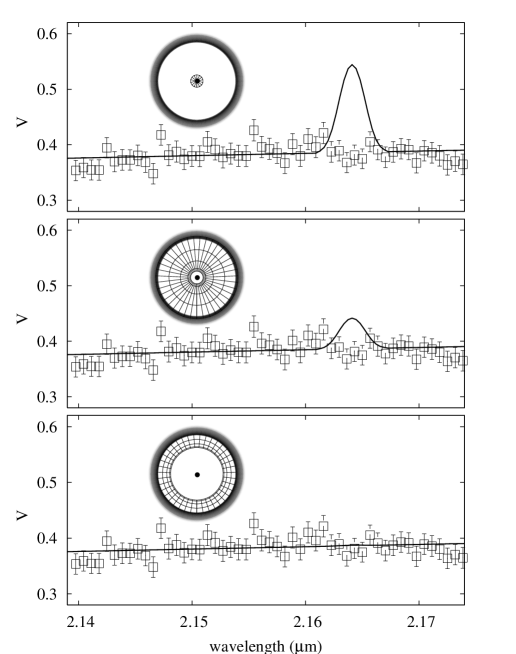
Within the fairly small error bars, the visibility does not change across the emission line. This result is robust and puts strong constraints on the relative spatial extent of the line and continuum emission regions, demonstrating that they have very similar apparent sizes. We use this constraint to probe the processes responsible for the the emission in this star, and consider in turn the three main mechanisms usually invoked to interpret the hydrogen line emission in pre-main-sequence stars. We translate each mechanism to a simple geometrical models of specific spatial extension, with the line strength fixed at the observational value, and evaluate the resulting visibility across the line111Note that this analysis is valid as long as the continuum emission is resolved. In our case the continuum is calibrated by a model and not by an unresolved star, and therefore there might be a chance that the visibility of the continuum is close to . However, this peculiar scenario appears very unlikey since the puffed-up rim model has been shown to be well representative of the very close environment of Herbig Ae stars over a large luminosity range (Monnier et al. 2005). Furthermore, the hypothesis of a resolved continuum emission for HD104237 is strongly supported by its measured accretion rate of (Grady et al. 2004). Indeed, Muzerolle et al. (2004) showed that for weak accretion rates (), the gaz accreting onto the star is optically thin. It therefore does not shield the dust from the stellar radiation and consequently, the star must exhibit an inner region free of dust, large enough to be resolved by the interferometer at the baseline..
Magnetospheric accretion: in such a model matter infalls on the star along magnetic field lines, and the base of this infalling flow is (approximately) inside the corotation radius (Muzerolle et al. 2004). For HD104237 we find , using Donati et al. (1997) and an inclination of (Grady et al. 2004). Note that this value is, at our spatial resolution level, similar to the separation of the binary. Adopting and as the inner and outer limits of the magnetospheric accreting region, Fig. 2 (upper panel) demonstrates that emission is then confined much closer to the star than the dusty rim. The predicted visibility therefore increases significantly in the line, contrary to the observational result. Explaining the observed visibility with magnetospheric accretion requires the corotation radius to approach the inner rim, which would need an unrealistically lower stellar rotational velocity (). The magnetic field of HD104237 is weak, (Donati et al. 1997), and the corresponding magnetospheric truncation radius (, Shu et al. (1994)) is smaller than the corotation radius. Replacing by as the outer radius of the magnetospheric accreting region would thus only reinforce our conclusion. Magnetospheric accretion therefore cannot be responsible for most of the emission.
Gas in the disk: since HD104237 accretes matter (a few , Grady et al. 2004, Garcia Lopez et al. 2006), an optically thin gaseous disk (Muzerolle et al. 2004) must extend inward from the dust evaporation rim to either the magnetospheric truncation radius or the corotation radius; this disk region is ionised and may, in principle, emit the observed line. To model this scenario, we assume a constant surface brightness between (or ) and . The resulting visibilities (Fig. 2, middle panel) are also inconsistent with the observations, though not quite as severely.
Outflowing wind: the remaining possibility is that is emitted in a wind or jet. The bulk of the emission is then confined to the regions of highest gas density, i.e., to the base of the wind/jet. Since the wind/jet must be seen almost pole-on, we assume in our toy model that emission is confined to a ring of width , with , where is the ring inner radius, that is the wind launching point. This assumption is guided by the wind models of Natta et al. (1988), and by the more recent simulations of the emission in jets of T Tauri stars (Thiébaut et al. 2003). For pole-on outflows most of the intensity originates in a ring with these approximate properties. Fixing and adjusting , this toy model reproduces the interferometric data for between and (Fig. 2, bottom panel). Allowing different relative widths ( from to of ), we find that the emission has to originate between and AU. Our interferometric measurements are therefore consistent with the emission coming from the base of a wind, originating in a disk region close to the location of the dusty rim. The presence of a wind in HD104237 is well established on (much) larger scales, by the bipolar microjet (Grady et al. 2004) and by the P-Cygni profile of the line (Feigelson et al. 2003). Given our oversimplified geometrical models, it would be inappropriate to speculate too much on the detailed nature of the wind. We note however that the launching region of an X-wind, driven by the stellar magnetic field (Shu et al. 1994), is close to the corotation radius and too small to be consistent with the present data. Making the X-wind acceptable needs relaxing the assumption that most of the line emission originates near the launching point, and instead having the brightest region a factor further away from the star. The disk-wind scenario by contrast has its launching point a few tenths of AU from the star and needs no tweaking. This preference for a disk-wind is consistent with the size of jet launching regions inferred from the rotation of TTauri jets (Coffey et al. 2004).
It is important to recall here that our analysis assumes that the continuum originates in a dusty “puffed-up” ring. That model has been shown to match Herbig Ae and T Tauri stars over a large luminosity range (Monnier et al. 2005), but it obviously needs to be verified for the specific case of HD104237, by obtaining calibrated interferometric observations over a few baselines.
4 Conclusions
We have presented interferometric observations of the Herbig Ae star HD104237, obtained with the AMBER/VLTI instrument with high spectral resolution. The visibility is identical in the line and in the continuum, even though the line represents of the total flux. This immediately implies that the line and continuum emission regions have the same apparent size.
Scaling the continuum visibility with a “puffed-up” inner rim model, and using simple toy models to describe the emission, we have shown that the line emission is unlikely to originate in either magnetospheric accreting columns of gas or in the gaseous disk. It is much more likely to come from a compact outflowing disk wind launched in the vicinity of the rim, about 0.5 AU from the star. This does not preclude accretion from nonetheless occuring along the stellar magnetic field detected by Donati et al. (1997), and accreting matter might even dominate the optical hydrogen line emission, but our observations show that the bulk of the emission in HD104237 is unlikely to originate in magnetospheric accreting matter.
Our results show that AMBER/VLTI is a powerful diagnostic of the origin of the line emission in young stellar objects. Observations of a consistent sample of objects will strongly constrain the wind launching mechanism.
Acknowledgements.
This work has been partly supported by the MIUR COFIN grant 2003/027003-001 and 025227/2004 to the INAF-Osservatorio Astrofisico di Arcetri. This project has benefited from funding from the French Centre National de la Recherche Scientifique (CNRS) through the Institut National des Sciences de l’Univers (INSU) and its Programmes Nationaux (ASHRA, PNPS). The authors from the French laboratories would like to thank the successive directors of the INSU/CNRS directors. C. Gil work was supported in part by the Fundação para a Ciência e a Tecnologia through project POCTI/CTE-AST/55691/2004 from POCTI,with funds from the European program FEDER. This work is based on observations made with the European Southern Observatory telescopes. This research has also made use of the ASPRO observation preparation tool from the Jean-Marie Mariotti Center in France, the SIMBAD database at CDS, Strasbourg (France) and the Smithsonian/NASA Astrophysics Data System (ADS). The data reduction software amdlib is freely available on the AMBER site http://amber.obs.ujf-grenoble.fr. It has been linked with the free software Yorick222ftp://ftp-icf.llnl.gov/pub/Yorick to provide the user friendly interface ammyorick.References
- Böhm et al. (2004) Böhm, T., Catala, C., Balona, L., & Carter, B. 2004, A&A, 427, 907
- Casse & Ferreira (2000) Casse, F., & Ferreira, J. 2000, A&A, 353, 1115
- Coffey et al. (2004) Coffey, D., Bacciotti, F., Woitas, J., Ray, T. P., & Eislöffel, J. 2004, ApJ, 604, 758
- Donati et al. (1997) Donati, J.-F., Semel, M., Carter, B. D., Rees, D. E., & Collier Cameron, A. 1997, MNRAS, 291, 658
- Eisner et al. (2005) Eisner, J. A., Hillenbrand, L. A., White, R. J., Akeson, R. L., & Sargent, A. I. 2005, ApJ, 623, 952
- Feigelson et al. (2003) Feigelson, E. D., Lawson, W. A., & Garmire, G. P. 2003, ApJ, 599, 1207
- Garcia Lopez et al. (2006) Garcia Lopez, R., Natta, A., Testi. L., Habart. E., 2006, å, submitted
- Grady et al. (2004) Grady, C. A., et al. 2004, ApJ, 608, 809
- Hartmann et al. (1994) Hartmann, L., Hewett, R., & Calvet, N. 1994, ApJ, 426, 669
- Isella & Natta (2005) Isella, A., & Natta, A. 2005, A&A, 438, 899
- Isella et al. (2006) Isella, A., Testi, L., & Natta, A. 2006, to appear in A&A, (astro-ph/0601438)
- Malbet et al. (2006) Malbet, F., et al. 2006, to appear in A&A, (astro-ph/0510350)
- Malfait et al. (1998) Malfait, K., Bogaert, E., & Waelkens, C. 1998, A&A, 331, 211
- Meeus et al. (2001) Meeus, G., Waters, L. B. F. M., Bouwman, J., van den Ancker, M. E., Waelkens, C., & Malfait, K. 2001, A&A, 365, 476
- Monnier et al. (2005) Monnier, J. D., et al. 2005, ApJ, 624, 832
- Muzerolle et al. (2004) Muzerolle, J., D’Alessio, P., Calvet, N., & Hartmann, L. 2004, ApJ, 617, 406
- Natta et al. (1988) Natta, A., Giovanardi, C., & Palla, F. 1988, ApJ, 332, 921
- Petrov et al. (2003) Petrov, R. G., et al. 2003, SPIE, 4838, 924
- Shu et al. (1994) Shu, F., Najita, J., Ostriker, E., Wilkin, F., Ruden, S., & Lizano, S. 1994, ApJ, 429, 781
- Tatulli et al. (2006) Tatulli, E., et al. 2006, to appear in A&A, (astro-ph/0602346)
- Thiébaut et al. (2003) Thiébaut, E., Garcia, P. J. V., & Foy, R. 2003, Ap&SS, 286, 171
- Tambovtseva et al. (1999) Tambovtseva L.V., Grinin V.P. & Kozlova O.V. 1999, Astrophysics, 42
- van den Ancker et al. (1998) van den Ancker, M. E., de Winter, D., & Tjin A Djie, H. R. E. 1998, A&A, 330, 145