GALEX and Optical Light Curves of EF Eridanus During a Low State: the Puzzling Source of UV Light
Abstract
Low state optical photometry of EF Eri during an extended low accretion state combined with GALEX near and far UV time-resolved photometry reveals a source of UV flux that is much larger than the underlying 9500K white dwarf, and that is highly modulated on the orbital period. The near UV and optical light curves can be modeled with a 20,000K spot but no spot model can explain both the large amplitude FUV variations and the SED. The limitations of limb darkening, cyclotron and magnetic white dwarf models in explaining the observations are discussed.
1 Introduction
Accreting close binaries containing white dwarfs with high (10-200 MG) magnetic fields are termed AM Herculis variables or simply polars (review in Wickramasinghe & Ferrario 2000). They tend to have lower mass transfer rates than disk accreting systems of similar orbital period and spend perhaps the majority of their time (Ramsay et al. 2004) in states where the mass transfer can drop by orders of magnitude or stop completely (termed low states). During these times, most of the effects associated with active accretion (X-rays, strong optical cyclotron continuum, strong He and Balmer emission lines) disappear. This provides the opportunity to directly view and study the underlying stars (white dwarf and late type secondary). The polar cataclysmic variable EF Eri received notoriety as it remained in one of these inactive states for 9 years, starting in 1997 (Wheatley & Ramsay 1998; WR98) and only becoming active again at the beginning of 2006. In the high state, EF Eri is 14th mag and shows a highly variable light curve over the 81 min orbital period (Bailey et al. 1982). In the infrared, the J light curve revealed a narrow dip which Bailey et al. used to define phase 0.0. At this phase, the light curves showed a broad minimum, the X-ray had a sharp minimum and circular polarization was a maximum. These features were interpreted as an eclipse of the accretion column by the accretion stream at phase 0. Cyclotron humps led to estimates of 16.5 and 21 MG for two cyclotron regions.
When EF Eri entered its prolonged low state in 1997, the V mag dropped to 18, broad Balmer absorption lines from the white dwarf were apparent, and Zeeman splitting indicated a magnetic field of 14 MG (WR98). While Euchner et al. (2003) fit multipole models (5 components with fields up to 100MG) to spectra obtained in 2000, the fit was not definitive. WR98 concluded the similarity of the low state field to that measured in the small accretion regions during the high state indicated either a uniform field strength over the white dwarf, or continued accretion heated spots. Beuermann et al. (2000) modeled the optical spectrum with a 9500K white dwarf with a 15,000K hot spot covering 6% of the surface. photometry obtained by Harrison et al. (2003; H03) in 2001, showed sinusoidal light curves with a peak near phase 0.9 and a minimum near phase 0.4. They modeled the light curves with a 12,000K spot covering 6% of the area of a 9500K white dwarf, with a best fit obtained for an inclination of 35∘ and an angle of 35∘ between the spin and magnetic pole. The and light curves were anti-phased from the optical, with a peak near phase 0.5 and a minimum near phase 0. IR spectra obtained in 2002 (Harrison et al. 2004; H04) showed different cyclotron harmonics were present at phase 0 than at phase 0.5, indicating that cyclotron emission was still present from both accretion poles.
Given that the optical spectrum of EF Eri at the low state shows no obvious sign of an accretion stream, it is intriguing that a hot spot model still fits the optical light curves and cyclotron is still present in the IR. During a study of polars at low states, Araujo-Betancar (2005) found that 30,000-70,000K hot spots contributing 20-30% of the white dwarf flux were needed to model the FUV fluxes. To further explore the heating effects at extremely low accretion rates, we obtained UV light curves with GALEX. Our results show the value of GALEX time-resolved photometry in providing information confirming that some area of the white dwarf contributes a large amount of UV flux even after 7 years of extremely low mass transfer.
2 Observations
GALEX observations were first obtained on 2004 November 8 during 10 contiguous satellite orbits from 04:32:38 to 19:47:50 UT. The GALEX satellite (Martin et al. 2005) uses a dichroic to split the UV light into a FUV detector (1350-1750Å) and a NUV detector (1750-2800Å). The field of view is 1.25∘ with 5 arcsec resolution in the FUV and 6.5 arcsec in the NUV. During this observation, elevated solar proton levels resulted in the FUV detector being switched off, so only data in the NUV were obtained. The observation was rescheduled and the full 10 orbits with both detectors were accomplished on 2004 December 7 from 03:46:02 to 18:59:40 UT.
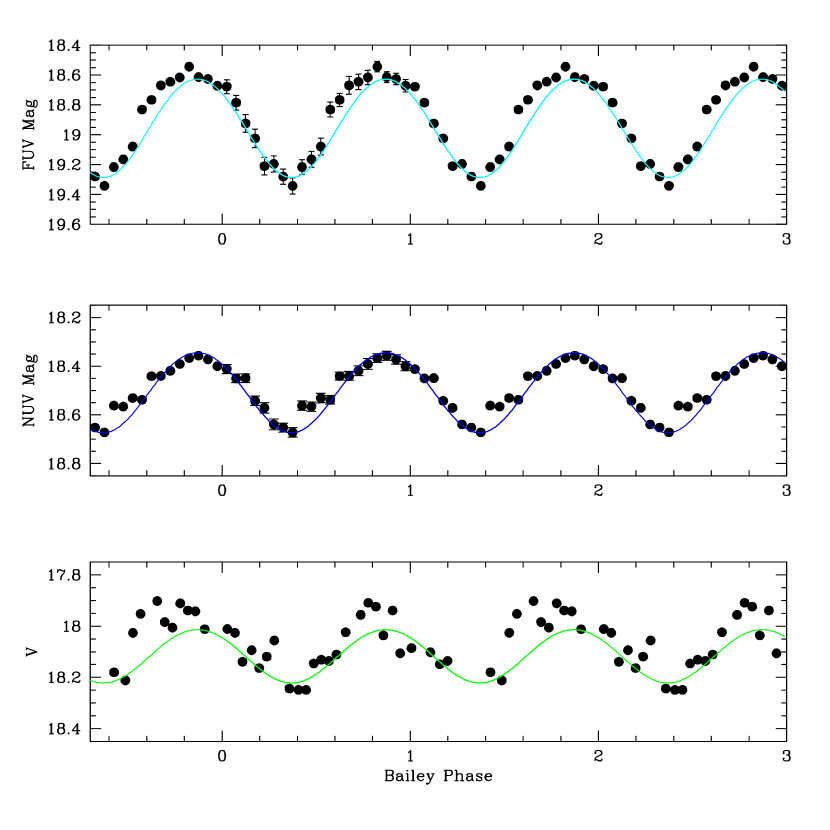
While the standard GALEX data pipeline converts time-tagged photons into a final calibrated image for each observation, the production of light curves required the generation of calibrated images in 120s intervals111Produced by the GALEX Software Operations and Data Analysis team., which were then phased according to the ephemeris of Bailey et al. (1982). The IRAF222IRAF (Image Reduction and Analysis Facility) is distributed by the National Optical Astronomy Observatories, which are operated by AURA, Inc., under cooperative agreement with the National Science Foundation. routine qphot was then used to obtain a magnitude for the photons inside a 9 pixel aperture at the source position. The background was measured in an annulus of width 3 pixels around the aperture. The conversions from cps to magnitude to flux were accomplished using the values from the GALEX online documentation333 http://galexgi.gsfc.nasa.gov/tools/index.html where FUV m0=18.82=1.4010-15 ergs cm2 s Å-1 and NUV m0=20.08=2.0610-16 ergs cm2 s Å-1. To insure that the optical light curve had not changed from 2001 December (H03), further photometry was obtained on 2005 September 16. As in 2001, the New Mexico State University 1.0 m telescope was used with a CCD and Johnson-Cousins V filter. A differential light curve was obtained with respect to nearby stars on the same frames and Landolt standards were used to calibrate the reference stars. The combined GALEX and V light curves are shown in Figure 1.
3 Light Curve Modeling with a Hot Spot
As shown in Figure 1, the FUV, NUV, and light curves show sinusoidal-like variations that appear to have similar phasing to each other and to the light curves of H03. The symmetrical nature and width of the variation implies large and symmetrical regions of emission. As with the optical light curves of H03, they are all anti-phased to the low state and -band light curves shown in H04 (the -band light curve is more complex). The amplitude of the variations in the optical are 0.2 mag peak-to-peak, while the UV and IR variations have considerably larger amplitudes (up to 0.8 mag in FUV and ). The time-resolved IR spectra of H04 confirmed that the and -band variations were due to cyclotron emission.
H03 showed the optical variations can be easily modeled using a simple hot spot on a 9500 K white dwarf. They used the light curve modeling program WD98 (Wilson 1998) to confirm that such a model could explain both their light curves and the optical spectral energy distribution (SED). Presumably, this hot spot would be located near one of the magnetic poles, and represent the heating induced by continued accretion whose presence is clearly demonstrated by the strong cyclotron emission observed during this low state.
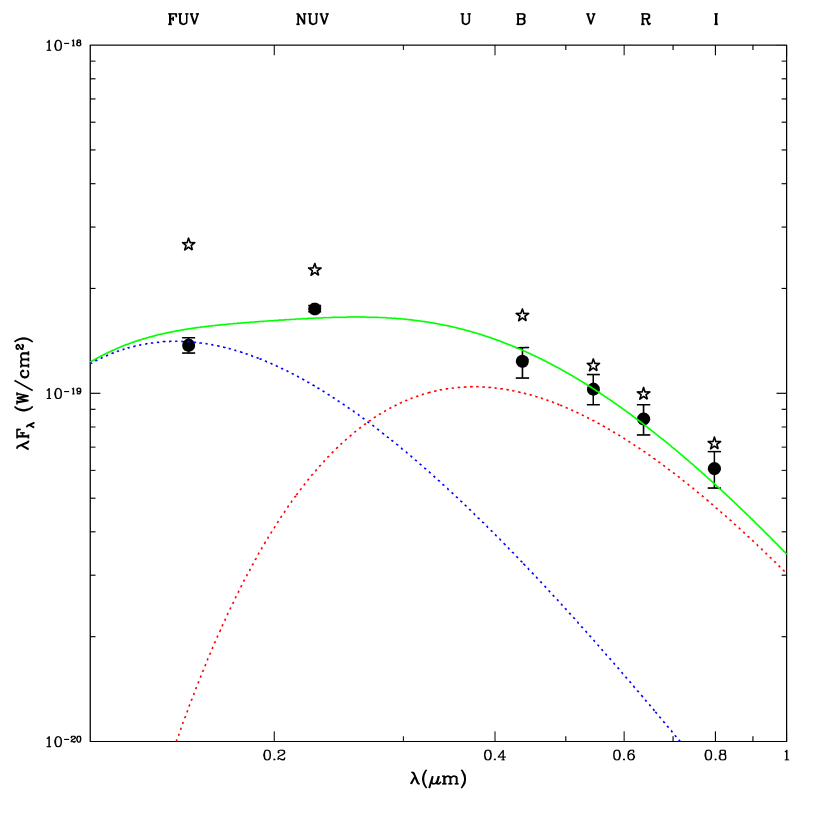
Given their identical phasing, we attempted to use the same hot spot model to explain the GALEX light curves of EF Eri. However, it soon became apparent that a 14,000 K hot spot on a 9,500 K white dwarf does not provide sufficient ultraviolet flux at short wavelengths to simultaneously explain the observed NUV and FUV fluxes. To achieve a reasonable fit to the observed FUV/optical SED requires that the hot spot have a temperature of T 20,000 K. Figure 2 shows the spectral energy distributions (SEDs) for the GALEX and optical data for minima (phase 0.4; filled dots) and maxima (phase 0.9; stars) light (the values used are listed in Table 1). The fit to the minimum SED (green line) is for a 9800K white dwarf (red dotted line) that contributes 78% of the V flux, with the rest from a 22,000K hot spot (blue dotted line). It is obvious that to account for the light curve maxima will require a larger contribution of a component near 20,000K.
With this insight, we constructed a large number of models using WD2005444WD2005 is an updated version of WD98, and can be obtained at this website maintained by J. Kallrath: http://josef-kallrath.orlando.co.nz/HOMEPAGE/wd2002.htm with differing spot sizes, orbital inclinations and spot latitudes. For our trial runs, none of our models included limb darkening. Our initial models had a single spot temperature. Given the large number of adjustable parameters, it was easy to generate a model that could fit the and NUV light curves. Figure 3 shows a model for an inclination of 45∘ and a 20,000K spot with a radius of 60∘ located 10∘ from the spin pole. However, no single temperature spot model could explain the large amplitude of the FUV light curve–even unrealistic models where one entire hemisphere was at 20,000 K, and those types of models could not simultaneously explain the UV/optical SED.
The difficulty with the single temperature spot models is that they must supply both an enormous FUV flux produce 1 magnitude variations. For example, a 9500 K white dwarf normalized to the -band flux, only supplies about 4% of the observed FUV flux. Thus, this 20,000K spot must provide the remaining flux in the FUV at all orbital phases, and somehow be highly variable. We thus explored more complicated models, ones in which the temperature of the “core” of this spot was very high (Teff = 100,000 K), which had cooler, off-centered annuli surrounding it that smoothly dropped off in temperature with radius until they reached the observed photospheric temperature of the white dwarf. Even these models were unable to produce both the large amplitude FUV variations and the observed SED.
One set of spot models that could reproduce the observed light curve variations was models with extreme FUV limb darkening. Using a 20,000 K spot, models with extreme limb darkening in the FUV (i.e. a coefficient of 2.0, a factor of 2 over normal values for hot stars), while the NUV and V-band limb darkening coeffients had normal values of 0.5 and 0.3 (Al-Naimiy 1987, Wade & Rucinski 1985) could produce large amplitude variations. Figure 4 shows this type of model fit to the GALEX and V data. While we cannot fully rule out such models, such an abrupt change in limb darkening laws between the FUV and NUV bandpasses is unlikely, especially given the expectation of few large spectral line features in the GALEX bandpasses. It is interesting to note that Diaz et al. (1996) found quite large limb darkening effects for accretion disks in the UV, depending on the line-of-sight inclination angle of the disk. A tilted, flat surface like an accretion disk has larger limb darkening than a spherically symmetric star since the emergent flux from a spherical object is averaged over all angles. Thus, it does not seem impossible to envision a larger FUV limb darkening for a relatively small, isolated spot. If one were to add some vertical extent to this spot, its limb darkening could be quite large. But, no matter what limb darkening is used, such a spot/region needs to have a spectrum that preferentially produces FUV emission.
4 Discussion
While it is now evident that a source of far UV photons remains on the white dwarf during extremely low states of accretion, the nature of this component is not clear. Gänsicke et al. (2006) were able to successfully fit far UV (FUSE) and near UV (STIS) light curves of AM Her during a low state using a hot spot of 34,000-40,000K on a 20,000K white dwarf. In comparison to EF Eri, their bandpass closest to our GALEX FUV one shows amplitudes that are about half those for EF Eri and the hotter white dwarf and spot can account for the peak amplitudes and fluxes near 1100Å. However, they did not see any change in temperature of the hot spot in AM Her over the course of several months, and puzzled over the possible sources of heating such as low ongoing accretion during the low state or deep heating of the pole cap area during times of high accretion.
For EF Eri, the results of H04 and the shapes of the light curves offer some clues to other possibilities. The IR cyclotron features at the low state indicate two poles with different magnetic fields (if other poles are present, they are weak compared to these). The opposite behavior of J vs H and K indicates J has a cyclotron feature that is likely from a different accreting pole during the high state (evident at photometric phase 0), whereas the low state shows cyclotron from the pole evident near phase 0.5. It is interesting that both the GALEX and V data (Figure 1) show a disturbance in the light curves near phase 0.5, that could indicate cyclotron is somehow playing a role in the UV. The J band light curve at the low state also shows a slight peak at this phase. For field strengths such as present in EF Eri, the cyclotron harmonics are usually optically thick in the IR and optically thin in the optical and UV. The thin harmonics would be best seen perpendicular to the magnetic field, thus explaining the offset in phase from the opt/UV to the IR, if cyclotron was responsible.
The optical light curves of the Low Accretion Rate Polars (LARPS) show very similar sinusoidal variability (Szkody et al. 2003) that can be explained by the presence of cyclotron harmonics in the bandpass of observation. Thus, if there were a cyclotron component in the UV, it could account for the extra UV light. However, for the field strengths listed, it would be difficult to get a component only in the UV that is not present in the optical. Schwope, Schreiber & Szkody (2006) have proposed cyclotron components in the UV to explain the discrepancy between the SED and model WD in the polar RXJ1554.2+2721. That system has a field strength of 110 MG and shows noticeable cyclotron humps in the optical. While Euchner et al. (2003) proposed multipoles up to these field strengths for EF Eri, their spectra showed no visible cyclotron humps. However, a recent Keck spectrum taken in 2006 January, as EF Eri was emerging from its long low state (Howell et al. 2006), shows possible harmonics near 9300Å and 4700Å which are consistent with a 115 MG field.
Schmidt et al. (2005) point out the discrepancy in LARPS between the higher observed blue flux compared to white dwarf models that fit the longer wavelengths. This same discrpancy was also shown in modeling the UV flux of the highest field polar AR UMa (Gänsicke et al. 2001) and ascribed to the lack of known correct models for high magnetic field white dwarfs. Thus, it is possible that the discrepancy could go away if realistic models show a steeper flux distribution for the white dwarf areas near the magnetic poles. Modeling also suffers from correct treatment of the irradiated atmospheres of white dwarfs. König, Beuermann & Gänsicke (2006) have recently explored the atmosphere around a polar cap irradiated by bremsstrahlung and cyclotron flux. For low magnetic field systems,they find the irradiated areas will be large and the reprocessed energy will be in the FUV. While their models are for higher accretion rates than in systems like EF Eri and LARPS, and they point out that a much larger effort will be required to model the lowest accretors correctly, it is a step in the right direction.
Whether the extra UV flux is due to hot spots, cylotron harmonics or incorrect UV models for high field white dwarfs remains to be determined.
5 Conclusions
Our results show that GALEX time-resolved photometry is a very useful means of studying the hot components in close binaries. Our near and far UV light curves obtained during the extended low accretion state of EF Eri reveal the presence of a symmetrical, large and highly variable source of UV light. If this is a hot spot on the 9500K white dwarf, this spot must have a temperature 20,000K to fit the SED. However, the amplitude of the FUV variation is far too large to be fit with a spot of this type, unless large limb darkening is invoked just for the FUV. Since the UV light curves are in phase with the optical, and opposite in phase from IR variations that are known to originate from cyclotron harmonics, it is natural to invoke changing optical depth of harmonics from optically thick in the IR to optically thin in the optical/UV. If there was a harmonic present in the far UV band, it could explain the excess FUV flux and amplitude, but this would require extremely high fields and harmonics should be visible in the optical as well. It is intriguing that small deviations in the UV and optical light curves match the phases of peak IR flux and that the excess UV luminosity over that of the 9500K white dwarf is comparable to the cyclotron luminosity in the IR. However, the lack of good models for cyclotron effects on the spectrum of a white dwarf prevents us from reaching any definite conclusion. Until we can correctly model the observed excess UV flux in the cases of high magnetic field white dwarfs, we cannot ascertain its cause as a hot spot or cyclotron emission or atmospheric effects due to high fields and low accretion.
References
- (1)
- (2) Al-Naimiy, H. M. 1978, Ap&SS, 53, 181
- (3)
- (4) Araujo-Betancor, S., Gänsicke, B. T., Long, K. S., Beuermann, K., de Martino, D., Sion, E. M. & Szkody, P. 2005, ApJ, 622, 589
- (5)
- (6) Bailey, J., Hough, J. H., Axon, D. J., Gatley, I., Lee, T. J., Szkody, P., Stokes, G. & Berriman, G. 1982, MNRAS, 199, 801
- (7)
- (8) Beuermann, K., Wheatley, P., Ramsay, G., Euchner, F. & Gänsicke, B. T. 2000, A&A, 354, L49
- (9)
- (10) Diaz, M. P., Wade, R. A., & Hubeny, I. 1996, ApJ, 459, 236
- (11)
- (12) Euchner, F., Beuermann, K., Reinsch, K. & Jordan, S. 2003, in White Dwarfs, eds. D. de Martino, R. Silvotti, J. E. Solheim & R. Kalytis, Kluwer, 195
- (13)
- (14) Gänsicke, B. T., Schmidt, G. D., Jordan, S., & Szkody, P. 2001, ApJ, 555, 380
- (15)
- (16) Gänsicke, B. T., Long, K. S., Barstow, M. A. & Hubeny, I. 2006, ApJ, in press
- (17)
- (18) Harrison, T. E., Howell, S. B., Huber, M. E., Osborne, H. L., Holtzman, J. A., Cash, J. L. & Gelino, D. M. 2003, AJ, 125, 2609 (H03)
- (19)
- (20) Harrison, T. E., Howell, S. B., Szkody, P., Homeier, D., Johnson, J. J. & Osborne, H. L. 2004 , ApJ, 614, 947 (H04)
- (21)
- (22) Howell, S. B., Walter, F., Harrison, T. E., Huber, M. E., Becker, R. H. & White, R. L. 2006, ApJ, submitted.
- (23)
- (24) König, M., Beuermann, K., & Gänsicke, B. T. 2006, A&A, in press
- (25)
- (26) Martin, D. C. et al. 2005, ApJ, 619, L1
- (27)
- (28) Ramsay, G., Cropper, M., Wu, K., Mason, K. O., Cordova, F. A. & Priedhorsky, W. 2004, MNRAS, 350, 1373
- (29)
- (30) Schmidt, G. D. et al. 2005, ApJ, 630, 1037
- (31)
- (32) Schwope, A. D., Schreiber, M. R. & Szkody, P. 2006, A&A, in press
- (33)
- (34) Szkody, P. et al. 2003, ApJ, 583, 902
- (35)
- (36) Wade, R. A. & Rucinski, S. M. 1985, A&AS, 60, 471
- (37)
- (38) Wheatley, P. J. & Ramsay, G. 1998, in ASP Conf. Ser. 137, Wild Stars in the Old West, ed. S. Howell, E. Kuulkers, & C. Woodward (San FranciscoLASP), 446 (WR98)
- (39)
- (40) Wickramasinghe, D. T. & Ferrario, L. 2000, PASP, 112, 873
- (41)
- (42) Wilson, R. E. 1998, Reference Manual to the Wilson-Devinney Program, Computing Binary Star Observables, Version 1998 (Gainsville; Univ. Florida)
- (43)
| Wavelength(Å) | Phase 0.9 | Phase 0.4 |
|---|---|---|
| 1528 | 18.58 | 19.30 |
| 2271 | 18.37 | 18.70 |
| 4360 | 18.04 | 18.37 |
| 5450 | 18.04 | 18.21 |
| 6380 | 17.90 | 18.08 |
| 7970 | 17.76 | 17.94 |