Extreme gas kinematics in the z=2.2 powerful radio galaxy MRC1138-262: Evidence for efficient AGN feedback in the early Universe?11affiliation: Based on observations collected at the European Southern Observatory, Very Large Telescope Array, Cerro Paranal; program numbers, 70.B-0545, 70.A-0229, & 076.A-0684
Abstract
To explain the properties of the most massive low-redshift galaxies and the shape of their mass function, recent models of galaxy evolution include strong AGN feedback to complement starburst-driven feedback in massive galaxies. Using the near-infrared integral-field spectrograph SPIFFI on the VLT, we searched for direct evidence for such a feedback in the optical emission line gas around the z2.16 powerful radio galaxy MRC1138-262, likely a massive galaxy in formation. The kpc-scale kinematics, with FWHMs and relative velocities km s-1 and nearly spherical spatial distribution, do not resemble large-scale gravitational motion or starburst-driven winds. Order-of-magnitude timescale and energy arguments favor the AGN as the only plausible candidate to accelerate the gas, with a total energy injection of ergs or more, necessary to power the outflow, and relatively efficient coupling between radio jet and ISM. Observed outflow properties are in gross agreement with the models, and suggest that AGN winds might have a similar, or perhaps larger, cosmological significance than starburst-driven winds, if MRC1138-262 is indeed archetypal. Moreover, the outflow has the potential to remove significant gas fractions (%) from a galaxy within a few 10 to 100 Myrs, fast enough to preserve the observed [/Fe] overabundance in massive galaxies at low redshift. Using simple arguments, it appears that feedback like that observed in MRC1138-262 may have sufficient energy to inhibit material from infalling into the dark matter halo and thus regulate galaxy growth as required in some recent models of hierarchical structure formation.
1 Introduction
Models of structure formation and galaxy evolution have reached a state where the impact of large-scale baryonic feedback on galaxy evolution can no longer be neglected. However, the physics of such processes are complex, and as yet not very well understood, especially at high redshift, where the most massive galaxies formed most of their stars. Therefore, simulations of the ensemble of galaxies typically incorporate these processes, which originate on scales beyond the resolution of typical large scale simulations, as simple relationships and parameterizations, which are in turn tuned to approximately match observed galaxy properties. In spite of these limitations, baryonic feedback plays a crucial role for our understanding of galaxy evolution, perhaps most dramatically at high redshift (e.g., Croton et al., 2006)
The impact of feedback related to intense star-formation is now observationally well-established at low and high redshift (e.g., Heckman, 2003; Lehnert & Heckman, 1996a), and simulations improved considerably when including it. But significant and likely fundamental discrepancies remain, e.g., when comparing the observed mass function of galaxies with the predicted mass function of dark matter halos at the upper end of the mass function (Benson et al., 2003). From low-redshift studies, starburst-driven “superwinds” are known to be efficient in driving out gas only from the comparably shallow gravitational potentials of low mass galaxies (e.g., Martin, 1999; Lehnert, Heckman, & Weaver, 1999; Heckman et al., 2000). However, these winds are mainly energy driven, therefore susceptible to radiative losses, and they probably lack the power, efficiency, and velocities necessary to remove significant gas fractions from the deep potential wells of the most massive galaxies and their dark-matter halos. As a consequence, they cannot explain the overabundance particularly of massive dark-matter halos compared to the co-moving galaxy density.
Therefore another powerful feedback mechanism is recently gaining in popularity among researchers modeling and simulating the ensemble properties of galaxies, which are vigorous outflows driven by powerful active galactic nuclei at high redshift (AGN; e.g., Silk & Rees, 1998; Springel et al., 2005). Energy- and momentum-driven AGN winds may reach very high energy output through radiation pressure and particle ejection. The most powerful AGN may eject enough energy and momentum to unbind significant fractions of the total interstellar medium (ISM) of the host galaxy. As they slow and expand, such winds are able to efficiently heat gas in the inter-cluster medium (ICM) and even the intergalactic medium (IGM; e.g., Nath & Roychowdhury, 2002). However, due to the clumpy nature of the ISM in galaxies, rather small working surface of the jet, and AGN producing “light jets”, they are not generally thought to couple strongly with the ambient ISM in their hosts (Begelman & Cioffi, 1989).
The observed characteristics of massive galaxies support the hypothesis that strong AGN winds at high redshift may have a significant impact on galaxy evolution and their ensemble characteristics. Spheroidal and black hole masses in nearby massive systems follow the tight MBH- relation (Ferrarese, 2002; Tremaine et al., 2002), which perhaps signals co-eval growth of SMBH and the bulge self-regulated through negative AGN feedback (Silk & Rees, 1998). The most massive galaxies, virtually all spheroidals, are “old, red, and dead”. They are metal-rich and have luminosity weighted ages consistent with massive star-formation at high-redshift and subsequent passive evolution, perhaps indicating that the gas was effectively removed during the most massive burst (e.g., Thomas, Greggio, & Bender, 1999; Thomas et al., 2005; Romano et al., 2002). Maybe the tightest constraint comes from the metal abundance ratios, especially , which indicate intense star-formation truncated by strong feedback within less than few yrs (e.g., Thomas, Greggio, & Bender, 1999). In addition, the exponential cut-off in the bright end of the galaxy luminosity function may be a direct result of the efficiency of AGN feedback (Croton et al., 2006). Furthermore, Best et al. (2005) find evidence that more moderate feedback of radio-loud AGN might balance gas cooling in the halos of the most massive galaxies at low redshift.
A promising way to identify the fingerprints of a highly efficient mode of AGN feedback at high redshift is by observing the gas kinematics in rapidly growing, massive galaxies at high redshift which host AGN. Powerful high-z Radio Galaxies (HzRGs) fit these requirements: They reside in dense environments (Venemans et al., 2002; Kurk et al., 2004; Best et al., 2003; Stevens et al., 2003). Their magnitudes, colors, and continuum morphologies are consistent with large stellar masses and passive evolution at (van Breugel et al., 1998; Best, Longair, & Röttgering, 1998). HzRGs at also contain large masses of molecular gas ( M⊙; e.g., Röttgering et al., 1997), dust ( M⊙; e.g., Archibald et al., 2001; Reuland et al., 2004), and UV/optical line-emitting gas ( M⊙; e.g., van Oijk et al., 1997). At the highest redshifts, they are also likely to be forming stars at prodigious rates ( M⊙ yr-1; e.g., Dey et al., 1997). Curiously, HzRGs are known from longslit-spectroscopy to often have spatially extended broad emission lines with FWHM km s-1, indicative of extreme kinematics (e.g., McCarthy et al., 1996; Tadhunter, 1991; Villar-Martín et al., 1999). However, with the slits typically aligned along the radio axis, the global role of these kinematics could not be examined more closely, highlighting the need for integral-field observations of HzRGs, preferably at rest-frame optical wavelengths (i.e., in the observed near-infrared) to investigate the overall gas dynamics.
An excellent candidate for such a study is the MRC1138-262, with and stellar mass M⊙. VLA interferometry reveals 2 radio jets with complex morphologies (Carilli et al., 2002). Its nebulosity extends over kpc radius111Using a flat km s-1, , cosmololgy, size scales at are 8.3 kpc arcsec-1, the luminosity distance is 17070 Mpc, the angular size distance is 1710 Mpc. Cosmic age at that redshift is 3.0 Gyrs., and has a significant surrounding over-density of H emitters which indicates it might be in the center of a forming galaxy cluster (Kurk et al., 2004). Rest-frame UV spectroscopy implies star-formation rates of M⊙ yr-1. By examining the spatially-resolved kinematics and spectral properties of the rest-frame optical emission line gas in MRC1138-262, we wish to investigate the influence of the AGN on the excitation and kinematics of the emission line gas using data obtained with the near-infrared integral-field spectrograph SPIFFI.
2 Observations and Data Reduction
We observed MRC1138-262 in the near-infrared H and K bands using the integral-field spectrograph SPIFFI on UT1 of the VLT in April 2003. SPIFFI uses an image slicer to dissect the 8″8″ field of view on the sky into 32 slices or “slitlets” with individual pixel sizes in projection of 0.25″. The spectrograph and image slicer have since become a facility instrument at UT4 as part of SINFONI. Under good and stable weather conditions, we obtained a total of 140 min of data in K and 75 min in H with a pixel scale of 0.25″ and seeing of . Individual exposure times were 300s in H and 600s in K, respectively. Spectral resolution is R= at 1.6 m and R= at 2.2 m. One “off” frame at a sky position well displaced from the target was taken for each “on” frame in an off-on-on-off pattern.
To reduce the data, we used the IRAF (Tody, 1993) standard tools for the reduction of longslit-spectra, modified to meet the special requirements of integral-field spectroscopy. Data are dark frame subtracted and flat-fielded. For bad pixel correction we use the full three-dimensional information, identifying pixels that are 5 deviant in the darks and flats. Rectification and wavelength calibration are done before night sky subtraction, to account for some spectral flexure between the frames. Curvature is measured and removed using an arc lamp, before shifting the spectra to an absolute (vacuum) wavelength scale with reference to the OH lines in the data.
The three-dimensional data cubes are then reconstructed, assuming that each slitlet covers exactly 32 pixels. They are spatially aligned by cross-correlating the collapsed cubes, and then combined, clipping deviant pixels. Telluric correcton is applied to the combined cube. Flux scales are obtained from standard star observations. From the light profile of the standard star, we measure the FWHM spatial resolution to be in right ascension and declination, respectively.
3 Integrated Spectra and Broad Line Emission
In Fig. 1 we show H and K-band spectra of MRC1138-262. The upper panel shows the spectrum of the spatial pixel covering the AGN, the lower panel shows the AGN removed extended emission integrated over the central 30 kpc. Line profiles are not simple Gaussians, but have irregular profiles indicating complex kinematics in the extended emission line gas. The lines are generally broad, and [NII]6583 and H are blended, so that H is not a reliable kinematic tracer. Therefore we use [OIII]5007 (with FWHM km s-1 in the integrated spectrum) to trace the gas kinematics. We discuss below that the emission line kinematics does not vary strongly with the specific emission line analyzed (§ 4.2), within the accuracy we can reach given the line blending. Thus we do not expect and there is no evidence that this choice has a strong impact on our overall conclusions.

The luminous broad H emission line is the most prominent spectral feature in the AGN spectra, with FWHM km s-1, and a rest-frame equivalent width, EQWÅ, indicating that the emission from the broad line region cannot be neglected (especially in the broad band near infrared magnitudes). Previous rest-frame UV spectroscopy of MRC1138-262 did not reveal nuclear broad lines, indicating that MRC1138-262 might harbor an obscured quasar, similar to MRC2025-218 (Larkin et al., 2000). Broad H emission in the H band is measured at much fainter flux: From the Balmer decrement in the broad components, , using a galactic extinction law and . The galactic extinction law might not be strictly adequate for broad AGN emission lines, nonetheless, the large extinction underlines the interpretation that MRC1138-262 harbors an obscured quasar.
To correct the K-band data for the AGN contribution, we fit and remove the nuclear spectrum from all other spatial pixels. This may lead to a slight oversubtraction of extended line emission along the line of sight of the AGN. In our later analysis, we aim at setting lower limits to the emission line kinematics and fluxes, therefore this procedure is nonetheless appropriate. In the K-band, we can use the luminous broad H emission line as an indicator for how well our algorithm removes the AGN light. AGN removed spectra are shown in the lower panel of Fig. 1 to illustrate the success of the method.
4 Kinematics and Physical Conditions within the Nebulosity
To investigate the spatially resolved kinematics, we extracted spectra from 33 pixel box apertures (; slightly larger than the estimated seeing in both reduced data cubes). Using the IRAF task SPLOT, we fitted [OIII]5007 line emission with up to 3 kinematic components, requiring in each component. Systematic errors of these measurements are possibly large, and the AGN removal in the H band might be not very precise. We thus use these spectra only to identify zones of rather uniform kinematics, and extract integrated spectra of these zones to further investigate their properties.

4.1 Gas Velocities and Emission Line Widths
Relative velocities of all [OIII]5007 components are shown in Fig. 2 as a function of projected radius. They appear to be segregated by velocity into roughly 4 groups with sizes of ″ ( kpc) over the total radius of ″ (20-25 kpc). Overlap between these groups in velocity is small. In Fig. 3 we show the map of relative velocities of the brightest [OIII]5007 line component in each spatial pixel. At least three distinct kinematic zones, each separated in velocity space by 1000 km s-1, but with rather uniform velocities internally, are evident. Velocities in zone 1 decline with increasing projected distance from the nucleus, gradually approaching the values in zone 2 at the eastern bound. This is in agreement with Fig. 2, which also suggests that the velocities in zone 1 at its low-velocity end approach the velocities in zone 2. Zone 3 has largely uniform intrinsic velocities, whereas velocities in zone 2 vary gradually with position angle, reaching a maximum at a position angle . The relatively uniform velocities within each structure, (Fig. 3), mirroring the regularity found in Fig. 2, are highly reminiscent of what would be expected for overlapping, edge-brightened “bubbles” (such a scenario is also favored by the low filling factor of the emission line gas, §5.2 and §7).
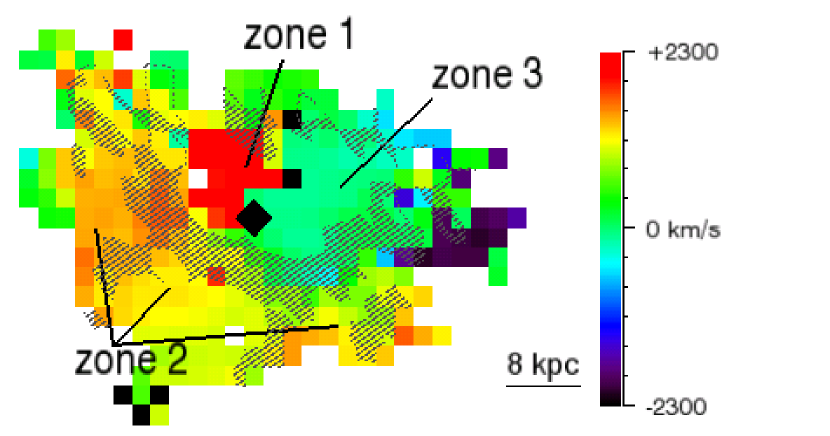
However, we are using the term “bubble” somewhat loosely, referring mainly to the clearly distinct zones in velocity space. Their morphologies are nearly circular as if projected on the sky, and are consistent with expanding spheres or projected conical outflows. They might be analogues of buoyantly rising, low-density regions in low-redshift radio galaxies, but our analysis does not rely on this interpretation. By using this term, we simply relate to the geometry and velocity structure of the gas, not necessarily the full astrophysical interpretation.
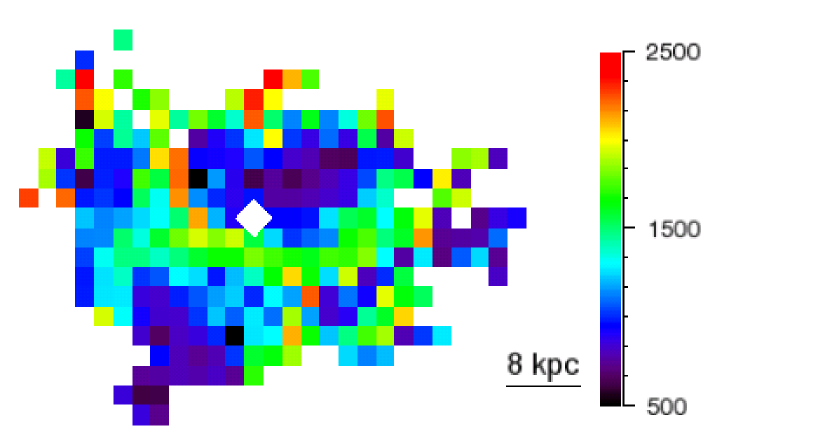
This interpretation is also supported by the spatial distribution of line widths. In Fig. 4 we show a map of the FWHM of the brightest [OIII]5007 component in each pixel. Line widths vary between FWHM km s-1. Most striking is a ring of broad line emission (FWHM km s-1) around zones 1 and 3, shown as hatched area in the velocity map of Fig. 3. This ring supports the above interpretation that the emission line regions with well separated velocities are geometrically and physical distinct entities, which originate from apparent broadening due to overlap between adjacent bubbles or from turbulence due to interactions along their boundaries.
4.2 Spectral Properties
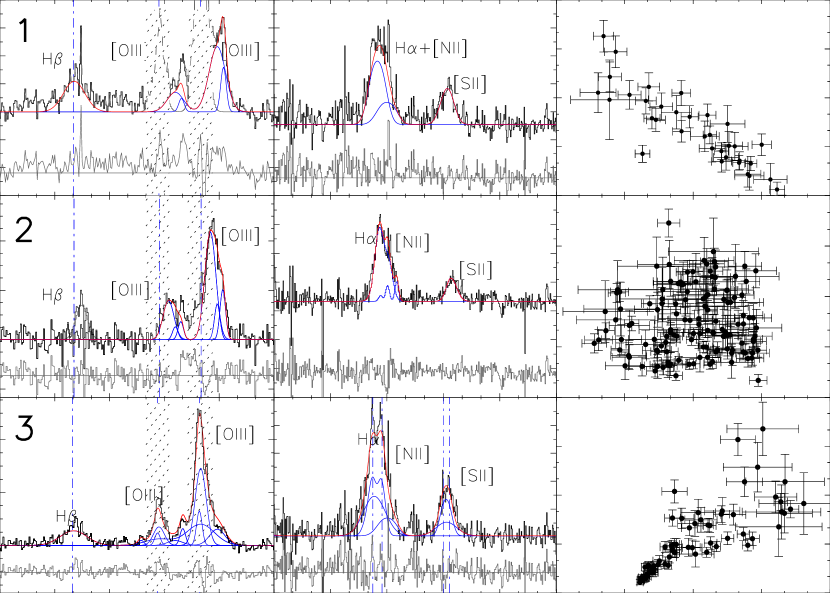
Integrated H and K band spectra of the 3 definable bubbles are shown in Fig. 5. Emission lines are bright in all bubbles. Line profiles are complex, and H and [NII]6583 are blended in all zones. To obtain a consistent fit for all lines in a given zone, we identify kinematic subcomponents from the [OIII]5007 profile, and restrict all other line fits to have the same relative velocities and widths. We leave the flux as a free parameter, except for the ratios of the [NII]6548,6583 and [OIII]4959,5007 emission line doublets, where we fix the line ratios to the ratios of their transition probabilities.
Our data also include the [SII]6717,6731 line doublet, which has line ratios sensitive to electron densities in the range of 100 to cm-3 (Osterbrock, 1989). We identify two pixel apertures in bubble 2 where the two components are sufficiently narrow to be deblended robustly. Line ratios in these apertures are . This corresponds to a density range cm-3, and cm-3 at best fit value, assuming a temperature K. (The results of Kraemer, Ruiz, & Crenshaw, 1998; Heckman & Balick, 1979; Osterbrock, 1989, indicate a most likely temperature range of K in AGN narrow line regions, which is sufficiently accurate for our purpose.) Bicknell et al. (1997) find densities of cm-3 in the precursor regions of fast radiative shocks, constrained by radio observations, in good agreement with our result using an independent estimate. The [SII] emission originates mainly in a “partially ionized zone”, where the thermal pressure is few 10-12 ne dynes cm-2 and (e.g Shull & McKee, 1979). We use these correction factors in calculations that make use of the total gas density, e.g., the total mass estimate based on the recombination line flux of Hydrogen. Moreover, we only use the H line flux with the AGN contribution removed, as described in §3.
The blending of [NII] and H complicates the H flux estimates, therefore we only aim at estimating robust lower limits to the kinetic energy in the extended emission line region, and hence minimize the H contribution in our fits to the [NII]H line blend, typically obtaining [NII]. With the adopted cosmology, the total observed H flux in all zones corresponds to a total H luminosity ergs s-1. To estimate the ionized gas mass in the diffuse nebula, we assume case B recombination (Osterbrock, 1989), and our previous gas density estimates:
with H luminosity in units of ergs s-1, Planck constant , H frequency , effective H recombination coefficient, , proton mass , and electron number density in units of 100 s-1. With the electron density of cm-3 (§4.2) this implies a total ionized gas mass M⊙.
Our analysis can be precise at the order-of-magnitude level only, and is dominated by astrophysical rather than the measurement uncertainties. Therefore we will adopt an HII mass of M⊙, corresponding to the measured H luminosity and electron density at face value and not corrected for extinction. Thus this estimate is a robust low limit to the intrinsic H luminosity and total emission line gas mass.
5 Physical Properties of the Flow
5.1 What Drives the Dynamics?
MRC1138-262 is not the first HzRG known to have broad, spatially resolved emission line gas (e.g., McCarthy et al., 1996; Tadhunter, 1991; Villar-Martín et al., 1999), but we have not found another such galaxy in the literature with integral-field spectroscopy in the rest-frame optical. For galaxies with spatially resolved slit spectroscopy, the slit is typically aligned with the radio axis, so that the morphology of the high-velocity emission line gas and total energy and mass in the flow are difficult to estimate.
Gas dynamics dominated by the large-scale gravitational potential of the host galaxy would have smooth velocity gradients and rather uniform line widths with FWHMs of a few hundred km s-1. Villar-Martín et al. (2006) discuss the relatively quiescent kinematics in the Ly halo of the z=2.49 HzRG MRC2104-242, with FWHM km s-1, and argue that the kinematics might be caused by rotation or infalling gas. The kinematics we observe in MRC1138-262, however, are different from MRC2104-242, quantitatively and qualitatively.
Our integral-field observations are uniquely suited for a more detailed investigation of what causes the extreme kinematics in MRC1138-262, by relating the local bulk and turbulent velocities in the gas. The right panel of Fig. 5 shows the FWHMs as a function of velocity in each bubble. Velocities are relative to the mean velocity in each bubble. FWHMs and velocities are uncorrelated in zone 2, in zone 1 and 3 they correlate tightly with correlation coefficients and , respectively. Positive correlations like in zone 3 are also found in starburst-driven winds, and indicate outflowing gas being accelerated and becoming more turbulent as the kinetic energy is being dissipated through shocks (Lehnert & Heckman, 1996a). Negative correlations like in zone 1 have been interpreted as deceleration shocks (Dopita & Sutherland, 1995), when gas heated by the AGN collides with the confining, higher density ISM.
Starburst powered outflows do not appear as good candidates to power an outflow with the velocity gradients and line widths observed. Typical outflow velocities in superwinds, as similarly estimated from optical emission lines, are a few km s-1 (Lehnert & Heckman, 1996a). These velocities are a factor of a few lower than in MRC1138-262 (not including any correction for projection effects). The velocities seen in starburst driven winds do not seem to be a function of either energy injection power or rate (Heckman et al., 2000) or perhaps redshift (Nesvadba et al., 2006). Nesvadba et al. find that the outflow observed in the strongly star-forming (SFR M⊙ yr-1) submillimeter galaxy SMMJ14011+0252 does not exceed velocities of km s-1 and FWHMs km s-1. Most importantly for this study, the line cores in SMMJ14011+0252 are not offset from systemic by large velocities. In other words, the overall, large scale kinematics of SMMJ14011+0252 do not appear to be strongly influenced by the wind, similar to the integrated line profiles of local starburst galaxies. Moreover, pressures within the wind are similar to winds in local starburst galaxies, suggesting similar physical properties, which make it unlikely that the outflow properties would dramatically change with redshift (see arguments in, e.g., Heckman et al., 2000). Nonetheless, the presence of individual bubbles and large and irregular velocity offsets in MRC1138-262 do suggest that some sort of feedback mechanism is driving a massive gas outflow. We will analyze the properties of this outflow in close analogy to Heckman et al. (1990) and show that energy and timescale arguments strongly favour a wind driven by the AGN as the only plausible explanation.
5.2 Timescales, Outflow Rates, and Filling Factor
Our data indicate that the gas reaches large distances, over 25 kpc for the high surface brightness emission, and might even completely escape the host potential. A way of estimating the time scale of the flow is to calculate the crossing time given the observed velocities. With bulk motions of km s-1 and an average observed radius of the emission line nebula kpc, the dynamical timescale is yrs, providing a rough timescale necessary to drive the flow over the observed distances.
If the outflow is powered by the radio source, then this timescale will be approximately similar to the age of the radio source. With estimated jet-head advance speeds of 0.1c (e.g., Wellman, Daly, & Wan, 1997, with ranges of about 0.01c to about 0.2c), and the “largest angular size” of the radio source at =1.41 GHz in MRC1138-262 (11.1″, or 92 kpc; Kapahi et al., 1998), we estimate a dynamical timescale of 3106 yrs. Because of the unknown projection angle, this can only be a lower limit (hence the factor ), and the intrinsic timescale is likely a few times higher, up to a few 107 yrs.
Wan, Daly, & Guerra (2000) suggest that the ages of radio sources decrease with increasing redshift. However, they use a flux limited sample, so that the average radio power will increase with redshift, whereas the size decreases, which might at least in part explain this trend. Using their relationship between radio power and redshift for the of MRC1138-262 implies an age of 0.4 to 1107 yrs, similar to our previous estimate.
In either approach, the age of the radio source is not significantly different from the crossing time of the emission line nebula, and the radio jet and lobes reach a factor of 2 larger radii than the (detected) high surface brightness emission line gas. This alone cannot prove that the radio jet is powering the outflow, but it is a necessary prerequisite.
To estimate a mass outflow rate, we simply assume that the outflow is being accelerated with an efficiency that is approximately constant during the jet lifetime. This implies that the current estimate is representative for the average rate over the lifetime of the source. Given the large velocities and size of the nebula, this assumption is reasonable. This very simple scenario implies M⊙ yr-1. Of course, we do expect variations in the instantaneous outflow rate due to jet precession, variable jet energy or mass density, or perhaps changing coupling efficiency to the ISM as might be expected for a jet interacting with a “clumpy” surrounding medium.
Having measured the electron density and relative ionization (assuming case B recombination), we can also constrain the volume filling factor of the H emission line gas. The total observed luminosity corresponds to a “total emission volume” , which we compare to the volume of the emission line nebula ( kpc, approximated by the total volume of 3 spherical bubbles with the observed radii of each zone). This yields a filling factor . We find a filling factor, , likely signaling that distributed in bright, line-emitting sheets, small clouds, and/or filaments.
5.3 Energy and Momentum Injection
Low filling factors arise naturally when a sufficiently intense, expanding hot wind sweeps up, accelerates, and ionizes dense hydrogen clouds within the ISM of the host galaxy. Relative to the lifetime of the host, an outflow with lifetime yrs is nearly explosive, implying impulsive energy injection (but constant over the lifetime of the event). Following, e.g., Dyson & Williams (1980), expansion speed of the shell and energy content of the bubble are related as:
| (1) |
where is the (constant) energy injection rate in units of 1044 ergs s-1, =0.5 cm-3 is the ambient ISM density in cm-3 and is the injection time in units of 10 Myrs. We approximate the velocity through the average of velocities in the line profile fits to the 3 bubbles discussed in §4. From the analysis, we find an average projected velocity of 800 km s-1. The required energy is then 4.21045 ergs s-1.
In a second approach, we model the (constant) energy injection rate into an energy conserving bubble expanding into a uniform medium with ambient density , which serves as a plausible upper bound to the energy injection rate,
| (2) |
with the radius given in units of 10 kpc and velocity given in units of 1000 km s-1. We estimated the half-light radius of the H emission, after removing the contribution from the broad line region, and found 10 kpc. For 10 kpc, a flux weighted mean velocity km s-1 and ambient density cm-3, the energy injection rate is ergs s-1. This is likely a minimum energy required since the velocities are seen in projection. If we use the total extent of the nebula for the radius, we find the energy injection rate is ergs s-1.
Alternatively, if the bubble is momentum conserving, we estimate that,
| (3) |
or dyn, of force must be injected to power the observed flow. If the jet or radiation field of the AGN is to be a viable driver of the observed gas dynamics in MRC1138-262, it must inject at least 1046 ergs s-1 of energy or alternatively, about 1038 dynes of force into the ambient interstellar medium to produce the outflow in MRC1138-262.
Each of these estimates is valid within a given model, although the underlying assumptions are very general, involving basic physical principles. We can give a fully model-independent, strictly observational lower bound to the energy injection rate from the observed kinematics of the H emission line regions. To this end, we only account for the observed ionized gas masses, not correcting for projection effects lowering velocity measurements, extinction, and material in other phases, especially X-ray emitting or molecular gas, which will contribute significantly. With the measured H gas masses and relative velocities, the kinetic energy is simply for the bulk velocities and for turbulent motion. For MRC1138-262 and summing over the velocities and dispersions in the individual bubbles, we estimate ergs, and (with unknown correction for projection, ). For our dynamical timescale of yrs, this corresponds to an average injection rate ergs s-1 over a lifetime yrs.
The results illustrate that energy injection rates at high redshift are not trivial to estimate, which limits the precision of our analysis to an order-of-magnitude level. It is however encouraging that in spite of the large uncertainties, the values are broadly consistent. We will in the following adopt E erg s-1. This choice is motivated by the approximate range of values indicated by the simple estimates we have made and to the order-of-magnitude spirit in which they were made.
6 Powering the Outflow: AGN vs. Radio Source
6.1 Energy Supply by the AGN
If the AGN is to be a viable candidate for powering the observed outflow, then it must be able to at least provide the above energy injection rate. It is difficult to know a priori what is powering the outflow, the overall bolometric luminosity, , which might couple to the ISM through radiation pressure on dust grains, or directly through the kinetic luminosity of the jet . We shall start by estimating . Following the scaling of X-ray to bolometric luminosity of Elvis et al. (1994) and the X-ray luminosity of MRC1138-262 at keV, (=45.6 ergs s-1; Carilli et al., 2002), we estimate ergs s-1. We can also use the relationship between and rest-frame optical flux density of the AGN in QSOs (Kaspi et al., 2000), and the 5100Å continuum flux in our H band spectrum of MRC1138-262, W m-2, yielding ergs s-1. Given the approximate nature of either estimate, these values are consistent. We will in the following adopt ergs s-1 since the estimate using the optical continuum is likely to be strongly affected by high extinction to the region of AGN continuum emission in radio galaxies compared to QSOs.
Estimating the jet kinetic luminosity as a measure of the power that the jet is capable of injecting in the ambient ISM is more difficult and challenging and many authors have tried a variety of methods for estimating or constraining the mechanical jet luminosities. We will therefore use and compare a variety of methods to estimate the mechanical luminosity of the jet in MRC1138-262. Wan, Daly, & Guerra (2000) empirically calibrate the radio source characteristics in the 3CR as a function of radio power at 178 MHz. For MRC1138-262 the VLA measurements at 4.86 GHz and the original selection of the Molonglo Reference Catalog (MRC) at 408 MHz (Kapahi et al., 1998, and references therein), imply a radio spectral index =1.34, and a 178 MHz radio power, P178MHz=1034.82 ergs s-1 Hz-1 sr-1, in the rest-frame. This corresponds to a jet kinetic luminosity of 1046±0.3 ergs s-1 in the calibration of Wan, Daly, & Guerra (2000). Carilli et al. (2002) measured an integrated luminosity of the radio jet in MRC1138-262 in the rest-frame 0.1-1.0 GHz band, ergs s-1. Based almost solely on theoretical arguments, the ratio of mechanical to radio luminosity is typically argued to be about 10 to 1000 (e.g., De Young, 1993; Bicknell et al., 1997). Estimating that the radio luminosity is equal to , , of the total jet luminosity sets a lower limit to the jet kinetic luminosity of 1046.2 ergs s-1. Obviously, it could be substatially higher. This is, however, within the scatter of the Wan, Daly, & Guerra (2000) estimate.
We can additionally estimate the jet power using analyses of X-ray cavities which are thought to be powered by the mechanical energy of the radio jet interacting with the surrounding hot gas. Following the analysis in Bîrzan et al. (2004), we estimate the mechanical luminosity of the jet in MRC1138-262 to be about 1045±3 ergs s-1. We think that this estimate is valuable because it is similar to our approach and provides a robust lower limit to the mechanical luminosity. However, Bîrzan et al. study radio sources at lower redshift, which have different radio morphologies than MRC1138-262 and typically lower radio luminosity. Moreover, Bîrzan et al. point out that their estimates might be systematically too low due to various physical effects. As a last approach, we can estimate the kinetic energy necessary to explain the observed expansion speeds of radio lobes which are of the order of 0.1 to 0.4c (e.g., Conway, 2002). These advance speeds and a plausible model for the medium into which the lobes are advancing, yields estimated jet kinetic powers of 1046-48 ergs s-1 for powerful, high luminosity radio sources (Bicknell et al., 2003; Carvalho & O’Dea, 2002).
For the subsequent analysis, we will adopt a finducial jet kinetic luminosity of 1046 ergs s-1, but suggest that the true value could be a factor of a few higher. Thus, both jet power and bolometric luminosity estimates provide sufficient energy to power the observed outflow. Both appear similarly powerful, thus their relative impact will depend on their coupling efficiency with the ambient ISM and their ability to accelerate ambient interstellar material to large distance from the nucleus.
6.2 Radiation Driven Winds
The importance of radiation pressure in driving an outflow depends on the intensity of the radiation field itself, i.e., the bolometric luminosity, . Powerful AGN have radiation fields that are likely intense enough to efficiently heat and accelerate the gas near their center through Compton heating (Sazonov et al., 2005) and dust opacity (King, 2003). Through Coulomb coupling of charged dust grains to the ionized gas, radiation pressure can in principle trigger an outflow. Blue shifted X-ray absorption lines in quasar spectra indeed suggest parsec scale outflows, with mass loss rates of 1 M☉ yr-1 and velocities 0.l c (e.g., Reeves, O’Brien, & Ward, 2003). However, e.g., King (2003) find that this gas generally cannot drive large scale outflows.
We describe a momentum driven AGN wind, following, e.g., King (2003) and Murray, Quataert, & Thompson (2005). The equation of motion for an optically thick wind is,
| (4) |
with acceleration , and AGN luminosity . denotes the gas mass as a function of radius. Murray, Quataert, & Thompson (2005) argue that the velocity as a function of the distance for the black hole, , is set by,
| (5) |
with a threshold luminosity above which the AGN is able to drive a significant, optically thick outflow, gas fraction , velocity dispersion of the host galaxy , and gravitational constant . is the radius where the acceleration sets on, namely the dust sublimation radius at a few pc from the black hole. can be derived in close analogy to the Eddington limit for the central AGN, . (See §5 of Murray, Quataert, & Thompson, 2005, for the full derivation of this threshold.). For a galaxy, ergs s-1. With ergs s-1, a reasonable gas fraction of 10-50%, and a velocity dispersion of 250 km s-1 (roughly corresponding to the stellar mass of MRC1138-262), this suggests that ergs , well above the bolometric luminosity of MRC1138-262. For a lower gas fraction and smaller velocity dispersion, radiation pressure might play a role, but it unlikely dominates in accelerating the gas to the high velocities we observe. For instance, if = (in good agreement with the implied by Murray, Quataert, & Thompson, 2005), the acceleration would have to have been maintained for a few 108-9 yrs in order to accelerate the emission line gas in MRC1138-262 to the observed velocities, likely about 1-2 orders of magnitude longer than the AGN lifetime. Typical line velocities would be about those observed, perhaps less since we cannot accurately quantify the effect of projection. Hence, radiation pressure does not seem sufficient to power the large-scale gas kinematics in MRC1138-262, making the radio jet a more likely candidate to mediate the AGN feedback.
6.3 Coupling Efficiency between Jet and ISM and the “Dentist Drill” Model
We derive a simple estimate for the observed coupling efficiency between the energy input rate ergs s-1 of the radio jet (§6.1) and the energy injection rates derived in §5.3, erg s-1. Given the uncertainties in either estimate, and in the spirit of providing lower limits, we adopt a loosely constrained coupling efficiency , corresponding to the jet kinetic energy estimate common to all methods of §6.1.
The “dentist drill model” (Scheuer, 1982) is the simplest scenario explaining how the jet might interact with the ambient ISM, which uses a termination shock to couple with the ISM as the jet-head ploughs through the ambient medium. Small variations of the jet direction cause the jet to jitter across the working surface, and the resulting cavity will be somewhat larger than the jet diameter itself. Typical assumed values are (Begelman & Cioffi, 1989).
Thus in the “dentist drill” scenario, the interaction between radio jet and the surrounding medium is limited to the working surface of the jet, and the coupling efficiency is approximately the area of the working surface, divided by 4. This can be parameterized as , or 0.045% for 15∘ opening angle. To explain the erg s-1 kinetic energy injected into the outflow of MRC1138-262 with the small implied by the dentist drill model would hence require an energy input of few erg s-1. This is above even the most extreme estimates of jet kinetic energies discussed in §6.1. Hence the observed kinematics in MRC1138-262 require a significantly more efficient coupling to the ambient ISM than implied by the “dentist drill” model.
7 Heating the Gas: Shocks vs. Direct Illumination by the AGN
Line widths and bulk motions in MRC1138-262 indicate shock speeds km s-1. Optical emission line properties of shocks with such speeds are very difficult to model, because emission arises predominantly through ionizing photons escaping upstream ahead of the shock into the “precursor” region. Thus, accurately modelling the line emission from the shock depends crucially on the detailed properties of the ambient ISM and the radiation field (both background and that generated by the shock). Following this argument and the modeling of Dopita & Sutherland (1996), we use,
| (6) |
to estimate the amount of shocked material from the measured H luminosity in MRC1138-262 (§4.2). In this equation, is the number of recombinations per Hydrogen atom. At least M⊙ yr-1 of shock material are necessary to produce the entire H luminosity, not accounting for extinction and possibly a lower efficiency of the emission (fewer recombinations per Hydrogen atom for example). Over the likely yrs lifetime of the radio jet (§5.2), this implies an unphysically large of shocked gas.
On the other hand, the predicted surface brightness of a shock with 500 km s-1 velocity is about 21040 ergs s-1 kpc-2 (Dopita & Sutherland, 1996), and increases dramatically with velocity (). Shock heating across the projected area of the emission line nebula in MRC1138-262, kpc2, would therefore produce a total H luminosity of 2.41043, % of what we observe. Accounting for extinction will make this discrepancy yet more dramatic.
Since the amount of shocked material necessary to power the nebula is unphysically large and the predicted surface brightness is too low, it seems that shock excitation is probably not viable as the sole excitation mechanism of the emission line gas, and ionization by the AGN will play a large role. Villar-Martín et al. (2003) reach a similar conclusion from longslit rest-frame UV spectra of 10 HzRGs.
To estimate whether photoionization by the AGN can heat the gas, we assume a uniformly dense, radiation bounded nebula in ionization equilibrium. With the properties we observe in MRC1138-262, this requires an ionizing photon rate of , or for . The results of Elvis et al. (1994) imply that on average each ionizing photon in powerful AGN has an energy corresponding to times the ionizing potential of hydrogen (i.e., ). We therefore constrain the ionizing luminosity , corresponding to , or . If % of the bolometric luminosity of MRC1138-262 is ionizing (Elvis et al., 1994), i.e., ergs s-1 (§6.1), the nebulosity of MRC1138-262 might well be mainly photoionized by the AGN, if the escape fraction is %. This estimate also implies that the nebula could easily be matter bounded.
However, given the small filling factor (, §5.2), a covering factor % implies that the gas is distributed in elongated structures with large surface area and relatively small volume. The gas must either be clumped into large numbers of small, approximately spherical clouds, long and thin “string-like” structures, or in thin, broad sheets, for either shock or excitation of the nebula. Whatever the exact geometry, our results are only consistent with a small volume filling factor, but a relatively large covering fraction.
Thus, the mechanical and optical emission line properties of MRC1138-262 give direct evidence for an outflow which is driven by the expanding radio source, and heated mainly through photoionization by the AGN.
8 AGN Feedback: Impact on Galaxy Evolution and Cosmological Significance
Our analysis of the kpc scale outflow in MRC1138-262 suggests that the AGN is the best candidate for driving the outflow: The crossing time of the nebula ( yrs) approximately equals the lifetime of the radio jet and typical estimates of AGN lifetimes (Martini, 2004, and references therein), and the AGN also provides the energy input rate necessary to power the observed outflow, given it is efficiently coupled to the ISM, with . Observed mass loss rates are M⊙ yr-1 (§5.2). Population synthesis fits assuming exponentially declining star-formation histories with a variety of e-folding times (including infinity for continuous star-formation) over a wide range of maximum star-formation rates, suggest a stellar mass of M⊙. The range of best fit masses for all of the models suggest an uncertainty of about a factor 2-3. The observed outflow rate therefore corresponds to a mass loss of % of the stellar mass within years. Observations of carbon monoxide in high redshift radio galaxies suggest gas masses of M⊙ (Papadopoulos et al., 2000; Greve et al., 2005), corresponding to % of the stellar mass of MRC1138-262. Given the large uncertainties in these estimates, we assume a gas fraction of % of the stellar mass, implying that AGN feedback could remove the total ISM of the host within yrs. We emphasize that the mass loss rate is a strict lower bound estimated from the observed H emission line gas mass. The true outflow might be up to an order of magnitude higher, and might well be larger than the total needed to quench future star-formation.
The outflow in MRC1138-262 appears not aligned with the radio jets, but has a nearly spherical geometry, so that an adequate assessment of the dynamics in the extended emission line region clearly requires integral-field data, especially in the rest-frame optical, to be less sensitive to the source geometry, extinction, and the complex radiation transport in the rest-frame UV given the complex spatial structure of the emission line gas. We do not believe that MRC1138-262 is a “one-off” special case. Broad forbidden emission lines in the nebulosities of HzRGs with FWHM km s-1 are commonly found in longslit studies (e.g. Tadhunter, 1991; McCarthy et al., 1996; Iwamuro et al., 2003). Simulating a longslit spectrum of MRC1138-262 from our SPIFFI data with the “slit”aligned with the radio axis, yields similar H fluxes as given in, e.g. Evans (1998). We recently obtained SINFONI data of a small sample of HzRGs at z=2.5-3.5, and find similarly extreme kinematics in the extended sources. In the following we will therefore assume that MRC1138-262 is in an evolutionary stage, which is short, yrs, but common for massive galaxies, and in particular for those which go through a phase of powerful nuclear activity at high redshift.
8.1 A Solution of the [/Fe] Puzzle?
A massive, AGN driven outflow is a catastrophic event which can be expected to leave measurable imprints on the low-redshift descendents of the AGN host galaxy. Semi-analytical models of massive gas-rich mergers with a multi-phase ISM in the early universe are found to reproduce the local luminosity function of massive, red early-type galaxies if they include a phase of strong AGN feedback (Hopkins et al., 2005; Croton et al., 2006). Robertson et al. (2005) find that these models can explain the tilt in the fundamental plane assuming dissipative, high redshift merging of galaxies with gas fractions , including star-formation and AGN-related feedback, and Di Matteo et al. (2005) are able to reproduce the observed M relationship using this mechanism. In spite of these successes, such models cannot resolve the black hole accretion, therefore AGN feedback is included in a rather schematic way, neglecting,e.g., radiatively inefficient black hole growth (Springel et al., 2005). They assume isotropic thermal coupling between AGN and ISM with efficiencies of %, and imply that star-formation is suppressed within a few yrs. We note that this efficiency is lower than the coupling efficiency we find in MRC1138-262 (), but the time scales agree surprisingly well, given the crudeness of the models and, by necessity, the “order-of-magnitude” nature of our analysis.
To set observational constraints on the impact of AGN driven winds, we now investigate whether the outflow in MRC1138-262 can explain the observed properties of the low redshift massive galaxy population. A massive outflow related to major mergers at high redshift is in overall agreement with a population of mostly spheroidal galaxies, stellar populations that have luminosity-weighted ages consistent with formation at redshifts (Thomas et al., 2005), and with extremely low gas contents.
A more quantitative constraint comes from the relative enhancement of elements with respect to the iron content of these galaxies, (e.g., Thomas, Greggio, & Bender, 1999; Romano et al., 2002). The abundance of -elements relative to iron traces the relative numbers of thermonuclear and core-collapse supernovae and effectively traces the time scale of star formation due to the relative delay in the thermonuclear supernova. Silk (2005) propose a top-heavy IMF as alternative explanation for the observed overabundance. However, as Trager et al. (2000) point out, the relative overabundance in fact is an absolute Fe underabundance, which indicates a relative lack of contribution of the thermonuclear supernovae to the overall metal abundances rather than an enhancement of core-collapse supernovae. This argument does not favor explaining the relative enhancement compared to the solar value with a top-heavy IMF. Moreover, Nagashima et al. (2005) find from semi-analytical modeling that the hypothesis of a top-heavy IMF cannot explain the observed tight correlation between enhancement and velocity dispersion in early-type galaxies, but agrees with a more pronounced early truncation of star-formation with increasing galaxy mass.
A mechanism which efficiently removes nearly all gas from the host in Gyrs is therefore more promising, and was suggested by Thomas, Greggio, & Bender (1999) and Romano et al. (2002) for massive early-type galaxies. Outflows with the observed mass loss rate in MRC1138-262, M⊙ yr-1, fulfill this constraint, given that sufficient kinetic energy is injected into the ISM during the AGN luminous phase. In §8.3 we estimate that ergs or more are injected into the ISM of MRC1138-262 during an assumed AGN lifetime of yrs. The mechanical energy of the AGN is able to entrain ambient material, propelling it outwards at the high velocities observed. The maximum amount of ambient material (if accelerated to escape velocity) can be approximated by an energy conservation argument as:
| (7) |
where is the energy of the outflow in units of ergs and is the escape velocity in units of 500 km s-1. is difficult to constrain. For galaxies with NFW profiles (Navarro et al., 1997), there is a simple relationship between , virial radius and mean mass density of the halo over the background dark matter density (see Bullock et al., 2001). For a baryonic mass fraction of 10%, the escape velocity in MRC1138-262 is about 700 km s-1 at the virial radius of about 120 kpc (Bullock et al., 2001). Equation 7 implies that MRC1138-262 may eject, 9 1011 M⊙ of material (assuming =9., which is the maximum of our estimated values, and =1.4), or 3 1011 M⊙ assuming our fiducial value of =3.. This is of course a very crude estimate, but it does suggest that, plausibly, much of the baryonic mass could escape the potential of the galaxy and thus will not be available for future star-formation. However, this represents a strict upper limit to the total mass ejection. We have not assumed a coupling factor between the energy and the ambient gas, and this factor is undoubtably less than one (we estimate ). Subsequently, we will adopt this maximum mass ejection estimate and a coupling efficiency of 10% as the upper boundary, and the simple observed mass loss rate from H as a lower boundary to the most likely range of mass loss rates and to constrain the amount of mass and metals ejected by AGN winds.
8.2 Can AGN Inhibit Baryonic Mass Accretion?
In addition to suppressing star formation within the short timescale set by the [/Fe] “clock”, the AGN must also be able to inhibit the accretion of gas from the surrounding IGM or ICM to effectively halt future star formation. Croton et al. (2006) find that it is necessary to incorporate such a mechanism into their simulation, to inhibit galaxy growth in a population of massive red galaxies, and to produce a mass function with the appropriate exponential cutoff at the high end. In a very interesting analysis of a large sample of radio loud AGN based on data from the Sloan Digital Sky survey, Best et al. (2005) find that the dependence of the size of the radio-loud AGN fraction on black hole mass mirrors that of the cooling rate within the hot atmospheres of elliptical galaxies. Best et al. further argue that the AGN could be fueled by such cooling gas and that AGN heating could plausibly balance the cooling of the gas over time. Could the energy output of MRC1138-262 balance gas accretion from the IGM with a similar mechanism?
Following the arguments in Croton et al., we can estimate whether or not it is even plausible for the radio jets in MRC1138-262 to inhibit the accretion of gas onto the dark matter halo. Croton et al. estimate the rate at which gas is accreted onto dark matter halos as a function of halo virial mass and redshift. For a halo with km s-1 at , they give an accretion rate of M⊙ yr-1. The gas is assumed to form into a hot, cooling halo of gas filling the dark matter halo, thus its energy can be estimated using simple kinetic arguments. Making this assumption, the rate at which energy is deposited in the halo with a virial velocity, , is approximately:
| (8) |
Over the lifetime of the AGN, this will be, . Thus both the instantaneous (1046 ergs s-1) and the total energy ejection rate (3 1060 ergs) of the AGN appear sufficient to stop the collapse of gas at the virial radius of the dark matter halo. If there is a connection between mass accretion and igniting AGN activity in galaxies, then the output of a single radio loud AGN cycle appears sufficiently energetic to suppress subsequent gas flow at the virial radius. Radio lobes at high redshift reach distances of kpc. Therefore the range and amount of energy injection seem sufficient to plausibly resist the gas accretion flow, and to influence the final baryonic mass of galaxies hosting powerful radio sources. Of course the energy output from the AGN must couple to the infalling gas for it to be effective. Certainly the high efficiencies we have estimated for the gas within 10-20 kpc of the nucleus would be sufficient.
This is a fundamental difference to starburst-driven winds which will heat the gas on similar time scales, but lack the energy and power necessary to unbind significant amounts of gas from the most massive halos, and are very unlikely to stop the accretion flow. If the ejected gas rains back onto the galaxy, and this material supports further star-formation, the enhanced enhancement will not be preserved. Similar arguments disfavor models where star-formation has consumed most of the gas prior to the AGN bright phase, e.g., Sazonov et al. (2005), and approaches where ultraluminous starbursts are triggered through positive AGN feedback (Silk, 2005), provided that most of the stellar mass observed at are formed in such a burst.
8.3 The Cosmological Significance of AGN-feedback
8.3.1 Simple Energetic Argument
The short lifetimes of powerful AGN ( yrs; Martini, 2004) compared to a Hubble time indicate that nuclear activity is likely episodic. To provide an estimate of the cosmic energy density released through AGN feedback, we will therefore assume that AGN hosts have only one cycle of activity that lasts yrs with coupling efficiencies to the host’s ISM and outflow characteristics similar to MRC1138-262. The energy output during one such cycle follows from the previous analysis, ergs (with =1046 ergs s-1 and =107 years). To estimate the AGN duty cycle directly from the number of observed luminous AGN, we use the co-moving number density of luminous AGN calculated by, e.g., Pei (1995), Mpc-3 for optically selected high-redshift quasars brighter than . If the “unified model” of AGN is correct, then QSOs are a subsample of all AGN, and the observed number density of QSOs will be a few times lower than the intrinsic number density of the full AGN population. We also assume that a “radio loud” episode is an intrisic part of the lifecycle of all powerful AGN. Figure 9 of Pei (1995) shows that 95% of all quasars are at , within an epoch of Gyrs. For yrs, this yields . This is again a lower limit, and neglects radiatively inefficient black hole growth.
The overall energy budget of powerful AGN can then be gauged by,
| (9) |
As a result, powerful AGN provide a cosmic energy density due to outflows of . We note that this global estimate is relatively robust against uncertain AGN lifetimes, because increased durations leads to lower duty-cycles and vice versa.
8.3.2 Local Black Hole Mass Density
We can also use the local co-moving mass density of supermassive black holes (SMBH) as a measure for the integral accreted black hole mass to constrain the cosmological significance of AGN feedback. Using the co-moving number density of spheroids and the M relation, Yu & Tremaine (2002) estimate the local mass density of nuclear black holes, h Mpc-3. To estimate the total kinetic luminosity corresponding to this black hole mass density, we use the simple scaling,
| (10) |
with the efficiency of the kinetic energy output relative to the radiative (bolometric) luminosity, , and the radiative efficiency relative to the accreted rest mass energy, . The radiative efficiency of massive black holes has been estimated to be roughly 10% to 30% (e.g., Yu & Tremaine, 2002, and references therein), whereas there is a broad range of relative kinetic energy efficiency of 0.05 to 1 (Willott et al., 1999). Adopting this range of values suggests that the kinetic energy density is approximately 2 to 100 1057 ergs Mpc-3. For a fiducial =1, the estimated kinetic energy density ejected is about 5 1057 ergs Mpc-3, higher than what we estimated from the QSO co-moving space density and duty cycle.
This however implies that all black hole growth is related to gas accretion, and occurs during AGN luminous phases. Both assumptions are unrealistic, as indicated, e.g., by the large population of obscured quasars and the possibility of BH-BH mergers. This result therefore sets an upper constraint to the energy density ejected by AGN. In the spirit of setting lower constraints we adopt the first value, and note that our calculation does not violate any low-redshift constraints from the low-redshift number densities of supermassive black holes.
8.4 The Influence on the IGM: Overall Energy, Mass, and Metal Ejection
Simple energetic arguments alone show the potentially large significance of AGN feedback on the evolution of local early type galaxies. Bernardi et al. (2003) estimate a local co-moving space density of galaxies, 0.0020 h Mpc-3, Sheth et al. (2003) find a local co-moving space density of 0.0022 h Mpc-3 for M⋆ early type galaxies. Using the co-moving density of M⋆ early type galaxies as a normalization factor, and the upper limit to the kinetic energy density in §8.3.1, ergs Mpc-3, we find that on average, each M⋆ early-type galaxy ejects ergs, roughly the binding energy of an elliptical galaxy with total mass M⊙(or a galaxy about one magnitude brighter than ; Bernardi et al., 2005). This is of course a statistical estimate to relate the impact of such outflows to the population of massive galaxies. It does not require or imply that each M⋆ early-type galaxy indeed went through a MRC1138-262-like epoch.
Given the large amount of ambient ISM that the AGN likely drives out from the galaxy and perhaps from the surrounding dark matter halo, it is pertinent to ask: If MRC1138-262 is typical, how much mass (and mass of metals) could such outflows eject? Using either the observed outflow rate for yrs or the maximum total mass ejection, we have, M⊙ (§8.1), with the co-moving QSO number density and the inverse of their duty cycle, we find that on average,
| (11) |
of material will be swept out by AGN feedback, where is the co-moving space density of QSOs in units of 510-7 Mpc-3 and is the inverse duty cycle in units of 300. This implies that approximately M⊙ of material is ejected per M⋆ galaxy. Within these loose constraints, this is about the mass of ISM in a low-redshift gas rich galaxy and also roughly the molecular gas mass in high-redshift submm and radio galaxies.
Lacking robust constraints on the gas-phase metallicity in HzRGs, we use the metallicities of low-redshift massive galaxies to constrain the metal loss induced by AGN feedback. The local mass-metallicity relationship indicates that local galaxies have solar and greater metallicities (Tremonti et al., 2004). With our above analysis, and scaled to solar metallicity , this implies that powerful AGN feedback expels up to M⊙ of metals per M⋆ galaxy. Early-type nearby galaxies about a magnitude brighter than have total baryonic masses of M⊙, and super-solar metallicities by dex (Tremonti et al., 2004), which implies a total metal content of M⊙. This indicates that MRC1138-262-like feedback could eject a substantial fraction of the metals contained in the stars of an elliptical in the local Universe.
This metal-rich outflow may contribute significantly to the overall metallicity density at high redshift. Bouché, Lehnert, & Péroux (2005a) estimate the co-moving metallicity density at z from integrating the star-formation rate density, M⊙ Mpc-3. If outflow rates in powerful AGN are generally similar to MRC1138-262, then our above estimate implies a total metal ejection of M⊙ Mpc-3. Bouché, Lehnert, & Péroux (2005b) were able to account for 50% of the total metallicity density at z in the known population of galaxies. Thus, AGN feedback from massive galaxies may account for of-order a few percent to about 20% of all metals in the IGM at z2. Although these estimates are highly uncertain, it appears very likely that AGN-driven outflows are a significant contributor to the overall metal distribution in the IGM in the early universe.
9 Summary
We presented a study of the spatially-resolved dynamics in the optical emission line gas around the z2.16 powerful radio galaxy MRC1138-262, using the near-infrared integral-field spectrograph SPIFFI on UT1 of the VLT. The large-scale kinematics in the emission line nebula of this galaxy are not consistent with the signatures of large-scale gravitational motion or starburst-driven winds. Velocities and FWHMs of km s-1 indicate a vigorous outflow with an estimated total energy which is orders of magnitude higher than suggested for starburst-driven winds. Based on timescale and energy arguments, we conclude that the observed outflow, which is a strict lower limit to the intrinsic amount of outflowing gas, is most plausibly driven by the AGN. This implies a relatively efficient interaction between AGN and interstellar medium, with efficiency , mostly mediated by mechanical energy injection through the radio jet. Radiation-driven winds do not appear powerful enough to explain the observed velocities over the size of the optical line emitting gas.
For MRC1138-262 we estimate from simple energetic arguments that the total energy needed to drive the observed outflow of optical emission line gas is of-order few ergs with a mass outflow rate, M⊙ yr-1. If we assume that every luminous QSO near the peak of their co-moving density at z2 has such an outflow phase with similar characteristics to MRC1138-262 we find that powerful AGN eject ergs Mpc-3 of energy into the IGM and M⊙ Mpc-3 of gas, including M⊙ Mpc-3 in metals. These energy and masses are significant compared to the the total binding energy and mass budget of early-type galaxies in the local Universe. If MRC1138-262 is indeed archetypal, then AGN winds have the potential to be of similar, perhaps even larger, cosmological signficance than starburst-driven winds, especially for the most massive galaxies. They accelerate the outflowing gas to much higher velocities than starburst-driven winds, and much of this material and energy are likely to escape the potential of even the most massive individual galaxy halo. Outflows like in MRC1138-262 have the potential to explain the observed properties of low-redshift massive galaxies, namely their old, and narrow range of ages and low gas fractions. Moreover, the large mass loss rates and short timescales of their outflows can naturally explain the observed enhancement of [/Fe] relative metal abundances observed in the most massive galaxies at low redshift. AGN-driven outflows appear to be a plausible mechanism that efficiently suppresses star-formation within a few yrs. They also have high enough energies to perhaps stop the accretion flow of matter from the IGM into their dark matter halos. Thus, if accretion is followed by AGN activity, then AGN feedback may be an effective mechanism for regulating galaxy growth (Croton et al., 2006).
Our study comprises only one source, but we have indirect evidence for MRC1138-262 being far from unique. Velocities of km s-1 are not uncommon in the extended emission line gas of powerful radio galaxies, but are generally extracted from longslit spectra aligned with the radio jet axis only. Simulating a longslit spectrum from the SPIFFI data cube, we find good agreement between MRC1138-262 and these samples. The bolometric and radio jet luminosities of MRC1138-262 are not unusual, and the source follows the relationship of high-redshift radio galaxies, if correcting for the luminous broad H line emission. We are currently acquiring rest-frame optical, integral-field data for a larger sample of HzRGs, to make statistically more robust predictions. Preliminary results strongly support the present analysis, giving further evidence that AGN feedback plays a major role in the evolution of the most massive galaxies in the universe.
References
- Archibald et al. (2001) Archibald, E. N., Dunlop, J. S., Hughes, D. H., Rawlings, S., Eales, S. A., & Ivison, R. J. 2001, MNRAS, 323, 417
- Begelman & Cioffi (1989) Begelman, M. C., & Cioffi, D. F. 1989, ApJ, 345, L21
- Benson et al. (2003) Benson, A. J., Bower, R. G., Frenk, C. S., Lacey, C. G., Baugh, C. M., & Cole, S. 2003, ApJ, 599, 38
- Bernardi et al. (2003) Bernardi, M., et al. 2003, AJ, 125, 1882
- Bernardi et al. (2005) Bernardi, M., Sheth, R. K., Nichol, R. C., Schneider, D. P., & Brinkmann, J. 2005, AJ, 129, 61
- Best et al. (2005) Best, P. N., Kauffmann, G., Heckman, T. M., Brinchmann, J., Charlot, S., Ivezić, z̆., & White, S. D. M. 2005, MNRAS, 362, 25
- Best et al. (2003) Best, P. N., Lehnert, M. D., Miley, G. K., & Röttgering, H. J. A. 2003, MNRAS, 343, 1
- Best, Longair, & Röttgering (1998) Best, P., Longair, M., & Röttgering, H. J. A. 1998, MNRAS, 295, 549
- Bicknell et al. (1997) Bicknell, G. V., Dopita, M. A., & O’Dea, C. P. O. 1997, ApJ, 485, 112
- Bicknell et al. (2003) Bicknell, G. V., Saxton, C. J., Sutherland, R. S., Midgley, S., & Wagner, S. J. 2003, New Astronomy Review, 47, 537
- Bîrzan et al. (2004) Bîrzan, L., Rafferty, A., McNamara, B., Wise, M. W., & Nulsen, P. E. J. 2004, ApJ, 607, 800
- Bullock et al. (2001) Bullock, J. S., Kolatt, T. S., Sigad, Y., Somerville, R. S., Kravtsov, A. V., Klypin, A. A., Primack, J. R., & Dekel, A. 2001, MNRAS, 321, 559
- Bouché, Lehnert, & Péroux (2005a) Bouché, N., Lehnert M. D., Péroux C., 2005a, MNRAS, 364, 319
- Bouché, Lehnert, & Péroux (2005b) Bouché, N., Lehnert M. D., Péroux C., 2005b, MNRAS, in press (astro-ph/0511698)
- Carilli et al. (2002) Carilli, C. L., Harris, D. E., Pentericci, L., Röttgering, H. J. A., Miley, G. K., Kurk, J. D., & van Breugel, W. 2002, 567, 781
- Carvalho & O’Dea (2002) Carvalho, J. C. & O’Dea, C. P. 2002, ApJS, 141, 337
- Conway (2002) Conway, J. E. 2002, New Astronomy Review, 46, 263
- Croton et al. (2006) Croton, D. J., Springel, V., White, S. D. M., De Lucia, G., Frenk, C. S., Gao, L., Jenkins, A., Kauffmann, G., Navarro, J. F., & Yoshida, N. 2006, MNRAS, 365, 11
- Dey et al. (1997) Dey, A., van Breugel, W., Vacca, W. D., & Antonucci, R. 1997, ApJ, 490, 698
- De Young (1993) De Young, D. S. 1993, ApJ, 405, L13
- Di Matteo et al. (2005) Di Matteo, T., Springel, V., & Hernquist, L. 2005, Nature, 433, 604
- Dopita & Sutherland (1995) Dopita, M. A., & Sutherland, R. S. 1995, ApJ, 455, 468
- Dopita & Sutherland (1996) Dopita, M. A., & Sutherland, R. S. 1996, ApJS, 102, 161
- Dyson & Williams (1980) Dyson, J. E., & Williams, D. A. 1980, The Physics of the Interstellar Medium, (John Wiley & Sons: New York, New York)
- Elvis et al. (1994) Elvis, M., Wilkes, B. J., McDowell, J. C., Green, R. F., Bechtold, J., Willner, S. P., Oey, M. S., Polomski, E., & Curti, R. 1994, ApJS, 95, 1
- Evans (1998) Evans, A. S. 1998, ApJ, 498, 553
- Ferrarese (2002) Ferrarese, L. 2002, ApJ, 578, 90
- Greve et al. (2005) Greve, T. R., et al. 2005, MNRAS, 359, 1165
- Heckman & Balick (1979) Heckman, T. M., & Balick, B. 1979, A&A, 79, 350
- Heckman et al. (1990) Heckman, T. M., Armus, L., & Miley, G. K. 1990, ApJS, 74, 833
- Heckman et al. (2000) Heckman, T. M., Lehnert, M. D., Strickland, D. K., & Armus, L. 2000, ApJS, 129, 493
- Heckman (2003) Heckman, T. M. 2003, Rev. Mexicana Astron. Astrofis., 17, 47
- Hopkins et al. (2005) Hopkins, P. F., Hernquist, L., Cox, T. J., Di Matteo, T., Martini, P., Robertson, B., & Springel, V. 2005, ApJ, 630, 705
- Iwamuro et al. (2003) Iwamuro, F., et al. 2003, ApJ, 598, 178
- Kapahi et al. (1998) Kapahi, V. K., Athreya, R. M., van Breugel, W., McCarthy, P. J., & Subrahmanya, C. R. 1998, ApJS, 118, 275
- Kaspi et al. (2000) Kaspi, S., Smith, P. S., Netzer, H., Maoz,D., Jannuzi, B. T., & Giveon, U. 2000, ApJ, 533, 631
- King (2003) King, A. 2003, ApJ, 596, L27
- Kraemer, Ruiz, & Crenshaw (1998) Kraemer, S. B., Ruiz, J. R., & Crenshaw, D. M. 1998, ApJ, 508, 232
- Kurk et al. (2004) Kurk, J. D., Pentericci, L., Röttgering, H. J. A., & Miley, G. K. 2004, A&A, 428, 793
- Larkin et al. (2000) Larkin, J. E., et al. 2000, ApJ, 533, L61
- Lehnert & Heckman (1996a) Lehnert, M. D. & Heckman, T. M. 1996a, ApJ, 462, 651
- Lehnert & Heckman (1996b) Lehnert, M. D. & Heckman, T. M. 1996b, ApJ, 472, 546
- Lehnert, Heckman, & Weaver (1999) Lehnert, M. D., Heckman, T. M., & Weaver, K. A. 2000, ApJ, 523, 575
- McCarthy et al. (1996) McCarthy, P. J., Baum, S. A., & Spinrad, H. 1996, ApJS, 106, 281
- Martin (1999) Martin, C. L. 1999, ApJ, 513, 156
- Martini (2004) Martini, P. 2004, Invited review to appear in ”Carnegie Observatories Astrophysics Series, Vol. 1: Coevolution of Black Holes and Galaxies,” ed. L. C. Ho (Cambridge: Cambridge Univ. Press), astro-ph/0304009
- Murray, Quataert, & Thompson (2005) Murray, N., Quataert, E., & Thompson, T. A. 2005, ApJ, 618, 569
- Nagashima et al. (2005) Nagashima, M., Lacey, C. G., Okamoto, T., Baugh, C. M., Frenk, C. S., & Cole, S. 2005, MNRAS, 363, L31
- Nath & Roychowdhury (2002) Nath, B. B., & Roychowdhury, S. 2002, MNRAS, 333, 145
- Navarro et al. (1997) Navarro, J. F., Frenk, C. S., & White, S. D. M. 1997, ApJ, 490, 493
- Nesvadba et al. (2006) Nesvadba, N. P. H. et al., 2006, in preparation
- Osterbrock (1989) Osterbrock, D. E. 1989, Astrophysics of Gaseous Nebulae and AGN, University Science Books Mill Valley, CA
- Papadopoulos et al. (2000) Papadopoulos, P. P., Röttgering, H. J. A., van der Werf, P. P., Guilloteau, S., Omont, A., van Breugel, W. J. M., & Tilanus, R. P. J. 2000, ApJ, 528, 626
- Pei (1995) Pei, Y. C. 1995, ApJ, 438, 623
- Pentericci (1999) Pentericci, L., 1999, PhD thesis
- Reeves, O’Brien, & Ward (2003) Reeves, J. N., O’Brien, P. T., & Ward, M. J. 2003, ApJ, 593, 65
- Reuland et al. (2004) Reuland, M., Röttgering, H., van Breugel, W., & De Breuck, C. 2004, MNRAS, 353, 377
- Robertson et al. (2005) Robertson, B., Cox, T.J., Hernquist, L., Franx, M., Hopkins, P., Martini, P., Springel, V. 2005, ApJaccepted, astro-ph/0511053
- Romano et al. (2002) Romano, D., Silva, L., Matteucci, F., & Danese, L. 2002, MNRAS, 334, 444
- Röttgering et al. (1997) Röttgering, H. J. A., van Ojik, R., Miley, G. K., Chambers, K. C., van Breugel, W. J. M., & de Koff, S. 1997, A&A, 326, 505
- Sazonov et al. (2005) Sazonov, S. Y., Ostriker J.P., Ciotti, L., Sunyaev, R.A., 2005, MNRAS, 358,168
- Scheuer (1982) Scheuer, P. A. G. 1982, IAUS 97, 163
- Sheth et al. (2003) Sheth, R. K., et al. 2003, ApJ, 594, 225
- Shull & McKee (1979) Shull, J. M., & McKee, C. F. 1979, ApJ, 227, 131
- Silk & Rees (1998) Silk, J., & Rees, M. J. 1998, A&A, 331, L1
- Silk (2005) Silk, J. 2005, MNRAS, 364, 1337
- Springel et al. (2005) Springel, V., Di Matteo, T., & Hernquist, L. 2005, MNRAS, 361, 776
- Stevens et al. (2003) Stevens, J. A., Ivison, R. J., Dunlop, J. S., Smail, I. R., Percival, W. J., Hughes, D. H., Röttgering, H. J. A., van Breugel, W. J. M., & Reuland, M. 2003, Nature, 425, 264
- Tadhunter (1991) Tadhunter, C. N. 1991, MNRAS, 251, 46P
- Thomas, Greggio, & Bender (1999) Thomas, D.; Greggio, L.; Bender, R.1999, MNRAS, 302, 537
- Thomas et al. (2005) Thomas, D., Maraston, C., Bender, R., & de Oliveira, C. M. 2005, ApJ, 621, 673
- Trager et al. (2000) Trager, S. C., Faber, S. M., Worthey, G., & González, J. J. 2000, AJ, 119, 1645
- Tremaine et al. (2002) Tremaine, S., et al. 2002, ApJ, 574, 740
- Tremonti et al. (2004) Tremonti, C., et al. 2004, ApJ, 613, 898
- Tody (1993) Tody, D. 1993, in Astronomical Data Analysis Software and Systems II, ed. R. J. Hanisch, R. J. V. Brissenden, & J. Barnes (San Francisco: ASP), 173
- van Breugel et al. (1998) van Breugel, W. J. M., Stanford, S. A., Spinrad, H., Stern, D., & Graham, J. R. 1998, ApJ, 502, 614
- van Oijk et al. (1997) van Ojik, R., Roettgering, H. J. A., Miley, G. K., & Hunstead, R. W. 1997, A&A, 317, 358
- Venemans et al. (2002) Venemans, B. P., Kurk, J. D., Miley, G. K., Röttgering, H. J. A., van Breugel, W., Carilli, C. L., De Breuck, C., Ford, H., Heckman, T., McCarthy, P., & Pentericci, L. 2002, ApJ, 569, L11
- Villar-Martín et al. (1999) Villar-Martín, M., Binette, L., & Fosbury, R. A. E. 1999, A&A, 346, 7
- Villar-Martín et al. (2003) Villar-Martín, M., Vernet, J., di Serego Alighieri, S., Fosbury, R., Humphrey, A., & Pentericci, L. 2003, MNRAS, 346, 273
- Villar-Martín et al. (2006) Villar-Martín, M., et al. 2006, MNRAS, 366, L1
- Wan, Daly, & Guerra (2000) Wan, L., Daly, R. A., & Guerra, E. J. 2000, ApJ, 544, 671
- Wellman, Daly, & Wan (1997) Wellman, G. F., Daly, R. A., & Wan, L. 1997, ApJ, 480, 96
- Willott et al. (1999) Willott, C. J., Rawlings, S., Blundell, K. M., & Lacy, M. 1999, MNRAS, 309, 1017
- Yu & Tremaine (2002) Yu, Q., & Tremaine, S. 2002, MNRAS, 335, 965