Lyman Break Galaxies Under a Microscope: The Small Scale Dynamics and Mass of an Arc in the Cluster 1E0657-5611affiliation: Based on observations collected at the European Southern Observatory, Very Large Telescope Array, Cerro Paranal; program numbers, 70.B-0545(A) and 70.A-0229(A)
Abstract
Using the near-infrared integral-field spectrograph SPIFFI on the VLT, we have studied the spatially-resolved dynamics in the strongly lensed galaxy 1E0657-56 “arccore” by observing the rest-frame optical emission lines [OIII]5007 and H. The lensing configuration suggests that the high surface brightness “core” is the magnified central kpc of the galaxy, whereas the fainter “arc” is the more strongly magnified peripheral region of the same galaxy at about a half-light radius, which otherwise appears to be a typical Lyman break galaxy.
The overall shape of the position-velocity diagram resembles the “rotation curves” of the inner few kpcs of nearby spiral galaxies. For , our data have a spatial resolution of 200 pc in the source plane. The projected velocities rise rapidly to km s-1 within radii kpc from the center, and asymptotically reach a velocity of km s-1 within the arc, at a projected radius of a few kpc radius. The rotation curve implies a dynamical mass of within the central kpc, and suggests that in this system the equivalent of the mass of a present-day bulge at the same radius was already in place by . Approximating the circular velocity of the halo by the measured asymptotic velocity of the rotation curve, we estimate a dark matter halo mass of , in good agreement with large-scale clustering studies of Lyman break galaxies. The baryonic collapse fraction is low compared to actively star-forming “BX” and low-redshift galaxies, perhaps implying comparatively less gas infall to small radii or efficient feedback. Even more speculatively, the high central mass density might indicate highly dissipative gas collapse in very early stages of galaxy evolution, in approximate agreement with what is expected for “inside-out” galaxy formation models.
1 Introduction
Dynamical mass estimates of high redshift galaxies are now starting to play a significant role in our developing understanding of galaxy assembly in the early universe, a trend that will likely become even more important in the near future. Directly measuring the dynamical masses from the spatially-resolved spectra of high-redshift galaxies is observationally very challenging, but dynamical masses are less prone to degeneracies and evolutionary bias than mass estimates based solely on photometry. Fascinatingly, they may also allow us to directly probe the baryonic and dark matter content and concentration of galaxies in the early universe, and to measure their angular momenta (Förster Schreiber et al., 2006). Ultimately, they will enable us, for example, to directly compare the growth of galaxy mass and angular momentum with model predictions as a function of redshift. Accurately measuring the kinematics of high-redshift galaxies is therefore a major step forward.
To realize these goals, we must show convincingly that the kinematics we measure in a high redshift galaxy have a simple proportionality to the mass distribution and rule out that they are dominated by the orbit or angular momentum loss of mergers or by hydrodynamical processes like, e.g., starburst-driven “superwinds” (Lehnert & Heckman, 1996a).
The Lyman-break technique has led to the largest sample of spectroscopically confirmed galaxies from z2.7 to 6.4. Despite our rapidly growing understanding of their ensemble properties, such as their luminosity function, clustering, and star-formation history (e.g., Steidel et al., 1996; Adelberger et al., 1998), our knowledge of their detailed intrinsic properties remains rather rudimentary. LBGs at z3 have typical radii of (Giavalisco, Steidel, & Macchetto, 1996) so that the spatially resolved kinematics are often difficult to obtain. Thus, dynamical mass estimates for individual LBGs at z3 (e.g., Pettini et al., 2001) are based mostly on line widths and only in a handful of cases have velocity gradients been observed. Spatially resolved LBGs are large compared to the overall population, and might be biased towards the strongest line emitting galaxies (e.g., vigorous starbursts) or early-stage mergers and perhaps are not representative for the overall population.
The only way to properly address these issues is to resolve the dynamics of an LBG on fine scale. Strongly gravitationally lensed LBGs are a promising way to probe small physical scales even with seeing-limited data. The ideal target would be a strongly-lensed, highly inclined LBG, where the kinematic major axis is roughly along a caustic. Such a configuration would allow several patches of the same galaxy, but at different radii, to be highly magnified to include the intrinsically low surface-brightness periphery. Probing non-lensed LBGs in this way is impossible given their generally small radii, faint magnitudes, and low surface brightnesses.
Unfortunately, strongly lensed LBGs with a favorable lensing geometry are exceedingly rare. Two cases at z1 have been studied in detail so far, MS1512-cB58 at z=2.8 (e.g., Teplitz et al., 2000; Pettini et al., 2002; Baker et al., 2004) and AC114-S2 at z=1.9 (Lemoine-Busserolle et al., 2003). However, the underlying dynamical mechanism is not conclusively revealed in either case. MS1512-cB58 is magnified by a factor , but it is compact and has no apparent velocity gradient (Teplitz et al., 2000) – most likely because of an unfavourable lensing geometry. From the mm CO emission line width, Baker et al. (2004) measure M⊙, not corrected for inclination. AC114-S2 has a velocity gradient (Lemoine-Busserolle et al., 2003), but is a merger with complex morphology, and its nature is not well constrained. That spatially-resolved spectroscopy of giant arcs can provide valuable constraints on the internal dynamics of the lensed galaxies has recently been shown by Swinbank et al. (2006) for a sample of 6 giant arcs at lower redshift, z1. Swinbank et al. found regular kinematics in 4 of the 6 galaxies, consistent with quiescently rotating disks, while in 2 galaxies, they observed complex line profiles of varying widths and irregular velocity structure suggestive of either mergers or outflows.
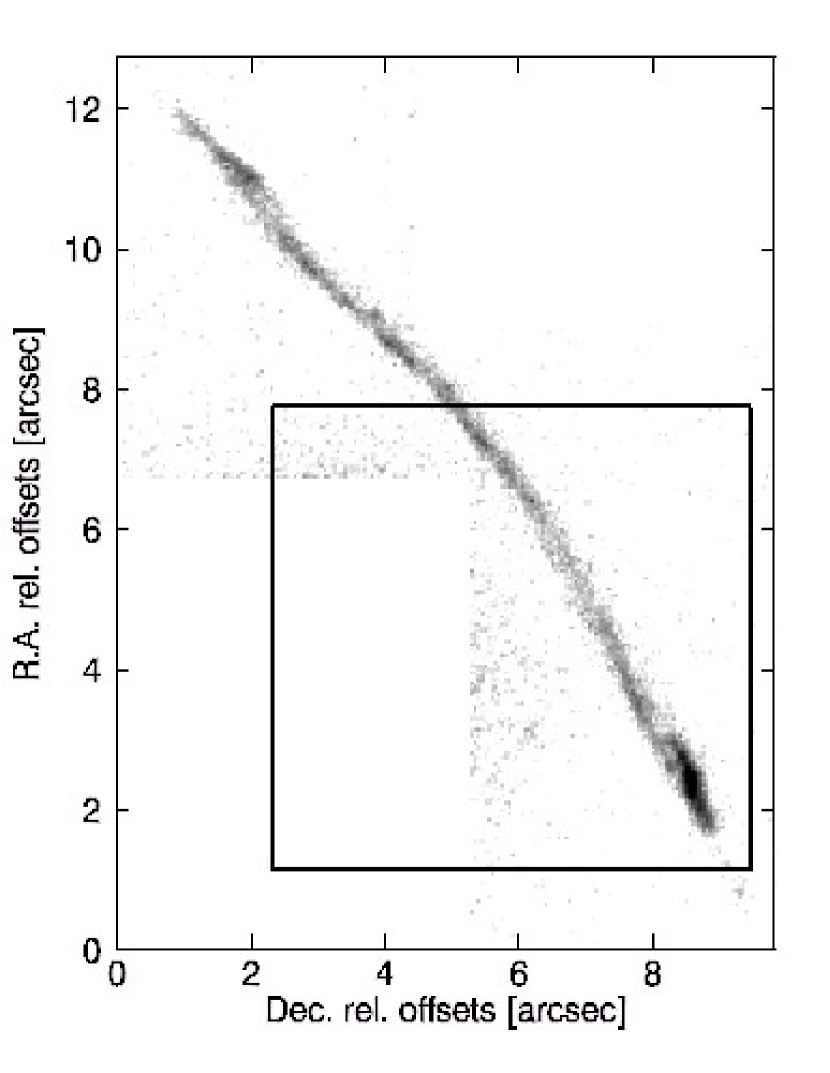
The strongly lensed z=3.24111We adopt a flat concordance cosmology with =0.7 and H0=70 km s-1 Mpc-1, in which DL=27.9 Gpc and DA=1.5 Gpc at . The size scale is 7.5 kpc/″. The age of the universe at this redshift and cosmological model is 1.9 Gyrs. “arccore” galaxy behind the z=0.3 X-ray cluster 1E0657-56 (Tucker et al., 1998) appears to be different from these well-studied high-redshift gravitational arcs. Its lensing configuration suggests the simultaneous magnification of a high surface brightness region at the south-eastern tip of the source that may be associated with the “core” of the galaxy as well as a more highly magnified, lower surface brightness region outside the core (“arc”; Mehlert et al., 2001). The total extent of the arc is 14″, and it has a complex substructure: Mehlert et al. (2001) identify 3 faint knots of similar surface brightness within the arc, each separated by a few arcseconds. They propose that the central highest surface brightness region of the lensed galaxy, lying near, but outside the cusp-caustic, is seen as the bright core, whereas a fainter outer region on one side of the same galaxy, which touches the cusp-caustic and is split into three merging images, constitutes the full extent of the arc. Thus the asymmetric magnified image comprising the near-nuclear region and peripheral patches originating on one side of the galaxy. The high magnification () presents an excellent opportunity to investigate the properties of a z3 galaxy at different radii with high physical and spatial resolution.
The paper is organized as follows: After presenting observations and data reduction in §2, we turn in §3 to the rest-frame UV and optical properties, highlighting the high-resolution ACS morphology. We discuss the spatially-resolved rest-frame emission line kinematics extracted from three–dimensional data cubes obtained with the integral-field spectrograph SPIFFI in §4. This includes a detailed discussion of the 146 km s-1 velocity gradient in the core and its continuation in the arc. In §5, we present a detailed comparison with the internal dynamics of low-redshift spiral galaxies. In §6, we estimate the evolution and angular momentum of the arccore, before investigating the halo mass and the baryonic “collapse fraction” in §7. We summarize our results in §8 and draw a likely evolutionary scenario for LBGs.
2 Observations and Data Reduction
Given the interesting lensing configuration of the 1E0657-56 arccore galaxy and the wealth of supplementary data, we observed it with the near-infrared integral field spectrograph SPIFFI (Eisenhauer et al., 2000), using UT2 of the VLT (SPIFFI has since become part of the SINFONI instrument on UT4). We obtained deep K band spectroscopy of 1E0657-56 arc core, covering the core and neighboring parts of the arc. Observations in April 2003 were carried out under variable sky conditions, with a total integration time of 190 minutes. One “off” frame at a sky position was taken for each “on” frame in an off-on-on-off mode, with a spectral resolution of R at and using the scale of pixel-1. Individual exposure times are 600s.
Data reduction was performed extending the package of the standard IRAF (Tody, 1993) tools for reducing longslit spectra. Individual exposures were dark frame subtracted and flat-fielded using exposures of an internal calibration lamp. We identified bad pixels based on dark and flat-field frames, and replaced them by interpolations of the surrounding pixels (in all 3 dimensions). Rectification and wavelength calibration are done before night sky subtraction, to account for some spectral flexure between the frames. Curvature in each individual slit-let of each frame was measured and removed using an arc lamp, before shifting the spectra to an absolute (vacuum) wavelength scale with reference to the OH lines in the data.
To account for variations in the night sky emission, we normalize the sky frame to the average of the object frame separately for each wavelength before sky subtraction, masking bright foreground objects, and correcting for residuals of the background subtraction and uncertainties in the flux calibration by subsequently subtracting the (empty sky) background separately from each wavelength plane.
The three dimensional data cubes are then reconstructed, assuming that each slitlet covers exactly 32 pixels. They are spatially aligned by cross-correlating the collapsed cubes, and then combined, clipping deviant pixels. Telluric correction is applied to the combined cube. Flux scales are obtained from standard star observations. From the light profile of the standard star, we measure the FWHM spatial resolution to be in right ascension and declination, respectively.
Data taking and reduction of the rest-frame UV spectroscopy of the arc and core with Fors1 on the VLT was described by Mehlert et al. (2001). They also kindly provided their R-band data for the present work, which has a total exposure time of 3800 s and seeing of ″. Mehlert et al. (2001) give a full account of how these data were obtained and reduced. C. Forman-Jones and collaborators have recently obtained high-resolution imaging of the cluster 1E0657-56 through the F814W filter using the ACS camera onboard the HST. They kindly shared with us a protion of their full image containing the region around the arccore before publication.
3 High-resolution rest-frame UV Morphology
The ACS F814W image (Å in the rest-frame) shows the complex structure of this source in great detail (Fig. 1). Irregular high surface-brightness patches, perhaps star-forming HII regions, are seen in the arc, embedded in a more continuous structure with much lower surface brightness. The core has an overall higher surface brightness, with a bright, unresolved spot in the center, and two extensions of lower surface brightness in an S-like shape.
The spatial resolution of the image (obtained from the TinyTim package; Krist & Hook, 1997) is 0.09″ in both right ascension and declination. The arc and core are both spatially resolved in the direction perpendicular to the magnification axis. Deconvolved profile widths along the unlensed direction are 0.113″ (0.9 kpc) for the brightest part of the core, and ″ ( kpc) in the arc. Along the magnification axis, the central region of the core has a diameter of ″, about 4 times larger than the unlensed 0.113″ diameter perpendicular to it.222Strictly speaking, this is true only if the gravitational lens has an isothermal dark matter halo mass profile. However, the arccore galaxy lies near the Einstein radius, so the exact profile shape does not have much of an impact on this estimate. The full size of the core along the direction of magnification is 1.3″.
4 Spatially-Resolved Spectroscopy and Internal Kinematics
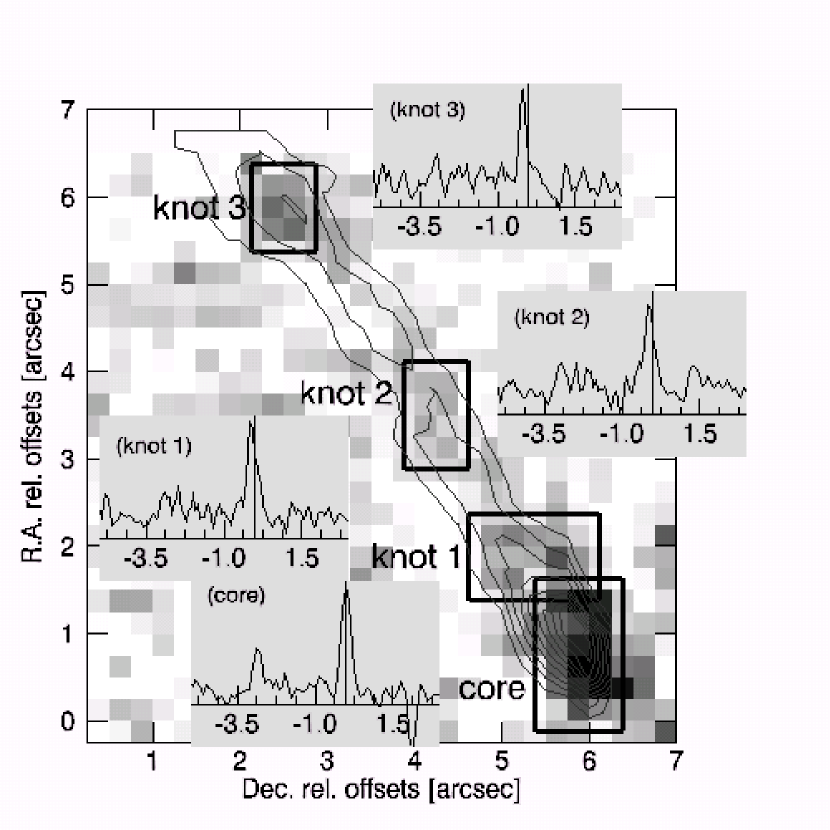
Since the lensing direction is roughly along the vertical axis of the cube, and the SPIFFI data are not spatially resolved in the perpendicular direction, we simply extract spectra from each individual pixel row or slitlet which lie along this direction. The core is a bright [OIII]5007 line emitter, with in each spectrum, and uniform dispersions of km s-1. Fitting the centroids of the [OIII]5007 emission line, we find an overall velocity gradient of 146 km s-1 over a total physical distance of kpc for . Extracting spectra from the 3 knots indicated by the boxes in Fig. 2 yields offsets relative to the core of km s-1, km s-1, and km s-1. The latter value might be somewhat influenced by a night sky line residual.333 We only state observed velocities, and do not correct for inclination with the line of sight (), because of the large uncertainties related to geometrical distortions of the gravitational lens. Moreover, the lensing implies another correction factor , to account for the inclination between the kinematic major axis of the arccore galaxy and the magnification axis. All relative velocities in this paper are therefore projected velocities, . We will therefore use the average of and to estimate the rotation velocity in the peripheral regions of the arccore galaxy, km s-1.
4.1 Evidence for Disk Rotation at
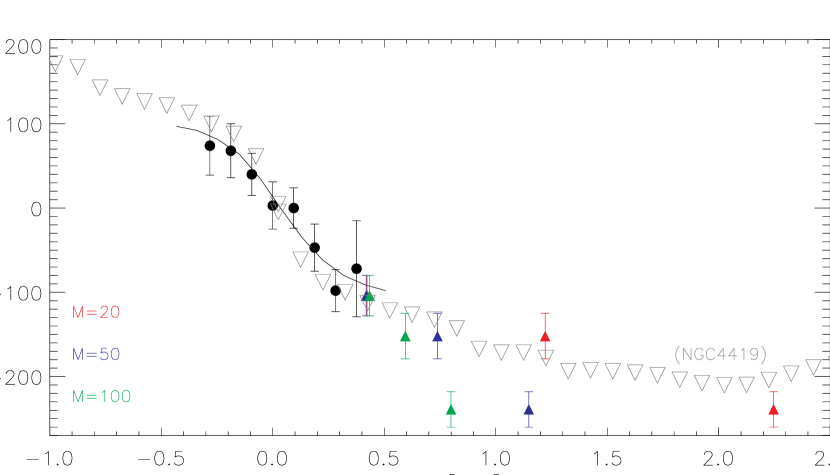
We show the velocity curve of the arccore in Fig. 3. Unfortunately, both the cluster potential and influence of nearby galaxies are not known accurately enough to allow for a robust magnification estimate. Thus in Fig. 3 we show the velocity curve for a range of assumed magnifications to illustrate this relative uncertaintly. Velocities in the arccore decrease monotonically from South to North in the core (i.e., within the central 1 kpc) and arc (over a distance of ″ or 2.5 kpc). Thanks to the large magnification and bright line emission in the core, we can trace the velocity gradient even within the core over 2.3″, or seeing disks, so correlations due to overlapping seeing disks within the data are negligible. Moreover, this causes the ratio of velocity gradient km s-1 and central velocity dispersion, km s-1, , to not depend on seeing. We overlay the rotation curve for the local galaxy, NGC4419 (Fig. 3). This shows indeed that the velocity curve of the arc core is very similar to that of local nearby galaxies like NGC4419. NGC4419 was chosen for this purpose because its asymptotic velocity matches that measured for the arccore particularly well.
4.2 Alternative Models: The AGN, Wind, and Merger Hypothesis
Due to the anisotropic lensing, we cannot use the full two-dimensional velocity field of the arccore galaxy to distinguish rotation from alternative models of the origin of the line emission such as an AGN or starburst driven wind, or a merger of two galaxies. We therefore base our arguments on the whole of the rest-frame UV (Mehlert et al., 2001) and optical (this paper) spectral properties.
For a luminous AGN we would expect several characteristic bright emission lines in the rest-frame UV spectrum, such as NV1240, SiIV+O IV]1400, CIV1549, C III]+SiIII]1900, etc. Instead Mehlert et al. (2001) observe an absorption line spectrum which is typical of an actively star-forming high-redshift galaxy. The optical emission lines are narrow, FWHM km s-1 (see Table 2), with constant (within the uncertainties) line profiles, line ratios ([OIII]/H), and equivalent widths across both the arc and core. None of these properties provides an indication of the arccore galaxy hosting a UV/optically bright AGN
If the kinematics of the emission line gas were dominated by superwinds (e.g., Lehnert & Heckman, 1996a), one would not expect the line emission to have the same morphology as the bright continuum emission. Line emission in the arccore galaxy generally follows the continuum morphology, arguing against the superwind hypothesis. To quantify this, we have compared the equivalent widths in the arccore with a sample of 12 low redshift, low metallicity galaxies with active star-formation taken from Storchi-Bergmann et al. (1995). Rest-frame H and [OIII]5007 equivalent widths in the arc and core are for H and [OIII]5007, respectively, W(H)arc = 22 Å, W(H)core=46 Å, W([OIII]5007)arc = 89 Å, W([OIII]5007)core =171 Å. These values are within the broad range of equivalent widths measured in the integrated spectra of the low redshift sample of Storchi-Bergmann et al. where the line emission is not dominated by superwinds.
[OIII]5007/H line ratios increase by up to 1 dex with increasing distance from the galactic disk in galaxies exhibiting superwinds due to the (relative) dominance of shock ionization at large distances from the disk (e.g. Dahlem et al., 1997; Moran et al., 1999), even when a strong wind is projected onto the galaxy continuum (Devost et al., 1997, measure a variation of 0.3 dex in in the low metallicity dwarf galaxy, NGC1569). The arc and core span a few kpc in the source plane, so that we would expect a change in line ratios if the emission was arising from the wind. We find however insignificant differences in [OIII]/H line ratios, ([OIII]/H) 2.53 and ([OIII]/H) 2.48 in the arc and core, respectively. This of course does not imply the general absence of a superwind in this galaxy, it only indicates that the cores of the optical emission lines are not dominated by an outflow. We find a similar situation in the z=2.57 strongly star-forming submillimeter galaxy SMMJ14011+0252 (Nesvadba et al. 2006, in preparation).
To investigate whether the kinematics of the arccore could be due to a merger, we have constructed a Monte Carlo simulation, evaluating the likelhood that two unrelated LBGs have similar R-G colors as that observed by Mehlert et al. (2001) for the arc and core. To make this comparison, we used the RG color distribution of Shapley et al. (2001) as reference distribution for the colors of LBGs. In 95% of all cases, color differences between two random pairs of LBGs are larger than (RG)0.39 – the 1 uncertainty of the RG color difference between the arc and the core. Moreover, the light distribution appears very smooth and contiguous in the ACS image with ″ resolution. This means that either the light profiles of two merging galaxies would have to overall be very similar, or that their physical separation would have to be less than 40 pc. Given the regularity of the surface brightness distribution in the ACS image (Fig. 1), this seems highly unlikely. The uniform line widths and [OIII]/H ratios in the arc and core indicate similar gravitational potentials and overall gas ionization (excitation and metallicity). In addition, if this were a merger, then the absence of obvious irregularities in the velocities and line widths as a function of projected position would be puzzling given the high physical resolution due to the strong lensing and the reasonable number of independent resolution elements across the arccore. Moreover, the good agreement of the position velocity diagram with the rotation curve of NGC4419 requires that the velocity difference, rotation speeds, positions and relative orientation of two merging galaxies are very well matched. This fine tuning of several degrees of freedom makes the merger scenario highly unlikely.
5 Dynamics and evolutionary stage
5.1 Dynamical Mass Estimates and Mass Surface Density
Sofue et al. (2003) studied the properties of rotation curves of nearby disk galaxies and found that low-mass spiral galaxies tend to rotation speeds that increase out to larger radii (up to several kpc) than do the more massive disk galaxies. However, the rotation curves of most galaxies, regardless of mass, appear to rise out to a few hundred parsecs and this rise corresponds roughly to the region consisting of the bulge of the galaxy. In Fig. 3, we show the high-resolution CO rotation curve of the nearly edge on () NGC4419, a dwarf SBa galaxy in the Sofue et al. (2003) sample with a very similar position-velocity diagram as the arccore. If the magnification in the arc does not strongly exceed the , then the two curves agree remarkably well.
Although this excellent agreement is coincidental, it is illustrative to compare the properties of the arccore galaxy and NGC4419. The mass of NGC4419 within kpc is M⊙, whereas at kpc, the enclosed mass is M⊙(Sofue et al., 2003). As noted earlier, this does emphasize that interpreting the velocity curve of the arccore as a rotation curve is justifiable. More specifically, the ACS morphology and velocity gradient of the arccore galaxy are at least consistent with the assumption that this is a disk galaxy seen nearly edge-on.
We fit the velocity curve of the core with a simple exponential disk model, accounting for the seeing, magnification by the gravitational lens (), and coarse sampling of our data. The simulated data were extracted in the same way as our observational data. We obtain a robust fit for a mass of M⊙ within a radius kpc, assuming an edge-on thin disk parallel to the lensing axis with no bulge, and similar disk scale-length as the typical LBG at z3. Extrapolating this fit out to kpc (the typical half-light radius of LBGs, Giavalisco, Steidel, & Macchetto, 1996), we find M⊙. Since it is difficult to place firm constraints on the inclination, we leave it unconstrained, and only note that, statistically, the mass will be a factor of 2 higher. We also measure a relatively large velocity dispersion in the core. If the dispersion is indeed due to the gravitational potential, then a significant part of the total kinetic energy might be in random motions, adding another factor to the true dynamical mass (or M⊙). Our mass estimate suggests a somewhat lower mass than the M⊙ mass of the lensed LBG MS1512-cB58 that Baker et al. (2004) estimate from CO line width, but agrees within factors of a few. It is also consistent with estimates of LBG masses based on emission line velocity dispersions (such as, e.g., the estimate of Pettini et al., 2001, assuming a pressure-supported spheroidal mass distribution). The agreement becomes better if we apply the method of Pettini et al. (2001) and measured velocity dispersions in the arccore. Using the km s-1 of the high surface-brightness core (which would dominate the spectrum if the source was not gravitationally lensed), we estimate a dynamical mass M⊙ ( M⊙, if we use the integrated line emission from the arc and the core.) Given that we are estimating the dynamical mass within roughly a half-light radius for the typical LBG at z3, it also agrees well with the mass estimates based on SED fitting (Shapley et al., 2001).
Since LBGs have co-moving densities similar to local luminous () galaxies, high star-formation rates, and complex morphologies, Steidel et al. (1996) argued that they represent the formation of the spheroidal component of massive galaxies. Our results have some bearing on this issue. The similarity with the rotation curves of local spiral galaxies, e.g., NGC4419, comprises the rise and overall shape within kpc radius, where we have a robust lensing model, and out to kpc with somewhat larger uncertainties related to the higher magnification. The low-redshift, galaxies in Sofue et al. (2003) have an average (and rms) mass within 0.5 kpc of 2.92.0109 M⊙(which range from 108 to 7 109 M⊙), similar to our M⊙, including the statistical inclination correction. Obviously, due to the similar rotation velocities and sizes, the mass surface densities of the core and local comparison sample are also very similar: 3103 M⊙pc-2 for the core and 3.72.6103 M⊙pc-2 for the average and rms in the Sofue et al. sample.
These similarities lend support to the conclusion of Steidel et al. (1996) that in fact LBGs could be the inner spheroid component during a period of rapid growth. More subtly, this implies that perhaps the full mass of the central few kpcs (bulges?) of present-day galaxies was already in place by . Given the results of Baker et al., the central few kpc are probably mostly in a gaseous phase and not a complete stellar bulge. We discuss these hypotheses in more detail below.
5.2 Stellar population, star-formation rates and chemical enrichment
We constrain the stellar population from the rest-frame UV spectrum of Mehlert et al. (2001). A detailed assessment of the UV absorption line spectrum is difficult because of inadequate signal-to-noise ratio and strong night sky lines at the wavelengths of some of the important diagnostic absorption lines. However, we obtain a good fit to the overall spectral energy distribution for rest-frame UV wavelengths between Å using STARBURST99 (Leitherer et al., 1999) for a model with a 60-110 Myr old stellar population and low extinction. Our data are not sufficient to explicitly measure the extinction. In the following, we therefore use the average E(B-V)0.17 found by Shapley et al. (2001) for a sample of LBGs with similar Ly emission line equivalent width, although our SED fitting formally suggests no extinction.
Such a model correctly predicts the K-band continuum magnitude we observe with SPIFFI (K), and implies a stellar mass M⊙. Convolving the Mehlert et al. (2001) spectrum with the filter transmission curves of Steidel et al. (2003) to select Lyman break galaxies verifies that the arccore formally fulfills the color criterion for LBGs (including the fact that the lensing-corrected magnitude fullfill the spectroscopic magnitude limit used in selecting LBGs by Steidel and collaborators; Steidel et al., 2003). In Table 1 we compare the measured properties of the arccore galaxy with averages of the general LBG population, which indicates the arccore is in fact a LBG.
The mass-to-light ratio sets powerful constraints on the nature of a stellar system. Assuming a typical E(BV)0.17 mag (Shapley et al., 2001) for the arccore galaxy, we find , correcting for a magnification . This is consistent with a Myr old stellar population. The gross agreement between and the age derived from fitting the UV continuum indicates that the total uncertainties in our dynamical mass estimates and the gravitational magnification cannot be off by more than factors of a few.
Since our rest-frame optical data and the rest-frame UV spectroscopy of Mehlert et al. (2001) do not indicate the presence of an AGN, we can use the measured integrated H flux of the arccore galaxy, ergs s-1 cm-2 (see Table 2) to estimate the star-formation rate. Assuming a magnification factor and an intrinsic ratio of , we estimate a star-formation rate M⊙ yr-1 for the arccore, but with considerable uncertainty. If using a more realistic IMF (e.g., a Kroupa IMF) instead of the calibration of Kennicutt (1998) with mass limits of 0.1 M⊙ to 100 M⊙ for a Salpeter IMF, the star-formation rate would be about a factor of 1.6 to 2.5 lower. However, the intrinsic H flux might be somewhat higher, because parts of the galaxy might not be lensed (especially in the periphery) or we have not observed every lensed component. Moreover, H might suffer strong underlying absorption from the stellar population with an age of Myr.
We also constrain the gas-phase oxygen abundance, based on the classical estimator (; Pagel et al. 1979). Since we have not measured [OII]3727, we use the correlation of [OII]3727/[OIII]5007 with [OIII]5007/H given by Kobulnicky et al. (1998) for low-metallicity galaxies to estimate the most likely [OII]3727 flux. We measure [OIII]/H = 3.9, corresponding to an upper limit of log , and log R = 0.990.2, if we include the average of Kobulnicky et al. (1998). This corresponds to an oxygen abundance of , including all uncertainties and the double valued nature of . Relative to the solar oxygen abundance of Allende Prieto, Lambert, & Asplund (2001), the best-fit value corresponds log log =0.40.3. Mehlert et al. (2002) estimated the metallicity of the core from the CIV1550 rest-frame equivalent width, WÅ. Accounting for uncertainty in their measurement, 0.3 dex scatter in their abundance calibration, and a different solar oxygen abundance, their CIV equivalent width implies an oxygen abundance of =1.00.4. Both abundance estimates agree within 1.
6 Dynamical Time, Evolutionary State, and Angular Momentum
By combining the star-formation rate and kinematic measurements, we can constrain the evolutionary state of the inner region of the 1E0657-56 core. The observed relative velocities imply an orbital timescale of:
| (1) |
Starbursts in local galaxies typically last for several orbital timescales (e.g., Lehnert & Heckman, 1996b; Kennicutt, 1998; Förster Schreiber, Genzel, & Lutz, 2003), about 10 to a few 100 Myrs. Generally speaking, LBGs have properties similar to low redshift starburst galaxies (e.g., Meurer et al., 1997), and given that the core has a similar orbital time, by analogy, we assume that the LBG phase will have a similar length. This limits the total length of the starburst in the 1E0657-56 “core” to a few 100 Myrs. Of course, it may already be at the end of its burst – the dynamical estimate only sets a likely upper limit.
Our result agrees with what little is known about the molecular gas content of LBGs. Baker et al. (2004) found a large reservoir of molecular gas in the lensed LBG MS1512-cB58, sufficient to sustain intense star-formation over several orbital time scales. E.g., assuming a gas fraction of , star-formation at a rate of 11 M⊙ yr-1 could be sustained for Myr. From spectral energy distribution (SED) fitting of a sample of LBGs, Shapley et al. (2001) found a median star-formation time scale of 300 Myrs. This is in rough agreement with our dynamical time estimate, and a few times larger than the Myrs we find for the age of stellar population in the arccore. Of course this can only provide only limited support for this general argument given the degeneracies between age and extinction and the lack of a unique fit to any SED given the wide range of possible and plausible star-formation histories.
Within the context of models where galaxies grow hierarchically, angular momentum in galaxies is a result of tidal torgues from neighboring mass concentrations (Peebles, 1969). In ()CDM, these torques are generated by merging dark matter halos (White, 1984). If this hypothesis for the generation of angular momentum is correct, then our observed rotation curve in the arccore is a direct link to the spin and specific angular momentum of the dark matter halo. We observe a significant amount of specific angular momentum in the arccore, namely,
| (2) |
where Rd is the e-folding radius of the light profile, and Vcirc is the circular velocity of the disk. The light profile of the arccore is not consistent with an exponential disk, which is perhaps not surprising given the complex lensing configuration. Ravindranath et al. (2004) find that exponential light profiles dominate their sample of actively star-forming galaxies in the HST Ultra Deep Field. If the arccore is a typical LBG, then the magnification is likely not a simple cut along the radius of the galaxy. Therefore, we simply estimate the specific angular momentum at the approximate radius for which we have direct measurements (i.e., kpc, similar to the typical half-light radius of an LBG; Giavalisco, Steidel, & Macchetto, 1996). The specific angular momentum is within the lower tail of the specific angular momentum distribution of local spiral galaxies (102.8-3.6 h km s-1 kpc at vc200 km s-1, see e.g. Abadi et al., 2003, and references therein). Although the arccore is at the low end of the distribution, formally it is consistent, and most of the difference can be attributed to the generally larger radii over which the specific angular momenta of local disks are estimated (which for the flat part of the rotation curve increases linearly with radius). Moreover, simple models of the evolution of the angular momentum of dark matter halos predicted a decrease in angular momentum with increasing redshift (jhalo(z)(1+z)-1.5 for an isothermal halo with a binding energy consistent with simple kinetic theory, i.e., EbindingMhaloV, where V is the circular velocity of the halo at the virial radius; see Mo, Mao, & White, 1998; Förster Schreiber et al., 2006).
7 Halo Mass and Baryonic “Collapse Fraction”
The large specific angular momentum observed in local disk galaxies is difficult to explain, unless by postulating that the specific angular momentum of the gas is roughly conserved during collapse and similar to the specific angular momentum of the dark matter halo. This is closely related to the well-known “angular momentum problem” and it is not a trivial issue. Given the specific angular momentum of the arccore is similar to local spirals, we are tempted to estimate the dark matter halo mass of the arccore galaxy from the kinematics of the emission line gas within the formalism of the hierarchical model (Förster Schreiber et al., 2006). Hypothesizing that the specific angular momentum of the arccore approximately reflects that of the halo, would imply that we can estimate the dark matter halo mass using the observed kinematics of the arccore. With the virial formula of, e.g., Mo, Mao, & White (1998), and the measured circular velocity over a radius of a few kpc (about 190 km s-1), we find,
| (3) |
Based on correlation amplitudes and number densities of LBGs at , Adelberger et al. (2005) estimate dark matter halo masses of M☉, similar, within , to our estimate using the kinematics of the arccore. This suggests that the measured circular velocity roughly approximates the virial velocity of the dark matter halo. Förster Schreiber et al. (2006) found a similar result in a study of UV-selected galaxies at z2.
We find a low dynamical mass for the arccore compared to the large dark matter halo mass, but within the range of dynamical masses that Pettini et al. (2001) found for a larger sample of LBGs with measured velocity dispersions. This indicates that in the general LBG population, only a small fraction of the total available baryons have likely collapsed to the center of the halo. Our best-fit mass estimate for the arccore is M⊙ within 2 kpc (i.e., within a typical half-light radius of an LBG at z3.2, see Bouwens et al., 2004; Giavalisco, Steidel, & Macchetto, 1996), which implies a log ratio of baryonic to dark mass of dex or to 2%. This is actually a lower limit since we have not accounted for a contribution of dark matter within 2 kpc of the dynamical center.
We can use results from the literature to repeat this comparison with a complementary approach, in analogy to the analysis of Adelberger et al. (2005) for UV-selected star-forming galaxies (“BM/BX”). Using the halo mass deduced from the measured large-scale distribution and the typical stellar mass of LBGs derived from multi-color photometry, (Shapley et al., 2001), we find a ratio of baryonic to dark matter masses of log =1.60.4 or 1-6%. Given the large uncertainties in any such estimate, this is in good agreement with the proceeding results based on dynamical mass estimates.
The best-fitting cosmological parameters imply that the fraction of baryonic to total mass is about 0.17 (e.g., Spergel et al., 2003). If we take our estimates literally, then this will imply that only % of the baryons in a typical z3 LBG have already collapsed to . For the Milky Way, the ratio of total baryonic to dark mass is 0.080.01 (e.g., Cardone & Sereno, 2005). Adelberger et al. (2005) and Förster Schreiber et al. (2006) find a value similar to the Milky Way in the “BM/BX” galaxies. The halos of the Milky Way and the BM/BX galaxies have very similar mass and exceed the typical mass of a LBG halo by only about a factor 3 (Adelberger et al., 2005).
Finding such a low value in comparison with other galaxy populations at low and high redshift implies that the “baryonic collapse fraction” of LBGs is generally lower. This suggests that LBGs perhaps formed relatively inefficiently or have particularly strong feedback making the collapse appear relatively inefficient. Direct evidence for LBGs having significant outflows is substantial (Adelberger et al., 2003; Shapley et al., 2003), supporting the later hypothesis. The rather small differences in the halo masses and large differences in the collapse fraction might be evidence that the collapse of baryons or feedback have a strong impact on galaxy evolution in general, and that merging of dark matter halos is not the only significant parameter in determing the characteristics of galaxies.
8 Summary and A Plausible Evolutionary Scenario for LBGs
We presented an analysis of the strongly lensed () Lyman break galaxy 1E0657-56 arccore galaxy at redshift , based on SPIFFI integral-field rest-frame optical spectroscopy, complemented with rest-frame UV imaging and spectroscopy. This galaxy is an excellent target for studying the fine spatial details of a Lyman break galaxy. We extracted the rest-frame UV colors of the arccore from the deep FORS spectroscopy of Mehlert et al. (2001), and measured directly that the galaxy fulfills the Lyman break criterion, including the mag limit, imposed on spectroscopically identified sources, for an unlensed source. The arccore is near the peak of the LBG redshift distribution, and its unmagnified size, optical emission line properties, mass-to-light ratio, and stellar age are within the range estimated for the overall population. Therefore, it is particularly well suited for a detailed analysis of its small-scale properties. We find a slightly lower star-formation rate than average, most likely due to our uncertain extinction estimate, likely underlying H absorption, or missing flux by not accounting for unlensed or multiply lensed regions of the galaxy.
Through studying magnified high surface brightness regions of an LBG at , we can investigate the structure and nature of LBGs at high physical resolution. The dynamical mass within 500 pc is about M⊙, while at about 2 kpc radius (approximately the half-light radius of a typical LBG, e.g., Giavalisco, Steidel, & Macchetto, 1996), the mass is similar to the average stellar mass M⊙of LBGs. Stellar masses derived from SED modelling include light at larger radii and make assumptions about the initial mass function that may be unwarranted and generally lead to higher masses (Förster Schreiber et al., 2006), so any discrepancy is not totally unexpected. However, our estimated mass of the core is also typical for the bulges of local spiral galaxies. In addition, the arccore has a specific angular momentum similar to that of local spiral galaxies.
The combination of mass surface density, metallicity and the dynamical time perhaps suggests an interesting evolutionary picture for the 1E0657-56 arccore. Since the properties of the 1E0657-56 arccore are well within the typical range of LBGs, this outline of the evolution of the 1E0657-56 arccore might, with some caution, be applicable to LBGs generally.
Compared to local spirals, most of the mass within 500 pc for the 1E0657-56 core appears to be already in place. However, the metallicity in the nuclei of low-redshift spirals is approximately solar, while we have found that the 1E0657-56 arccore has at most about half solar gas-phase abundances, and this estimate is clearly dominated by the emission from the core. We do not know the gas fraction of the 1E0657-56 arccore, however, CO observations of the lensed z2.7 LBG MS1512-cB58 by Baker et al. (2004) suggest that LBGs might be gas rich, with gas fractions of possibly up to 50%. For a simple closed box model with such high gas fractions, the metallicity will double within several 10 to 100 Myrs. This time estimate likely increases by factors of a few if including outflows or inflows with the metallicity of the intergalactic medium at . Our orbital time estimate suggests that the intense star-formation is likely to last long enough to increase the metallicity to about solar.
Because LBGs have similar co-moving densities as local luminous () galaxies, Steidel et al. (1996) suggested that they represent the formation of the spheroidal component of massive galaxies. Our analysis suggests that this hypothesis is plausible since we measure a mass and mass surface density similar to local spiral galaxies, and also fulfill the metallicity constraint, after allowing for further evolution in the on-going episode of intense star-formation. Moreover, the low baryon collapse fraction within might hint that a substantial amount of gas resides on larger scales within the halo (maybe gas blown out during intense star-formation or pre-enriched material from the IGM). However, we also find , significantly larger than the of bulges (Kormendy & Kennicutt, 2004, and references therein). Thus, if the arccore is representative of the overall population, LBGs will have to lose factors of a few in their circular velocities to have ratios consistent with local bulges, and certainly substantially more angular momentum to evolve into massive ellipticals.
Currently, very few models address the evolution of individual disk galaxies within the context of the hierarchical model in detail, which makes a quantitative comparison rather difficult. Overall, models of the formation of large scale structure and the evolution of galaxies within a CDM cosmology favour “inside-out” galaxy evolution, where the inner regions of galaxies form earlier than the peripheries (e.g., Samland & Gerhard, 2003; Abadi et al., 2003). Such a scenario quite naturally explains observations at low redshift, such as metallicity and stellar population (age) gradients observed in local galaxies.
Although these models produce inner regions of galaxies that collapse relatively early, unfortunately they also predict that only a relatively small amount of mass will be in place by compared to the final mass of the galaxy. Most of the mass at small radii is acquired rather late, more likely around redshifts of-order (Samland & Gerhard, 2003). However, as emphasized by Immeli et al. (2004), the timing and spatial distribution of the star-formation “history” depends crucially on the infall history and on how efficiently the kinetic energy gained from dynamical and mechanical heating during collapse is dissipated. They show that the gas in galaxies with large dissipation efficiency will strongly fragment, and interactions between individual subclumps and dynamical friction will make the fragments coalesce to the central regions more rapidly. In other words, the efficiency of dissipation and fragmentation may essentially be a free parameter which could be constrained observationally.
In comparison to local spiral galaxies, we find in the arccore at a significant and comparable mass surface density, while the overall relative mass is rather low. In light of the models already discussed, this might indicate highly dissipative gas collapse during the earliest phases of galaxy evolution. The later evolution and perhaps the formation of the disk might either be driven by infall of material (e.g., Samland & Gerhard, 2003) or by the merger of gas rich galaxies supported by strong feedback to prevent the baryons from collapsing into the central regions (e.g., Robertson et al., 2005). The latter of these hypotheses might explain the apparent inefficiency of the baryon collapse of the z3 LBGs compared to galaxies at lower redshift.
References
- Abadi et al. (2003) Abadi, M. G., Navarro, J. F., Steinmetz, M., & Eke, V. R. 2003, ApJ, 591, 499
- Allende Prieto, Lambert, & Asplund (2001) Allende Prieto, C., Lambert, D. L., & Asplund, M. 2001, ApJ, 556, L63
- Adelberger et al. (1998) Adelberger, K. L., Steidel, C. C., Giavalisco, M., Dickinson, M., Pettini, M., & Kellogg, M. 1998, ApJ, 505, 18
- Adelberger et al. (2003) Adelberger, K. L., Steidel, C. C., Shapley, A. E., & Pettini, M. 2003, ApJ, 584, 45
- Adelberger et al. (2005) Adelberger, K. L., Steidel, C. C., Pettini, M., Shapley, A. E., Reddy, N. A., & Erb, D. K. 2005, ApJ, 619, 697
- Appenzeller et al. (1998) Appenzeller, I., et al. 1998, The Messenger, 94, 1
- Baker et al. (2004) Baker, A. J., Tacconi, L. J., Genzel, R., Lehnert, M. D., & Lutz, D. 2004, ApJ, 604, 125
- Bender et al. (1993) Bender, R., Burstein, D., & Faber, S. M. 1993, ApJ, 411, 153
- Borys et al. (2004) Borys, C., et al. 2004, MNRAS, 352, 759
- Bouwens et al. (2004) Bouwens, R. J, Illingworth, G. D., Blakeslee, J. P., Broadhurst, T. J., & Franx, M. 2004, ApJ, 611, L1
- Cardone & Sereno (2005) Cardone, V. F., & Sereno, M. 2005, A&A, 438, 545
- Dahlem et al. (1997) Dahlem, M., Petr, M. G., Lehnert, M. D., Heckman, T. M., & Ehle, M. 1997, A&A, 320, 731
- Devost et al. (1997) Devost, D., Roy, J.-R., & Drissen, L. 1997, ApJ, 482, 765
- Eisenhauer et al. (2000) Eisenhauer, F., Tecza, M., Mengel, S., Thatte, N. A., Roehrle, C., Bickert, K., & Schreiber, J. 2000, Proc. SPIE, 4008, 289
- Elmegreen et al. (2005) Elmegreen, B. G. 2005, Elmegreen, D. M., Vollbach, D. R., Foster, E. R., Ferguso, T. E., ApJ, in press, astro-ph/0510245
- Förster Schreiber, Genzel, & Lutz (2003) Förster Schreiber, N. M., Genzel, R., & Lutz, D. 2003, ApJ, 599, 193
- Förster Schreiber et al. (2006) Förster Schreiber et al. 2006, submitted to ApJ
- Fosbury et al. (2003) Fosbury, R. A. E., et al. 2003, ApJ, 596, 797
- Franx et al. (1997) Franx, M., Illingworth, G. D., Kelson, D. D., van Dokkum, P. G., & Tran, K. 1997, ApJ, 486, L75
- Giavalisco, Steidel, & Macchetto (1996) Giavalisco, M., Steidel, C. C., & Macchetto, F. D. 1996, ApJ, 470, 189
- Heckman et al. (1998) Heckman, T. M., Robert, C., Leitherer,C., Garnett, D. R., & van der Rydt, F. 1998, ApJ, 503, 646
- Immeli et al. (2004) Immeli, A., Samland, M.,Gerhard, O., & Westera, P. 2004, A&A, 413, 547
- Kennicutt (1998) Kennicutt, R. C. 1998, ARA&A, 36, 189
- Kobulnicky et al. (1998) Kobulnicky, H. A., Kennicutt, R. C., Jr., & Pizagno, J. 1998, ApJ, 514, 544
- Kormendy & Kennicutt (2004) Kormendy, J. & Kennicutt, R. 2004, ARA&A, 42, 603
- Krist & Hook (1997) Krist, J. E., & Hook, R. N. 1997, The 1997 HST Calibration Workshop with a New Generation of Instruments, p. 192, 192
- Lehnert & Heckman (1996a) Lehnert, M. D. & Heckman, T. M. 1996a, ApJ, 462, 651
- Lehnert & Heckman (1996b) Lehnert, M. D. & Heckman, T. M. 1996b, ApJ, 472, 546
- Leitherer et al. (1999) Leitherer, C., et al. 1999, ApJS, 123, 3
- Lemoine-Busserolle et al. (2003) Lemoine-Busserolle, M., Contini, T., Pelló, R., Le Borgne, J.-F., Kneib, J.-P., & Lidman, C. 2003, A&A, 397, 839
- Mehlert et al. (2001) Mehlert, D., et al. 2001, A&A, 379, 96
- Mehlert et al. (2002) Mehlert, D., et al. 2002, A&A, 393, 809
- Meurer et al. (1997) Meurer, G. R., Heckman, T. M., Lehnert, M. D., Leitherer, C., & Lowenthal, J. 1997, AJ, 114, 54
- Mo, Mao, & White (1998) Mo, H. J., Mao, S., & White, S. D. M. 1998, MNRAS, 295, 319
- Moran et al. (1999) Moran, E. C., Lehnert, M. D., & Helfand, D. J. 1999, ApJ, 526, 649
- Pagel et al. (1979) Pagel, B. E. J., Edmunds, M. G., Blackwell, D. E., Chun, M. S., & Smith, G. 1979, MNRAS, 193, 219
- Papovich et al. (2001) Papovich, C., Dickinson, M., & Ferguson, H. C. 2001, ApJ, 559, 620
- Peebles (1969) Peebles, P. J. E. 1969, ApJ, 155, 393
- Pettini et al. (2001) Pettini, M., Shapley, A. E., Steidel, C. C., Cuby, J., Dickinson, M., Moorwood, A. F. M., Adelberger, K. L., & Giavalisco, M. 2001, ApJ, 554, 981
- Ravindranath et al. (2004) Ravindranath, S., Ferguson, H., Giavalisco, M., Dickinson, M., Papovich, C., & GOODS 2004, American Astronomical Society Meeting Abstracts, 205,
- Pettini et al. (2002) Pettini, M., Rix, S. A., Steidel, C. C., Adelberger, K. L., Hunt, M. P., & Shapley, A. E. 2002, ApJ, 569, 742
- Rix et al. (1997) Rix, H.-W., Guhathakurta, P., Colless, M., & Img, K. 1997, MNRAS, 285, 779
- Robertson et al. (2005) Robertson, B., Hernquist, L., Bullock, J. S., Cox, T. J., Di Matteo, T., Springel, V., & Yoshida, N. 2005, astro-ph/0503369
- Samland & Gerhard (2003) Samland, M. & Gerhard, O. E. 2003, A&A, 399, 961
- Shapley et al. (2001) Shapley, A. E., Steidel, C. C., Adelberger, K. L., Dickinson, M., Giavalisco, M., & Pettini, M. 2001, ApJ, 562, 95
- Shapley et al. (2003) Shapley, A. E., Steidel, C. C., Pettini, M., & Adelberger, K. L. 2003, ApJ, 588, 65
- Sofue & Rubin (2001) Sofue, Y., & Rubin, V. 2001, ARA&A, 39, 137
- Sofue et al. (2003) Sofue, Y., Koda, J., Nakanishi, H., & Onodera, S. 2003, PASJ, 55, 59
- Spergel et al. (2003) Spergel, D. N., et al. 2003, ApJS, 148, 175
- Steidel et al. (1996) Steidel, C. C., Giavalisco, Pettini, M., Dickinson, M., & Adelberger, K. L. 1996, ApJ, 462, L17
- Steidel et al. (1999) Steidel, C. C., Adelberger, K. L., Giavalisco, M., Dickinson, M., Pettini, M. 1999, ApJ, 519, 1
- Steidel et al. (2002) Steidel, C. C., Hunt, M. P., Shapley, A. E., Adelberger, K. L., Pettini, M., Dickinson, M., & Giavalisco, M. 2002, ApJ, 576, 653
- Steidel et al. (2003) Steidel, C. C., Adelberger, K. L., Shapley, A. E., Pettini, M., Dickinson, M., & Giavalisco, M. 2003, ApJ, 592, 728
- Storchi-Bergmann et al. (1995) Storchi-Bergmann, T., Kinney, A. L., & Challis, P. 1995, ApJS, 98, 103
- Swinbank et al. (2006) Swinbank, A. M., Bower, R. G., Smith, G. P., Smail, I., Kneib, J.-P., Ellis, R. S., Stark, D. P., & Bunker, A. J. 2006, MNRAS, 368, 1631
- Teplitz et al. (2000) Teplitz, H. I., et al. 2000, ApJ, 542, 18
- Tody (1993) Tody, D. 1993, ASP Conf. Ser. 52: Astronomical Data Analysis Software and Systems II, 2, 173
- Tucker et al. (1998) Tucker, W., et al. 1998, ApJ, 496, L5
- White (1984) White, S. D. M. 1984, ApJ, 286, 38
- Yee et al. (1996) Yee, H. K. C., Ellingson, E., Bechtold, J., Carlberg, R. G., & Cuillandre, J.-C. 1996, AJ, 111, 1783
| arccore | LBG | reference | |
|---|---|---|---|
| redshift | 3.24 | P01 | |
| [arcsec] | 0.1″-0.6″aa FWHM perpendicular to the magnification axis. | 0.3″ | G02 |
| [km s-1] | P01 | ||
| R [mag] | bb Intrinsic magnitude assuming .,dd core only | S03 | |
| age [ yrs] | 80 | 50-100 | S01 |
| SFR [M☉ yr-1] | 10cc From H with H/H=2.75. | cc From H with H/H=2.75. | P01 |
| 12+[O/H] | P01 |
| zone | line | z | FWHM | FWHMintr. | flux | ||
|---|---|---|---|---|---|---|---|
| (1) | (2) | (3) | (4) | (5) | (6) | (7) | (8) |
| total source | [OIII] | 5007 | 3.24390.0002 | 2.12490.0001 | 262 | 22921 | 20.0380.7 |
| total source | H | 4861 | 3.24530.0013 | 2.06370.0008 | 257 | 22361 | 6.70.7 |
| total arc | [OIII] | 5007 | 3.24230.0004 | 2.12410.0003 | 236 | 14637 | 4.30.4 |
| total arc | H | 4861 | 3.24420.0020 | 2.06310.0013 | 3534 | 423413 | 1.70.4 |
| total core | [OIII] | 5007 | 3.24460.0001 | 2.12530.0005 | 241 | 1608 | 11.70.2 |
| total core | H | 4861 | 3.24510.0012 | 2.06350.0008 | 3018 | 334201 | 4.70.2 |
| arc 1 | [OIII] | 5007 | 3.24330.0004 | 2.12460.0003 | – | – | 6.40.1 |
| arc 1 | H | 4861 | 3.24600.0010 | 2.06400.0006 | – | – | 1.750.6 |
| arc 2 | [OIII] | 5007 | 3.24270.0004 | 2.12430.0003 | – | – | 2.730.5 |
| arc 2 | H | 4861 | 3.24380.0010 | 2.06290.0007 | – | – | 1.480.4 |
| arc 3 | [OIII] | 5007 | 3.24190.0004 | 2.12390.0003 | – | – | 1.90.09 |
Note. — Column (1) – Regions as defined in Figure 2. Column (2) – Line identification. Column (3) – Rest-frame wavelengths in Å. Column (4) – Redshift for each line. Column (5) – Observed wavelengths in m. Column (6) – Full-width at half-maximum measured in Å. Due to the faint lines in the arc and a night sky line residual which might affect the blue [OIII]5007 wing, we do not give widths for the arc. Column (7) – Intrinsic FWHMs in km s-1, deconvolved to account for both the spectral resolution and smoothing (by 3 pixels). Column (8) – Line fluxes in units of 10-20 W m-2.