11email: haikala@astro.helsinki.fi 22institutetext: European Southern Observatory, Casilla 19001, Santiago, Chile
C18O (3–2) observations of the Cometary Globule CG 12: A cold core and a hot spot
The feasibility of observing the (3–2) spectral line in cold clouds with the APEX telescope has been tested. As the line at 329.330 GHz lies in the wing of a strong atmospheric H2O absorption it can be observed only at high altitude observatories. Using the three lowest rotational levels instead of only two helps to narrow down the physical properties of dark clouds and globules. The centres of two maxima in the high latitude low mass star forming region CG 12 were mapped in (3–2) and the data were analyzed together with spectral line data from the SEST. The (3–2)/ (2–1) ratio in the northern maximum, CG 12-N, is 0.8, and in the southern maximum, CG 12-S, 2. CG 12-N is modelled as a 120″ diameter (0.4pc) cold core with a mass of 27 . A small size maximum with a narrow, 0.8 , (3–2) spectral line with a peak temperature of 11 K was detected in CG 12-S. This maximum is modelled as a 60″80″ diameter (0.2pc) hot (80 K 200 K) 1.6 clump. The source lies on the axis of a highly collimated bipolar molecular outflow near its driving source. This is the first detection of such a compact, warm object in a low mass star forming region.
Key Words.:
clouds – ISM molecules – ISM: structure – radio lines – ISM: individual objects: CG 12, NGC53671 Introduction
The two lowest rotational transitions of , and have been used extensively for studies of dark clouds and globules. Also the lines of and can be routinely observed. In contrast, there are very few published observations of the transition. Besides the nine point (3–2) map of S106 (Little et al. 1995) and mapping of the centre of the pre-stellar cloud core L1689B (Jessop & Ward-Thompson (2001)) only pointed observations are available (e.g., Jørgensen et al. 2002, 2004; Schöier et al (2002); Lee et al. 2003). The addition of the (3-2) transition to the lower transitions would, however, substantially improve the accuracy of physical parameters derived from data as the relative line intensities depend heavily on the cloud temperature and density.
The SEST telescope has been used to map numerous southern molecular clouds in (1–0) and (2–1). The new Atacama Pathfinder Experiment (APEX111This publication is based on data acquired with the Atacama Pathfinder EXperiment (APEX). APEX is a collaboration between the Max–Planck–Institut für Radioastronomie, the European Southern Observatory, and the Onsala Space Observatory.) provides an excellent opportunity to complement these data with (3-2) observations. The APEX beam size at 329 GHz, 19″, is about equal to the SEST beam size at the (2–1) frequency, 24″. This simplifies the comparison of APEX and SEST data.
In this Letter we demonstrate the use of (3-2), (2–1) and (1–0) observations for radiative transfer modelling in the case of Cometary Globule 12, CG 12, which is a high-latitude star forming region at a distance of 630 pc (Williams et al. 1977). The head of the cloud contains a highly collimated bipolar outflow (White et al. 1993) and two compact maxima separated by about 3’ (Haikala & Olberg 2006, Paper I). The centres of these maxima were mapped in (3–2). Based on these observations a simple model is derived for both cores.
2 Observations and data reduction
The observations were made with APEX on Aug. 21 2005 in good weather (PWV 0.7 mm). The (3–2) line at 329330.546 MHz was observed with the APEX-2A SIS DSB receiver. The zenith optical depth was 0.27 and the DSB system temperature ranged from 180 K to 280 K. The receiver signal sideband lies in the wing of an atmospheric H2O absorption line whereas the mirror sideband centered at 335.330 GHz is at a more transparent frequency. The difference in the atmospheric opacities was estimated using an atmospheric model and was taken into account in the calibration.
Two 5 by 5 point maps with 10″ spacing were obtained in the position switching mode. Off positions (+5′ in azimuth for CG 12-N and +5′ in azimuth and +5′ in elevation for CG 12-S) were outside the globule at the time of the observations. CG 12-N was observed at elevations to and CG 12-S at to . Integration time of 20s was used and calibration was done every 10 to 30 minutes. Each position was observed two or three times. The map centre positions were integrated for a total of 250s. The 1 GHz bandwidth of the MPIfR Fourier transform spectrometer was divided into 16384 channels of 61 kHz ( 55 at 329 GHz).
Most of the observed spectra contain ripple due to variations in the atmospheric emission, reflections in the telescope optics and instability of the receiver. In the data reduction the possible low frequency ripple was first fit with a sinusoidal baseline where-after possible higher frequency ripple was removed by masking the corresponding frequency in Fourier transform space if possible. Finally a first order baseline was fit to the spectra around the source velocity and subtracted. The resulting rms of the spectra is by 15% higher than the value expected according to the radiometer formula indicating that the possible non white noise due to, e.g., remaining baseline ripple, does not dominate the spectral noise. The spectra were transformed to the main beam brightness temperature scale using a main beam efficiency of 0.7. All the spectral line intensities and line integrals reported in this paper are on the scale.
3 Results


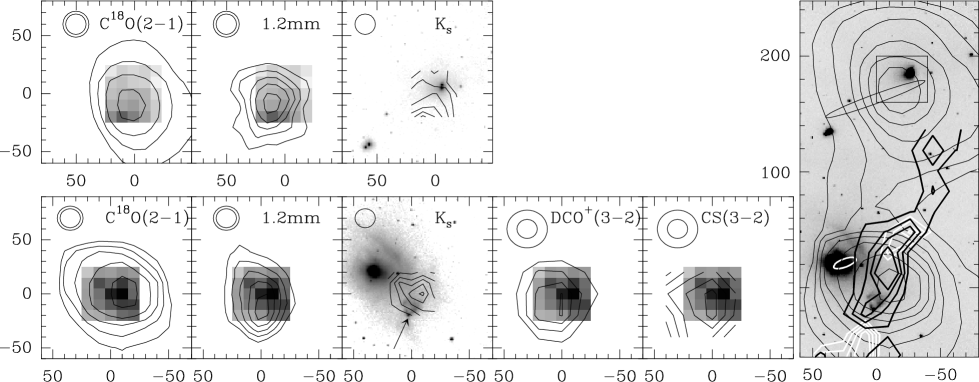

The hanning smoothed (3–2) spectra in CG 12-N and CG 12-S are shown in Figs. 1 and 2 together with the SEST (2–1) and (1–0) observations (Paper 1). The area mapped in (3–2) in each maximum covers only the SEST HPBW at 109 GHz, 47″, and the emission continues beyond the map boundaries. Maps of the (3–2) line integral are shown in Fig. 3 superposed on SEST molecular line and mm continuum maps and a NIR Ks (NTT SOFI) image.
CG12-N: In the southern part of the CG 12-N map the line profiles and intensities of all the observed transitions are similar. Elsewhere both the (3–2) line profile and line peak velocity vary more than in the (2–1) transition. The maximum is shifted to SE from the (2–1) (and also (1–0)) maximum and is located near the faint IRAS point source 12546-3941 (Fig. 3).
The three transitions together with the CS (3–2) and (2-1) lines in the CG 12-N map centre position are shown in Fig. 4. The lines are asymmetric but the profiles are similar. An unpublished (1–0) spectrum obtained in this position shows that the (1–0) line is optically thin. The weak ( K) CS line peaks at the same velocity as the lines. The line is redshifted with respect to the and CS lines.
CG12-S: The (3–2) emission peaks 10″ West of the CG 12-S map centre position. In contrast with CG 12-N, the (3–2) line is significantly stronger than (2–1) in the map centre, West and South-West. The maximum lies at the NW edge of the dense core outlined by the high density tracers ( (2–1), CS (3–2)) and the 1.2 mm continuum and on the axis of the outflow. It is likely that the driving source of the molecular outflow (White 1993) lies at the Southern tip of the cone-like NIR nebulosity seen in the Ks image at . The nature of the driving source is not known.
In the (3–2) map centre position two velocity components ( and , Paper 1) are blended and the lines are skewed (Fig. 4). Only the component emits strongly in , CS (2–1), CS (3–2) and (1–0) (Paper 1). However, in the component is the strongest. A two component gaussian fit with centre velocities fixed to and gives 7.6 K, 3.7 K and 1.7 K, respectively, for the (3–2), (2–1) and (1–0) peak temperatures for the component centred at . In (3–2) this component extends beyond the mapped area in the South-West (Fig 2). The source is elongated in the NE-SW direction but is hardly resolved perpendicular to this direction.
4 Discussion
The (3–2)/ (2–1) ratio () is 0.8 and 2 (the component) in CG 12-N and CG 12-S , respectively. Assuming LTE, these ratios would correspond to of 10 K in CG 12-N and 30 K in CG 12-S . Many of the line ratios in pre- and protostellar cores (Jørgensen et al. (2005) and references therein) are similar to those observed in CG 12-N. These line ratios were modelled with a “drop” model which assumes a strong molecular depletion in a cold shell (30 K) between the heating source and the outermost part of the envelope. The intensity of the lines in IRAS 16293-2422 is as high as observed in CG 12-S and is 1.3 (Schöier et al, 2003). The lines are, however, optically thick and, e.g., the CS(5-4) line is stronger than the (3–2) line. In CG 12-S the CS(5-4) line is not detected (Fig. 4).
It is evident from Figs. 1 and 2 that considerable fine structure in (3–2) is present both in intensity and velocity in the two mapped areas. However, the signal-to-noise ratio of the spectra is not high enough for a more refined analysis of the source structure than presented in Sect. 3. We therefore restrict our further analysis to constructing models which reproduce the observed line ratios and intensities in the (3–2) map central positions (Fig. 4) where the signal-to-noise ratio is best. In CG 12-S only the component is considered.
The reproducibility of the (1–0) and (2–1) spectral line intensities at SEST has been very good. The lines were also observed simultaneously and therefore the observed relative line intensities should be quite accurate. No such record is available for the APEX telescope and the receiver. We therefore assume a calibration accuracy of 20%.
Radiative transfer modelling was done with the Monte Carlo method (Juvela 1997) assuming a spherically symmetric geometry. The C18O maps were used to estimate the cloud radii, 60″ for CG 12-N and 35″ for CG 12-S. The density distribution adopted as a starting point was truncated at cloud radius. Power law temperature distributions were tested with temperature either increasing or decreasing towards the cloud centre. The model was fitted to the intensities and line widths of the observed C18O spectra (CG 12-N ) and to line temperatures fitted for the component (CG 12-S ). The spectra around the central position were used to constrain the radial density profile. The free parameters of the fit were the size of the inner region with constant density and temperature, and the parameters of linear scalings that were applied separately to the density and temperature values. The model spectra were convolved with gaussian beams that correspond to the resolution of the observations. Constant C18O abundance of 2.5 10-7 was used. The quality of the fit depends only weakly on the abundance which does, on the other hand, directly affect the mass estimates.
The resulting radial density and temperature profiles are shown in Fig. 5. For CG 12-N the -value is close to one. However, in the case of CG 12-S the -value is over five, mainly because the predicted intensity is only half of the observed value. Best fits in CG 12-S were obtained with models where the kinetic temperature increased inwards. One could obtain reasonable fits even with isothermal models. CG 12-N is modelled with a 120″ diameter cloud where the temperature decreases from 12 K down to 6 K at the edge. The CG 12-S data can only be fit with a small size, hot clump. The modelled total gas column density in the APEX beam and the cloud mass are and 27 for CG 12-N and and 1.6 for CG 12-S, respectively.
The models presented above should be considered only as indicative. Spherical symmetry was assumed and the (3–2) maps cover only the very centres of the maxima. Furthermore, the cloud sizes are close to the telescope beam size so that the beam convolution has a large effect on observed and calculated line ratios. Especially the CG 12-S fit is sensitive to the beam convolution. Different combinations of source size, temperature and density produce acceptable fits. The central density can not be increased much as the CS lines would become stronger than observed. Common to all of these solutions is the small size, a radius of 30″ to 40″, and high central temperature, 80 K to 200 K. The problem is, however, not unique for this source but inherent to all observing and modeling small size (compared to beam size) sources. The source beamfilling factor becomes an important modelling parameter.
If the outer parts of the CG 12-N cloud envelope are heated up, e.g, by interstellar radiation field (e.g., Snell 1981), this has very small effect to the fit at the cloud centre position. The gas column density in the cloud envelope is small compared to the central density from where the bulk of the emission is coming. The LTE mass ( 10 K) calculated from the (2–1) data within 60″ from the centre of CG 12-N is 25 which is in agreement with the modeled mass of 27 .
The LTE mass of the velocity component in CG 12-S calculated from (2–1) data within 35″ from the (3–2) map centre is 4.1 for 15 K. However, for 160 K the mass would be three times higher. The LTE method assumes that all energy levels are thermalized and this is clearly not the case in the CG 12-S model.

5 Conclusions
The addition of the (3–2) transition to the data on the two lower transitions restricts strongly the parameter space of possible cloud models.
The (3–2) observations of CG 12-N confirm the cold temperature of this core. The (3–2) line profile varies more over the mapped region than the (2–1) profile. The (3–2) line is therefore probably better suited for studying the small-scale stucture of molecular clouds than the lower transitions of this molecule.
The detection of high, 10 K, (3–2) line temperatures in CG 12-S was unexpected and forced us to reconsider the temperature and density structure of the material traced by (2–1) and (1–0) presented in paper 1. The small, hot clump lies projected on the edge of a dense core traced by . It also lies on the axis of a highly collimated bipolar molecular outflow near its driving source. This suggests that the two are related. As the lines from the hot spot are narrow and appear at the same radial velocity as the parent cloud, they probably do not originate in shocked gas. Neither is direct radiative heating from the strong IRAS point source 13547-3944 likely. The heating mechanism and the relation of the hot spot to the collimated outflow remain therefore unspecified. Further studies of this phenomenom seem warranted as they may lead to a better understanding of the interaction between newly born stars and the surrounding molecular material.
Better spatial resolution can be achieved by observing still higher transitions which should be detectable in CG 12-S. The sizes of the CG 12 maxima are well suited for the future ALMA interferometer
References
- Haikala and Olberg, (2006) Haikala, L. & Olberg, M. 2006, submitted to A&A, (Paper 1)
- Jessop & Ward-Thompson (2001) Jessop, N. E. & Ward-Thompson, D. 2001, MNRAS, 323, 1025
- Jørgensen et al. (2002) Jørgensen, J. K., Schöier, F. L., & van Dishoeck, E. F. 2005, A&A, 389, 908
- Jørgensen et al. (2005) Jørgensen, J. K., Schöier, F. L., & van Dishoeck, E. F. 2005, A&A, 435, 177
- (5) Juvela M. 1997, A&A, 322, 943
- Lee et al. (2003) Lee, J., Evans, N. J. II, Shirley, Y. L., & Tatematsu, K. 2003, ApJ, 583, 789
- Little et al. (1995) Little, L. T., Kelly, M. L., Habing, R. J., & Millar, T. J. 1995, MNRAS, 277, 307
- Schöier et al. (2002) Schöier, F. L., Jørgensen, J. K., van Dishoeck, E. F. & Blake, G. A. 2003, A&A, 390, 1001
- Snell (1981) Snell, R. L. 1981, ApJS, 45, 121
- White (1993) White G. 1993, A&A, 274, L33
- Williams et al. (1977) Williams , P.M., Brand, P.W.J.L., Longmore, A.J., & Hawarden, T.G. 1977, MNRAS, 181, 179