A Simultaneous Optical and X-ray Variability Study of the Orion Nebula Cluster. I. Incidence of Time-Correlated X-ray/Optical Variations111This study is part of the Chandra Orion Ultradeep Project (COUP).
Abstract
We present a database of time-series photometry of the Orion Nebula Cluster obtained with two ground-based telescopes at different longitudes to provide simultaneous coverage with the 13-d Chandra observation of the cluster. The resulting database of simultaneous optical and X-ray light curves for some 800 pre–main-sequence (PMS) stars represents, by a factor of hundreds, the largest synoptic, multi–wavelength-regime, time-series study of young stars to date. This database will permit detailed analyses of the relationship between optical and X-ray variability among a statistically significant ensemble of PMS stars, with the goal of elucidating the origins of PMS X-ray production. In this first paper, we present the optical observations, describe the combined X-ray/optical database, and perform an analysis of time-correlated variability in the optical and X-ray light curves. We identify 40 stars (representing 5% of our study sample) with possible time-correlated optical and X-ray variability. Examples of both positive and negative time-correlations are found, possibly representing X-ray flares and persistent coronal features associated with both cool and hot surface spots (i.e. magnetically active regions and accretion shocks). We also find two possible examples of “white-light” flares coincident with X-ray flares; these may correspond to the impulsive heating phase in solar-analog flares. However, though interesting, these represent unusual cases. More generally, we find very little evidence to suggest a direct causal link between the sources of optical and X-ray variability in PMS stars. The conclusion that accretion is a primary driver of X-ray production in PMS stars is not supported by our findings.
1 Introduction
The X-ray luminosities of solar-type stars, when they are very young, are prodigious. Indeed, it is now well established that low-mass pre–main-sequence (PMS) stars can emit X-rays at levels up to times that of the present-day Sun (e.g. Feigelson & Montmerle, 1999). But after two decades of research since T Tauri stars (TTSs) were first identified as strong X-ray sources (e.g. Feigelson & DeCampli, 1981), we still do not know the origins of X-ray production in young stars.
While flares observed in the X-ray light curves suggest that the X-rays are produced mainly in solar-analog magnetic reconnection flares, the absence of an obvious rotation-activity relation in these stars prevents a clear association of the X-rays to dynamo-generated fields (Flaccomio et al., 2003; Feigelson et al., 2003; Stassun et al., 2004). The flares can be so powerful that non-solar geometries of the magnetic fields must be considered, including field lines linking the star with the protoplanetary disk (Favata et al., 2005). In addition, the role of accretion is unclear, and may affect the production of X-rays either directly or indirectly. For example, energetic shocks associated with accretion flows at or near the stellar surface may enhance X-ray production, as has been suggested in the detailed spectroscopic analyses of TW Hya (Kastner et al., 2002; Stelzer & Schmitt, 2004) and BP Tau (Schmitt et al., 2005). At the same time, the mass-loading of magnetic field lines may actually inhibit X-ray production in accreting systems, as suggested by Preibisch et al. (2005). These issues are reviewed more fully in Feigelson et al. (2006).
We have undertaken a synoptic study of the Orion Nebula Cluster (ONC) combining a nearly continuous, 13-d Chandra observation with simultaneous, multi-wavelength, time-series photometry in the optical. A specific motivation is to establish the incidence of time-correlated X-ray and optical variability in order to begin disentangling the roles of magnetic and accretion activity in the production of X-rays. For example, accretion shocks on the surfaces of classical TTSs (CTTSs; TTSs that still possess accretion disks) produce strong variability at optical wavelengths, caused by time-variable accretion, rotational modulation of accretion “hot spots,” or both (Herbst et al., 1994; Bouvier, Forestini, & Allain, 1997; Stassun & Wood, 1999). If X-rays are produced near the sites of accretion shocks, then one might expect that changes in the strength of these shocks will induce changes in the strength of the X-ray emission, and that X-ray and optical variability might therefore be correlated in time. Alternatively, X-rays may originate in coronal structures associated with magnetically active regions on these stars, in which case we might expect that X-ray emission will be more pronounced when the magnetically active regions (which appear as dark photospheric spots in the optical) face toward us, and least pronounced when these regions face away from us; that is, optical and X-ray variability will be anti-correlated in time. More complex behavior may result from the superposition of these effects, emphasizing the need for time-resolved measurements. More generally, by establishing the frequency with which X-ray and optical variations are co-temporal, we seek to constrain the extent to which the sources of the X-ray and optical variability may be co-spatial or otherwise causally linked.
Detailed analyses of simultaneous, time-resolved X-ray and optical variability have previously been reported for three PMS stars: the CTTSs V773 Tau (Feigelson et al., 1994) and BP Tau (Gullbring, Barwig, & Schmitt, 1997), and the weak-lined TTS (WTTS) V410 Tau (Stelzer et al., 2003). In none of these were the optical and X-ray variability found to be time-correlated. Unfortunately, in all three cases the statistical significance of the results were limited by the short duration of the X-ray observations: V773 Tau was observed by ROSAT for 6.7 hr, BP Tau was observed by ROSAT for 8 hr, and V410 Tau was observed by Chandra for 7.2 hr.
The combined X-ray/optical dataset reported here includes some 800 members of the ONC and thus represents, by a factor of hundreds, the largest attempt to date to study the relationship between X-ray and optical variability in PMS stars. We will report results from this database in stages, focusing first on statistical properties of the study sample as a whole. In this first paper, we establish the incidence of time-correlated optical and X-ray variability. A companion paper (Stassun et al., 2006, hereafter Paper II) focuses on time-averaged measures of optical and X-ray variability, and on the relationship between these variability indicators and basic stellar properties. This database will then form the basis for follow-up studies focusing on fine-grained analyses of individual objects.
In §2, we present the X-ray and optical time-series database that forms the basis for these studies and describe the methods that we employ in this paper to search for time-correlated X-ray/optical variability. In §3, we identify 40 candidate stars with possible time-correlated optical and X-ray variability, and classify them according to common light-curve characteristics to guide follow-up study of these interesting objects. Importantly, these candidates represent at most % of our study sample; % of the stars in our sample exhibit no evidence for time-correlated optical and X-ray variability. As we discuss in §4, these results imply that the sites of optical and X-ray variability in PMS stars are not—in the vast majority of cases—instantaneously one and the same. A direct causal link between the sources of optical and X-ray variability in PMS stars is not supported by our study. We summarize our findings in §5.
2 A Database of Simultaneous, Optical and X-ray Light Curves of the ONC
2.1 X-ray observations: The COUP
As the foundation for the synoptic X-ray/optical database used in this and follow-up studies, we use the deep X-ray observation of the ONC obtained by the Chandra Orion Ultradeep Project (COUP) (catalog ADS/Sa.CXO#obs/COUP) collaboration. Details of the COUP dataset are described elsewhere (Getman et al., 2005a). Briefly, the ONC was observed by the Chandra ACIS detector (energy passband of 0.5–10 keV; Getman et al., 2005a) from 8 Jan 2003 to 21 Jan 2003 for a total of 849 ks (9.8 days), representing the deepest X-ray observation of a star-forming region ever obtained. There were five small gaps of ks each (when the spacecraft passed through the Van Allen belts), but the data stream is otherwise continuous over a total timespan of 13.2 days. Within the ACIS 17’ 17’ field of view centered on the Trapezium, 1616 point sources were identified, of which are associated ONC stars (Getman et al., 2005b). For each of these, Getman et al. (2005a) performed a spectral extraction and analysis from which they derived the source’s X-ray luminosity and other parameters. Most importantly for our present purposes, they also performed an analysis of photon arrival times, providing measures of each source’s X-ray variability and yielding for each source a nearly continuous X-ray light curve spanning 13.2-d.
The COUP database also includes a compilation of a number of other physical characteristics for each source from photometric and spectroscopic catalogs already in the literature. For our purposes in this and follow-up studies, the most relevant of these is the equivalent width (EW) of the Ca II infrared triplet from Hillenbrand et al. (1998), which serves as a measure of the mass accretion rate in each object.
2.2 Simultaneous optical observations
To complement this unique and rich database of X-ray light curves and ancillary data, we organized a simultaneous, multi-band, ground-based monitoring campaign, with the aim of obtaining well-sampled optical light curves that overlap well with the X-ray light curves. Using small telescopes at two observing sites to minimize diurnal observing gaps, we repeatedly imaged the same field as that observed by Chandra ACIS, cycling through the filters, and alternating between short and long exposure times in each filter to maximize the dynamic range of the observations. Constraints in scheduling the ground-based observations together with uncertainties in the scheduling of the Chandra observations prevented us from obtaining optical data at the start of the Chandra exposure. The optical observations begin 6 days after the start of the 13.2-d X-ray observation, and continue for 2 days beyond, for a total overlap of 7.2 d.
We observed with the WIYN 0.9-m telescope at the Kitt Peak National Observatory (KPNO) in Arizona, USA, over the period UT 2003 Jan 15–25. Due to poor weather, no data were obtained on the night of UT 2003 Jan 18. At the same time, we observed with the 1.5-m Cassini telescope in Loiano, Italy, over the period UT 2003 Jan 15–22, with no data obtained on the nights of UT 2003 Jan 16, 17, 20, 21. Exposure times were varied slightly to compensate for variable observing conditions, but were otherwise similar at both sites. Typical exposure times were 5 s in for short exposures, 420 s for long exposures in and , and 720 s for long exposures in and . We typically obtained a total of measurements per filter per night, in both short and long exposures, with a cadence of hr-1. A log of the optical observations is presented in Table 1.
The images were reduced, and instrumental magnitudes for all point sources extracted, using standard IRAF222IRAF is distributed by the National Optical Astronomy Observatory, which is operated by the Association of Universities for Research in Astronomy, Inc., under cooperative agreement with the National Science Foundation. procedures. Differential light curves were determined from PSF photometry using an algorithm for inhomogeneous ensemble photometry (Honeycutt, 1992) as implemented in Stassun et al. (1999, 2002) for observations of high-nebulosity regions such as the ONC. Systematic offsets between the KPNO and Loiano observations were adjusted by comparing the instrumental magnitudes of non-variable stars. All differential light curves are available in electronic format from the authors. Calibrated mean optical magnitudes for each star are reported in the COUP database.
In order to cross-identify the optical sources with the X-ray sources in the COUP database, we first determined the optical identifications of the stars from the catalogs of Hillenbrand (1997) and Herbst et al. (2002) using a 15 matching radius. We then used these optical identifications to associate each object with its X-ray counterpart in the COUP database using the table of cross-identifications provided by Getman et al. (2005a). In this way, we were able to unambiguously associate 814 optical sources with X-ray counterparts in the COUP database.
These 814 objects span a very large range of apparent magnitudes and colors, with and , and a correspondingly large range of spectral types and extinctions, B3 SpTy M7 and (Hillenbrand, 1997). This sample is thus representative of the underlying ONC population; only the very massive, heavily obscured, and sub-stellar populations are excluded.
An unavoidable consequence of this breadth of stellar properties is that objects do not appear with uniform frequency in our optical light curves. For example, the brightest objects appear only in the short-exposure light curves, being saturated in the long-exposure frames. Similarly, the coolest and the most heavily reddened objects appear only in the long-wavelength passbands. In addition, some objects near the bright and faint extremes of our survey have more sparsely sampled light curves, as variations in observing conditions (e.g. seeing, sky transparency, background) cause these objects to be lost from some exposures. Thus, any individual object in our final database possesses between 1 and 8 different optical light curves ( filters, long and short exposures) with time sampling patterns that are very similar but, for the reasons already noted, not identical. Of course, objects whose characteristics are intermediate to the extremes discussed above possess the most complete set of optical light curves and the most complete time sampling.
2.3 Measures of variability
The stars in our database exhibit a large variety of behaviors in their optical and X-ray variability. Figs. 1–6 show the optical and X-ray light curves for a selection of objects as a representative visual summary of the range and types of variability observed. Here we describe the methods we use to measure and to correlate variability in the X-ray and optical light curves in our database.
2.3.1 Time-averaged variability indicators
To quantify the time-averaged X-ray variability of the stars in our database, we use the Bayesian Block (BB) analysis provided by the COUP (Getman et al., 2005a). Briefly, the BB analysis (Scargle, 1998) segments each light curve into the maximum number of time blocks such that the differences in the mean flux levels of the blocks are statistically significant. The BB analysis thus yields a robust measure of the maximum and minimum flux levels in the source’s segmented X-ray light curve (BBmax and BBmin, respectively); we use the statistic BBmax/BBmin to quantify the magnitude of variability in the X-ray light curve. As discussed in Paper II, 556 (68%) of the 814 stars in our database are X-ray variable at greater than 99.9% confidence according to the BB statistic, with a range of amplitudes BBmax/BBmin. The six objects displayed in Figs. 1–6 are representative of this range, with BBmax/BBmin.
To characterize the time-averaged optical variability of these stars, we use the statistic described by Stetson (1996). Briefly, the statistic is similar to the standard statistic, however the statistic simultaneously considers the measurements from all of the light curves of a given object. As such, the statistic is more robust against outliers, especially when multiple light curves are available in a given passband (i.e. long and short exposures). As discussed in Paper II, 358/814 (44%) of the stars in our database are optically variable at greater than 99.9% confidence according to the statistic, with a range , corresponding to peak-to-peak variability in the band ranging from a maximum of mag to a minimum of mag (upper limit). The six objects displayed in Figs. 1–6 are representative of this range, with . With this range of variability amplitudes, and with variability timescales ranging from hours to days, the optical variability of our sample is typical of what has been observed before in optical variability studies of TTSs (e.g. Herbst et al., 1994).
We defer to Paper II a full analysis of the relationships between these time-averaged variability indicators, but note here that the light curves shown in Figs. 1–6 are representative of the behavior observed in our database as a whole. In general, we find examples of optical and X-ray variability in every possible permutation: We find stars that are highly variable in both optical and X-ray light (e.g. Fig. 1), stars that are strongly variable in the optical but non-variable in X-rays (e.g. Fig. 3) and vice-versa (e.g. Fig. 6), and stars that are non-variable altogether.
2.3.2 Time-correlated variability
For each of the stars in our database, we calculate Kendall’s statistic to quantify the degree to which variability in the X-ray and optical light curves are correlated in time. Kendall’s is a standard non-parametric statistical test for the degree of association between two variables, and has a known probability distribution. Kendall’s test rank-orders the time-matched optical magnitudes and X-ray fluxes, computes the degree to which the optical and X-ray “ranks” are correlated, and calculates the probability that the measured correlation is consistent with the null hypothesis of no correlation. Measurement errors are ignored in computing .
To allow for the possibility that time-correlated variability may be a function of wavelength, we calculate Kendall’s and its associated null-hypothesis probability by correlating each star’s X-ray light curve separately against each of its associated optical light curves. Where multiple light curves are available in a given passband (i.e. long and short exposures), we select the light curve with the smallest ratio of mean photometric error to total number of measurements, , i.e. the light curve with the best combination of signal-to-noise and time sampling. For a given optical light curve, we match each optical data point with the corresponding time bin in the star’s X-ray light curve. In total, our search for time-correlated variability in our sample of 814 stars involves 1944 different light curves.
In the analysis that follows, we take Kendall’s probabilities of less than 0.01 as suggestive of time-correlated optical and X-ray variability. The sign of the statistic indicates whether the optical and X-ray light curves are positively or negatively time-correlated.
None of the examples shown in Figs. 1–6 exhibit statistically significant time-correlated optical and X-ray variability. For instance, at the same time that COUP 1499 (Fig. 1) shows variability of mag in the optical, its X-ray light curve is almost completely non-variable. To be sure, this star is one of the strongest X-ray variables in our database, with (BBmax/BBmin) . The sources of X-ray and optical variability in this star are evidently not simultaneously one and the same. Figs. 2–4 show similar examples, while Figs. 5–6 exhibit the reverse behavior, with strong X-ray flaring events that are not simultaneously reflected in the optical. Such a lack of time-correlated optical and X-ray variability is a general feature of the stars in our database, as we now discuss.
3 Results: Time-correlations of optical and X-ray light curves
In this section we present the results of our analysis of time-correlated optical and X-ray variability in our database of 814 COUP sources with simultaneous optical and X-ray light curves. We identify 40 candidate stars whose optical and X-ray light curves appear to be correlated or anti-correlated in time. These represent the first such cases yet reported for PMS stars, and we classify these objects according to possible physical origins for the observed variability. More generally, however, time-correlated variability evidently occurs very rarely in our study sample.
3.1 Incidence of time-correlated variability
Following the procedure described in §2.3.2, we have searched for time-correlated variability in the optical and X-ray light curves of the 814 stars in our database. Forty stars show evidence for the X-ray light curve being time-correlated with at least one optical light curve on the basis of a non-parametric Kendall’s test (§2.3.2). These 40 stars are listed in Table 2, and their X-ray and optical light curves shown in Figs. 7a–7an.
Relative to our entire study sample of 814 stars, the fractional incidence of time-correlated variability represented by these 40 stars is . In our study sample, 178 stars are neither optically nor X-ray variable according to the BB and statistical measures discussed in §2.3 (see also Paper II for a thorough analysis and discussion of these time-averaged variability indicators). If we exclude these 178 stars from the comparison sample (leaving 636 stars), the 40 stars exhibiting time-correlated variability then represent a fractional incidence of %. In any case, time-correlated optical and X-ray variability is evidently an uncommon phenomenon in our sample.
From statistical arguments, it is probable that a number of these candidates will be spurious. Estimating the number of expected false positives accurately is complicated by the fact that a given star may possess multiple optical light curves that are not statistically independent. We may, however, estimate an upper limit to the expected number of false positives, given that we adopted a Kendall’s null-hypothesis probability of 0.01 as our criterion for identifying these candidates, and that our search for time-correlated variability in our sample of 814 stars involves 1944 different optical light curves (§2.3.2). This implies 19–20 false positives. As a reality check on the Kendall’s statistic, we have additionally performed a Monte Carlo simulation in which we applied the Kendall’s test to one million random pairings of our optical and X-ray light curves, and we find that Kendall’s probabilities of less than 0.01 occur with a frequency of 1.4%, very close to the expected value of 1.0%. The candidates listed in Table 2 include a total of 63 light curves that are found to be time-correlated with their associated X-ray light curves according to Kendall’s , and thus represent a detection of time-correlated variability over the expected number of false positives.
It is not possible on the basis of these statistical arguments alone to determine which of these candidates are the false positives and which are the true time-correlated variables. In many cases, the appearance of the X-ray and optical variations are quite dissimilar, so the statistical correlation may often not arise from a physical correlation. Some candidates might nonetheless be regarded as more credible than others based on the number of their optical light curves that pass the Kendall’s test. For example, COUP 122 (Fig. 7e) has four optical light curves () and all four of them are identified as time-correlated with the X-ray light curve (see Table 2). In contrast, COUP 1309 (Fig. 7ad) also has four optical light curves, none of which appear to be convincingly correlated with the X-ray light curve, and indeed only one of them is identified as time-correlated by the Kendall’s statistic. In other cases, only one optical light curve is identified as being time-correlated with the X-ray light curve even though the other optical light curves share a similar morphology. For example, in COUP 152 (Fig. 7h) the - and -band light curves are not identified as time-correlated, despite a very similar morphology to the -band light curve. Common sense suggests that this is not a physically meaningful result; instead, it is likely that small, random noise differences among the optical light curves allow just one of them to pass the 0.01 Kendall’s probability threshold. Such a precarious correlation is less credible than, e.g., the case of COUP 122 (Fig. 7e) noted above. The reader may wish to apply other subjective criteria to the light curves shown in Figs. 7a–7an.
We thus do not attempt to identify specific candidates in Table 2 as definitive. Rather, we emphasize that these 40 candidates have been identified on an objective, statistical basis and that an estimated upper limit on the number of false positives suggests that of these candidates may represent bona fide cases of time-correlated optical and X-ray variability. This implies an overall incidence of time-correlated variability in our sample of %. Time-correlated optical and X-ray variability is evidently an uncommon phenomenon in our sample.
3.2 Relation to accretion
If X-ray production in PMS stars is connected to accretion related processes, we might expect time-correlated optical/X-ray variability to be more common among actively accreting stars, as these stars may be more likely to have their optical variability dominated by accretion. Following previous studies (e.g. Flaccomio et al., 2003; Stassun et al., 2004), we take the “accretors” to be those stars with Ca II strongly in emission, i.e., EW[Ca II] Å, and “non-accretors” to be those with Ca II clearly in absorption, i.e., EW[Ca II] Å. EW[Ca II] measurements have been reported for 493 stars in our study sample. Of these, 151 stars are accretors and 145 stars are non-accretors, as defined here (the remainder show indeterminate values close to 0 Å)333As a caveat, we note that EW[Ca II] is an imperfect indicator of accretion. As shown by Sicilia-Aguilar et al. (2005), some PMS stars with clear accretion signatures in H do not manifest this accretion activity in Ca II. It is therefore possible or even likely that some low-level accretors will go undetected in Ca II. The criterion that we adopt for identifying the presence of accretion is thus in practice a conservative one; stars with EW[Ca II] Å and EW[Ca II] Å are securely identified as accretors and non-accretors, while some stars with indeterminate values close to 0 Å may be weakly accreting objects that will go unidentified as such..
Eighteen of the 40 stars in Table 2 have EW[Ca II] measurements allowing them to be clearly classified as accretors or non-accretors (Table 2). These 18 stars are roughly evenly divided in terms of their accretion properties (10 accretors, 8 non-accretors). Thus there is no indication that accretors are more likely than non-accretors to exhibit time-correlated optical and X-ray variability.
3.3 Nature of time-correlated variability
In this section, we discuss the 40 stars that we have identified as candidates for time-correlated X-ray/optical variability (Table 2). Classifying them according to common light curve characteristics, we suggest physical interpretations for the origins of the observed variability. Note that, due to the often complex nature of the observed variability, some stars are not classified while others may be included in more than one category (see Table 2 for an overview). This discussion is presented to highlight what may represent the first examples in the literature of time-correlated optical and X-ray variability among PMS stars, and to guide follow-up investigation of these specific objects. We remind the reader that in fact the overwhelming majority of the stars in our study sample do not exhibit evidence for time-correlated optical and X-ray variability.
3.3.1 Group A: Fast X-ray with slow optical variations: Flares and star spots?
Several stars show periodic or quasi-periodic modulations in their optical light curve(s) on time scales that appear to be consistent with optical variability periods () reported for them in the literature. The persistence of the periodicity suggests that it is related to the stars’ rotation periods and that we are seeing either dark spots in regions of magnetic activity, or accretion hot spots, rotating in and out of view. At the same time, these stars’ X-ray light curves exhibit typical coronal flare-like morphologies that are coincident in time with extrema in the optical light curves.
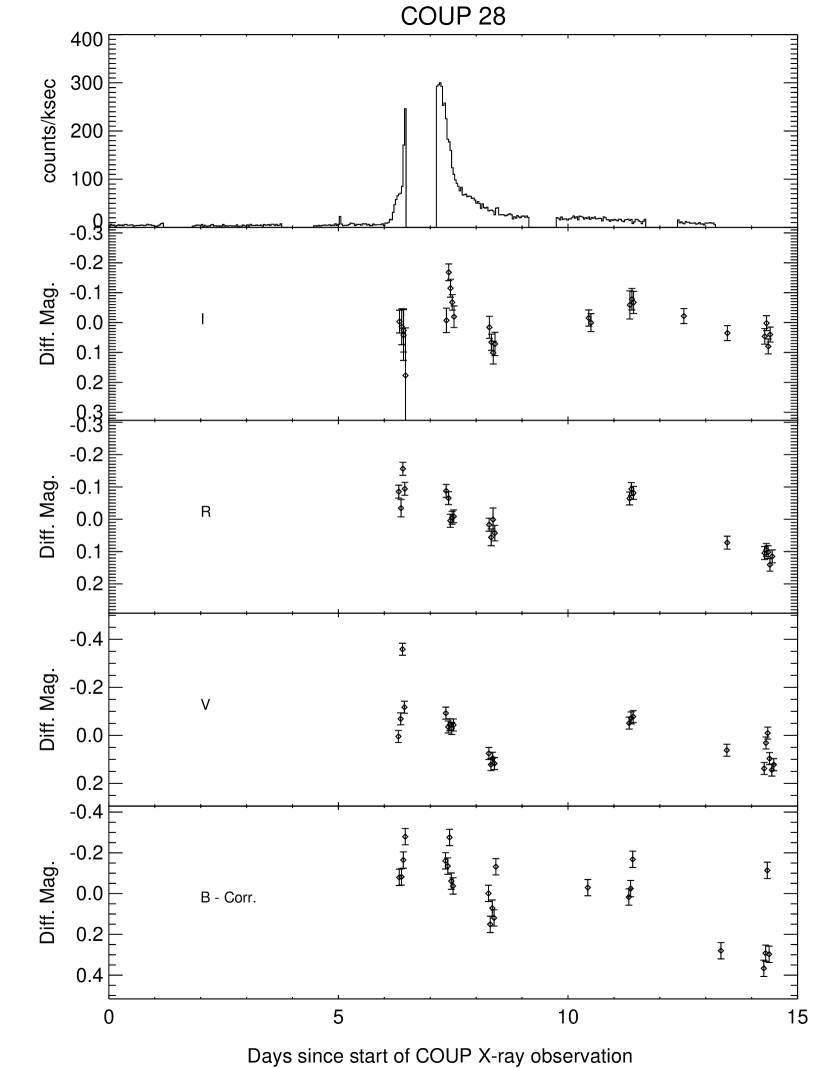
This type of behavior is found both in cases for which the X-ray/optical correlations are positive and negative, and among both accretors and non-accretors. Sources for which an X-ray flare coincides with optical maximum (positive correlations) include COUP 28 (catalog ), 112 (catalog COUP 112), 250 (catalog COUP 250), 501 (catalog COUP 501), and 1608 (catalog COUP 1608). Sources for which an X-ray flare coincides with optical minimum (anti-correlations) include COUP 298 (catalog ), 1384 (catalog COUP 1384), and 1387 (catalog COUP 1387).
Additional stars that can be included in this category are those with no previously reported but which still show gradual (and possibly periodic) modulations in at least one optical light curve. Sources for which an X-ray flare coincides with optical maximum (positive correlations) include COUP 152 (catalog ), 325 (catalog COUP 325), and 597 (catalog COUP 597). Sources for which an X-ray flare coincides with optical minimum (anti-correlations) include COUP 54 (catalog ), 152 (catalog COUP 152), and 1316 (catalog COUP 1316).
Finally, there are some stars whose time-correlations are dominated by other behavior (see Groups B/C below) but which in addition exhibit X-ray flares near optical maximum or minimum. Sources for which an X-ray flare coincides with optical maximum include COUP 122 (catalog ) and 718 (catalog COUP 718). Sources for which an X-ray flare coincides with optical minimum include COUP 566 (catalog ) and 1292 (catalog COUP 1292).
It is possible that these stars represent examples of physical associations between regions of X-ray flaring and stellar spots—either hot accretion spots (positive correlations) or dark magnetic spots (anti-correlations). However, it is also possible that these stars represent a more general class of objects that show periodic rotational modulation and X-ray flares with no preferred correlation with rotational phase. For example, if we assume a typical of 6 d, and that X-ray flares occur randomly in time with a typical duration of 0.3 d, then the probability of finding either a correlation or anti-correlation is %. Moreover, among the ten cases of positive correlations included above, only three show clear evidence of active accretion. In any case, detailed follow-up of these stars in comparison to the full sample of COUP sources showing X-ray flares should help resolve these interpretations.
3.3.2 Group B: Slow X-ray with slow optical variations: Coronal structure and star spots?
We have found several stars that show gradual and periodic or quasi-periodic variations in both their optical and X-ray light curves; in particular, the X-ray light curves do not exhibit the flare-like features that characterize the objects in Group A. Assuming that modulation in the X-ray light curve indicates the presence of a stable structure (within the time span of the Chandra observation) that moves in and out of view as the star rotates, its origin could be a bright accretion spot or a magnetically active region on the stellar surface. In the first case, a positive correlation with the optical light curves might be expected. In the second, an X-ray–bright coronal feature accompanied by a photospheric dark spot would give rise to anti-correlated behavior.
There are nine cases for which the X-ray and optical light curves produce a net anti-correlation: COUP 139 (catalog ), 161 (catalog COUP 161), 718 (catalog COUP 718), 1143 (catalog COUP 1143), 1355 (catalog COUP 1355), 1463 (catalog COUP 1463), 1521 (catalog COUP 1521), and 1590 (catalog COUP 1590). With the exception of the last object, which showed weak signatures of active accretion in the observations of Hillenbrand et al. (1998), the available EW[Ca II] measurements are consistent with these stars all being non-accretors, and therefore implying that the photometric and X-ray variations are not related to accretion.
All but one star (COUP 1521) have previously published optical periods, and the variability observed in our optical light curves is fully consistent with those periods. In addition, the X-ray light curves of three of these stars (COUP 161, 1355, and 1521) have been independently found by Flaccomio et al. (2005) to be periodic, with X-ray periods that are equal to the optical periods (i.e. ; see Table 2), corroborating the interpretation that the X-ray variability arises from rotational modulation. As discussed by Flaccomio et al. (2005), this rotational modulation implies that the X-ray emission is produced in close proximity to the stellar surface, such that the X-ray emitting region is occulted as it rotates to the back side of the star. These objects thus represent compelling cases of stars having stable coronal structures that are in close spatial proximity to—and likely to be physically linked with—dark, magnetically active regions on their surfaces.
Interestingly, for COUP 139 (catalog ) and 1590 (catalog COUP 1590), Flaccomio et al. (2005) find (see Table 2). That is, the light curves exhibit two X-ray modulations for each optical modulation. This is particularly evident in COUP 139 (catalog ) (Fig. 7f). Of course, this behavior may simply be the result of randomly repeating flares and/or randomly elevated X-ray emission levels, as discussed for the Group A stars. Another interpretation is that the stellar coronae in these cases have two X-ray bright regions, separated by in longitude, but that we only see a dark, magnetically active region on the stellar surface associated with one of them. COUP 1590 (catalog ) (Fig. 7am), which exhibits an X-ray light curve that appears to oscillate between two different amplitudes, may be a case in point.
In addition to these stars with anti-correlated light curves, there are 14 stars that exhibit positive correlations in their X-ray/optical light curves. They are: COUP 112 (catalog ), 122 (catalog COUP 122), 147 (catalog COUP 147), 226 (catalog COUP 226), 250 (catalog COUP 250), 501 (catalog COUP 501), 566 (catalog COUP 566), 1071 (catalog COUP 1071), and 1292 (catalog COUP 1292). Flaccomio et al. (2005) have searched for periodicity in the X-ray light curves of eight of these 14 stars, and have identified two of them (COUP 226 (catalog ) and 250 (catalog COUP 250)) as having definitive periodic X-ray light curves, with periods equal to (or half of) the published . They also identified another three of these stars (COUP 112 (catalog ), 122 (catalog COUP 122), and 501 (catalog COUP 501)) as having “likely” periodic X-ray light curves. Thus, the incidence of periodic X-ray modulation among objects with positively correlated optical/X-ray light curves appears to be high.
The positive correlation between the X-ray and optical light curves suggests that these cases represent stable X-ray–bright structures physically associated with photospheric hot spots, rotating in and out of view. These hot spots may be the footpoints of mass accretion streams on the stellar surface. Alternatively, the observed positively correlated X-ray/optical light curves may represent examples of X-ray–faint coronal structures—i.e. coronal holes—that are co-spatial with dark, magnetically active regions on the stellar surface. However, an interpretation of accretion hot spots is more strongly supported by the EW[Ca II] properties of these 14 stars, which include some of the strongest accretion signatures found in the entire study sample (Table 2). Among these, COUP 250 (catalog ) (Fig. 7m) is particularly interesting, having been identified by Flaccomio et al. (2005) as having a periodic X-ray light curve. This star may thus be a good example of a star having stable structures that are physically associated with accretion hot spots on their surfaces. Follow-up modeling and analysis of the color information contained in our multi-band optical light curves should help to clarify whether we are in fact observing hot spots in this object.
3.3.3 Group C: Fast X-ray with fast optical variations: White-light flares?
Many of the X-ray flares seen in the COUP dataset resemble solar long-duration flares seen with the GOES and Yohkoh satellites which cover the Chandra spectral band. The peak luminosities and durations, and hence total energies, of the COUP flare plasma emission are orders of magnitude higher than seen in solar flares. But it is reasonable to suggest that, as in solar flares, the long-duration soft (Chandra band) X-ray flares are preceeded by brief impulsive phases when particle acceleration, radio gyrosynchrotron, hard ( keV) X-ray emission, and optical “white-light” continuum increases occur (e.g. Brown, 1971; Dennis, 1985; Dennis & Zarro, 1993; Tandberg-Hanssen & Emslie, 1988; Warren & Antiochos, 2004). The impulsive phase has, on rare occasions, been seen in magnetically active stars, notably the RS CVn systems Gem (Güdel et al., 2002) and HR 1099 (Osten et al., 2004) and dMe stars Prox Cen (Güdel et al., 2004) and EV Lac (Osten et al., 2005).
Two stars in our study sample—COUP 250 (catalog ) and 816 (catalog COUP 816)—exhibit rather irregular optical light curves that show punctuated increases in brightness that are positively correlated with short-duration flares in the X-ray light curves. While these correlations may be coincidences, we think it is worthwhile to highlight these objects since they may represent the best candidates for the occurrence of white-light magnetic flares.
We note that COUP 250 (catalog ) has also been identified as a candidate in Groups A and B above due to the particularly complex nature of the observed variability. In particular, we caution that the optical brightening “event” near day 10.5 may simply be related to the longer-term, quasi-periodic optical variability of this object. On the other hand, while we have very little data for COUP 816 (catalog ), what we do have is tantalizing. A single optical measurement, brighter than the mean brightness level by , occurs precisely in the time bin of a very brief X-ray flare that at its peak is times brighter than the mean X-ray flux level for this object. We have carefully scrutinized the optical data for this star and believe the observed optical brightening event to be credible.
4 Discussion
In contrast to the strong “rotation-activity relationship” that is clearly present on the main sequence (Pallavicini et al., 1981; Jeffries, 1999; Randich, 2000; Schrijver & Zwaan, 2000; Pizzolato et al., 2003), a series of studies based on Chandra observations of a large sample of PMS stars in the Orion Nebula Cluster (ONC) failed to find any direct correlation between the stars’ rotation rates and their X-ray luminosities (Flaccomio, Micela, & Sciortino, 2003b; Feigelson et al., 2003; Stassun et al., 2004; Preibisch et al., 2005). A possible explanation for the lack of a PMS rotation-activity relationship is that the X-rays originate not (or not only) from dynamo-generated magnetic processes, but also (or instead) from energetic processes related to accretion.
If X-rays are produced near the sites of accretion shocks, then we may expect that X-ray and optical variability would be time-correlated. However, at most % of the stars in our sample show credible, statistically significant, time-correlated optical and X-ray light curves (§3.1), and this time-correlated variability is just as likely to occur among non-accreting stars as it is among accretors (§3.2). Our findings are consistent with previous studies of simultaneous X-ray and optical variability in PMS stars (Feigelson et al., 1994; Gullbring, Barwig, & Schmitt, 1997; Stelzer & Schmitt, 2004), with a sample that is hundreds of times larger.
Our results do not negate the possibility that accretion is indirectly related to X-ray production at some level. For example, the presence of an accretion disk may alter the stellar magnetospheric environment (e.g. via large star-disk magnetic loops; Favata et al., 2005) such that large reconnection flares or other energetic processes take place in a way that is not possible in the absence of a disk (e.g. Jardine et al., 2006). Such events, displaced and disconnected from magnetically active regions on the stellar surface, might not be expected to produce time-correlated behavior in X-rays and the optical. In addition, we have in fact found a small number of stars that exhibit possibly accretion-related X-ray emission, in the form of X-ray flares and X-ray–bright features that may be co-spatial with accretion hot spots on the stellar surface (§3.3). The strong optical/X-ray brightening event observed in the FU Ori–like outburst of V1647 Ori (McNeil’s Nebula) serves as a particularly dramatic example of time-correlated optical/X-ray variability that is likely to be accretion driven (Kastner et al., 2004b). Nonetheless, though intriguing, such cases are evidently very rare.
Similarly, any physical connection of X-ray emission to magnetically active surface regions (i.e. cool spots) does not for the vast majority of stars in our sample manifest itself in a time-correlated way (§3.3). This may indicate that the X-ray emitting coronae in PMS stars have spatial structures that little reflect the magnetic structure of the underlying photosphere. A possible explanation for this is that X-ray emission takes place on very large spatial scales relative to the photosphere, and may not be confined to the small surface regions (spots) from which the optical variability presumably originates. While this picture is at odds with the small coronae implicit in the finding of rotationally modulated X-ray emission in % of COUP sources by Flaccomio et al. (2005), such an interpretation could be consistent with the very large flaring loop sizes inferred on a small number of COUP sources by Favata et al. (2005).
More generally, our findings are consistent with recent analyses of the X-ray spectra of CTTSs, and with recent measurements of the magnetic field structures of WTTSs. In an analysis of high-resolution X-ray spectra of the CTTSs BP Tau, CR Cha, SU Aur, and TW Hya, Robrade & Schmitt (2006) conclude that both accretion shocks and coronal activity contribute to the observed X-ray emission, but that coronal activity is by far the dominant contributor in all cases except TW Hya. These results, together with our finding that time-correlated optical and X-ray variability occurs only very rarely, support the general conclusion that neither surface accretion shocks nor magnetically active surface (cool) spots are the exclusive sites of X-ray production in the vast majority of PMS stars.
5 Summary and Conclusions
We have presented a combined analysis of simultaneous optical and X-ray light curves for a sample of more than 800 pre–main-sequence (PMS) stars in the Orion Nebula Cluster (ONC). This dataset represents an increase of several hundred-fold, both in the number of objects studied and in the total duration of the X-ray and optical time-series data, over all previous investigations of simultaneous optical and X-ray variability in PMS stars.
We identify 40 stars that exhibit the first examples to our knowledge of time-correlated optical and X-ray variability in PMS stars. Among these 40 stars, we find examples of both positive and anti-correlations. Positive correlations may represent X-ray–dark coronal structures associated with cool, magnetically active surface spots, or may represent X-ray–bright structures associated with hot accretion spots. Anti-correlations may represent, e.g., magnetic flaring events associated with cool surface spots. In any event, the implication is that the X-ray emitting regions in these stars are in close proximity to—and thus likely to be physically linked with—cool and/or hot spots on their surfaces. Follow-up modeling and analysis of the color information contained in our multi-band optical light curves should help to clarify whether we are observing cool or hot spots in each object. In addition, we identify two possible examples of “white-light” flares, perhaps corresponding to the impulsive heating phase in solar-analog flares.
However, these cases represent at most % of our study sample. The remaining % of our study sample exhibits no such time-correlated variability. Evidently, time-correlated optical and X-ray variability is rare in PMS stars. We conclude that the sites of optical and X-ray variability in PMS stars are not—for the vast majority of stars in our study sample—instantaneously one and the same. Surface accretion shocks and cool magnetic spots are evidently not the exclusive or dominant sites of X-ray production in most PMS stars.
References
- Brown (1971) Brown, J. C. 1971, Sol. Phys., 18, 489
- Bouvier, Forestini, & Allain (1997) Bouvier, J., Forestini, M., & Allain, S. 1997, A&A, 326, 1023
- Dennis (1985) Dennis, B. R. 1985, Sol. Phys., 100, 465
- Dennis & Zarro (1993) Dennis, B. R., & Zarro, D. M. 1993, Sol. Phys., 146, 177
- Drake (2005) Drake, J. J. 2005, ASP Conf. Ser.: Cool Stars, Stellar Systems, and the Sun, in press
- Favata et al. (2005) Favata, F., Flaccomio, E., Reale, F., Micela, G., Sciortino, S., Shang, H., Stassun, K. G., & Feigelson, E. D. 2005, ApJS, 160, 469
- Feigelson & DeCampli (1981) Feigelson, E. D., & DeCampli, W.M. 1981, ApJ, 243, L89
- Feigelson et al. (1994) Feigelson, E. D., Welty, A. D., Imhoff, C., Hall, J. C., Etzel, P. B., Phillips, R. B., & Lonsdale, C. J. 1994, ApJ, 432, 373
- Feigelson & Montmerle (1999) Feigelson, E. D., & Montmerle, T. 1999, ARA&A, 37, 363
- Feigelson et al. (2003) Feigelson, E. D., Gaffney, J. A., Garmire, G., Hillenbrand, L. A., Townsley, L. 2003, ApJ, 584, 911
- Feigelson et al. (2002) Feigelson, E. D., Broos, P., Gaffney, J. A., Garmire, G., Hillenbrand, L. A., Pravdo, S. H., Townsley, L., & Tsuboi, Y. 2002, ApJ, 574, 258
- Feigelson et al. (2006) Feigelson, E., Townsley, L., Gudel, M., & Stassun, K. 2006, Protostars & Planets V, in press
- Fernández et al. (2004) Fernández, M., et al. 2004, A&A, 427, 263
- Flaccomio et al. (2005) Flaccomio, E., Micela, G., Sciortino, S., Feigelson, E. D., Herbst, W., Favata, F., Harnden, F. R., & Vrtilek, S. D. 2005, ApJS, 160, 450
- Flaccomio, Micela, & Sciortino (2003b) Flaccomio, E., Micela, G., & Sciortino, S. 2003b, A&A, 402, 277
- Flaccomio, Micela, & Sciortino (2003a) Flaccomio, E., Micela, G., & Sciortino, S. 2003a, A&A, 397, 611
- Flaccomio et al. (2003) Flaccomio, E., Damiani, F., Micela, G., Sciortino, S., Harnden, F. R., Murray, S. S., & Wolk, S. J. 2003, ApJ, 582, 398
- Getman et al. (2005a) Getman, K. V., et al. 2005, ApJS, 160, 319
- Getman et al. (2005b) Getman, K. V., Feigelson, E. D., Grosso, N., McCaughrean, M. J., Micela, G., Broos, P., Garmire, G., & Townsley, L. 2005, ApJS, 160, 353
- Glassgold, Feigelson, & Montmerle (2000) Glassgold, A. E., Feigelson, E. D., & Montmerle, T. 2000, Protostars and Planets IV, 429
- Grigis & Benz (2004) Grigis, P. C., & Benz, A. O. 2004, A&A, 426, 1093
- Güdel et al. (2002) Güdel, M., Audard, M., Smith, K. W., Behar, E., Beasley, A. J., & Mewe, R. 2002, ApJ, 577, 371
- Güdel et al. (2004) Güdel, M., Audard, M., Reale, F., Skinner, S. L., & Linsky, J. L. 2004, A&A, 416, 713
- Guenther et al. (1999) Guenther, E. W., Lehmann, H., Emerson, J. P., & Staude, J. 1999, A&A, 341, 768
- Gullbring et al. (1996) Gullbring, E., Barwig, H., Chen, P. S., Gahm, G. F., & Bao, M. X. 1996, A&A, 307, 791
- Gullbring, Barwig, & Schmitt (1997) Gullbring, E., Barwig, H., & Schmitt, J. H. M. M. 1997, A&A, 324, 155
- Herbst et al. (2002) Herbst, W., Bailer-Jones, C. A. L., Mundt, R., Meisenheimer, K., & Wackermann, R. 2002, A&A, 396, 513
- Herbst et al. (1994) Herbst, W., Herbst, D. K., Grossman, E. J., & Weinstein, D. 1994, AJ, 108, 1906
- Hillenbrand (1997) Hillenbrand, L. A. 1997, AJ, 113, 1733
- Hillenbrand et al. (1998) Hillenbrand, L. A., Strom, S. E., Calvet, N., Merrill, K. M., Gatley, I., Makidon, R. B., Meyer, M. R., & Skrutskie, M. F. 1998, AJ, 116, 1816
- Honeycutt (1992) Honeycutt, R. K. 1992, PASP, 104, 435
- Jardine et al. (2006) Jardine, M., Cameron, A. C., Donati, J.-F., Gregory, S. G., & Wood, K. 2006, MNRAS, 367, 917
- Jeffries (1999) Jeffries, R.D. 1999, ASP Conf. Ser. 158: Solar and Stellar Activity: Similarities and Differences, 75
- Johns-Krull, Valenti, & Saar (2004) Johns-Krull, C. M., Valenti, J. A., & Saar, S. H. 2004, ApJ, 617, 1204
- Johns-Krull et al. (1999) Johns-Krull, C. M., Valenti, J. A., & Koresko, C. 1999, ApJ, 516, 900
- Kastner et al. (2004a) Kastner, J. H., Huenemoerder, D. P., Schulz, N. S., Canizares, C. R., Li, J., & Weintraub, D. A. 2004a, ApJ, 605, L49
- Kastner et al. (2004b) Kastner, J. H., et al. 2004b, Nature, 430, 429
- Kastner et al. (2002) Kastner, J. H., Huenemoerder, D. P., Schulz, N. S., Canizares, C. R., & Weintraub, D. A. 2002, ApJ, 567, 434
- Osten et al. (2004) Osten, R. A., et al. 2004, ApJS, 153, 317
- Osten et al. (2005) Osten, R. A., Hawley, S. L., Allred, J. C., Johns-Krull, C. M., & Roark, C. 2005, ApJ, 621, 398
- Pallavicini et al. (1981) Pallavicini, R., Golub, L., Rosner, R., Vaiana, G. S., Ayres, T., & Linsky, J. L. 1981, ApJ, 248, 279
- Pizzolato et al. (2003) Pizzolato, N., Maggio, A., Micela, G., Sciortino, S., & Ventura, P. 2003, A&A, 397, 147
- Preibisch et al. (2005) Preibisch, T., et al. 2005, ApJS, 160, 401
- Randich (2000) Randich, S. 2000, ASP Conf. Ser. 198: Stellar Clusters and Associations: Convection, Rotation, and Dynamos, 401
- Robrade & Schmitt (2006) Robrade, J., & Schmitt, J. H. M. M. 2006, A&A, in press
- Scargle (1998) Scargle, J. D. 1998, ApJ, 504, 405
- Schrijver & Zwaan (2000) Schrijver, C. J., & Zwaan, C. 2000, Solar and stellar magnetic activity. New York: Cambridge University Press, 2000. (Cambridge astrophysics series; 34)
- Schmitt et al. (2005) Schmitt, J. H. M. M., Robrade, J., Ness, J.-U., Favata, F., & Stelzer, B. 2005, A&A, 432, L35
- Sicilia-Aguilar et al. (2005) Sicilia-Aguilar, A., et al. 2005, AJ, 129, 363
- Stassun & Wood (1999) Stassun, K. G., & Wood, K. 1999, ApJ, 510, 892
- Stassun et al. (1999) Stassun, K. G., Mathieu, R. D., Mazeh, T., & Vrba, F. J. 1999, AJ, 117, 2941
- Stassun et al. (2002) Stassun, K. G., van den Berg, M., Mathieu, R. D., & Verbunt, F. 2002, A&A, 382, 899
- Stassun et al. (2004) Stassun, K. G., Ardila, D. R., Barsony, M., Basri, G., & Mathieu, R. D. 2004, AJ, 127, 3537
- Stassun et al. (2006) Stassun, K. G., van den Berg, M., & Feigelson, E. 2006, ApJ, in preparation (Paper II)
- Stelzer et al. (2003) Stelzer, B., et al. 2003, A&A, 411, 517
- Stelzer & Schmitt (2004) Stelzer, B., & Schmitt, J. H. M. M. 2004, A&A, 418, 687
- Stetson (1996) Stetson, P. B. 1996, PASP, 108, 851
- Tandberg-Hanssen & Emslie (1988) Tandberg-Hanssen, E., & Emslie, A. G. 1988, Cambridge Univ. Press
- Warren & Antiochos (2004) Warren, H. P., & Antiochos, S. K. 2004, ApJ, 611, L49
- Wolk et al. (2005) Wolk, S. J., Harnden, F. R., Flaccomio, E., Micela, G., Favata, F., Shang, H., & Feigelson, E. D. 2005, ApJS, 160, 423
| UT Date | Filter | aaNumber of observations | Julian Dates |
|---|---|---|---|
| KPNO | |||
| 2003 Jan 15 | long | 4 | 2452654.69829 |
| 2452654.74710 | |||
| 2452654.78729 | |||
| 2452654.82935 | |||
| short | 4 | 2452654.69343 | |
| 2452654.74240 | |||
| 2452654.78264 | |||
| 2452654.82473 | |||
| long | 4 | 2452654.68066 | |
| 2452654.72999 | |||
| 2452654.77007 | |||
| 2452654.81229 | |||
| short | 4 | 2452654.67623 | |
| 2452654.72604 | |||
| 2452654.76613 | |||
| 2452654.80839 | |||
| long | 4 | 2452654.68900 | |
| 2452654.73799 | |||
| 2452654.77822 | |||
| 2452654.82024 | |||
| short | 4 | 2452654.68497 | |
| 2452654.73398 | |||
| 2452654.77403 | |||
| 2452654.81634 | |||
| long | 4 | 2452654.70725 | |
| 2452654.75627 | |||
| 2452654.79855 | |||
| 2452654.83816 | |||
| short | 5 | 2452654.70319 | |
| 2452654.75232 | |||
| 2452654.79217 | |||
| 2452654.79445 | |||
| 2452654.83439 | |||
| 2003 Jan 16 | long | 5 | 2452655.70634 |
| 2452655.75586 | |||
| 2452655.79487 | |||
| 2452655.83286 | |||
| 2452655.87096 | |||
| short | 5 | 2452655.70174 | |
| 2452655.75128 | |||
| 2452655.79037 | |||
| 2452655.82835 | |||
| 2452655.86639 | |||
| long | 5 | 2452655.71509 | |
| 2452655.76489 | |||
| 2452655.80322 | |||
| 2452655.84131 | |||
| 2452655.87962 | |||
| short | 5 | 2452655.71109 | |
| 2452655.76104 | |||
| 2452655.79944 | |||
| 2452655.83746 | |||
| 2452655.87558 | |||
| long | 5 | 2452655.72068 | |
| 2452655.77256 | |||
| 2452655.81079 | |||
| 2452655.84938 | |||
| 2452655.88714 | |||
| short | 5 | 2452655.72455 | |
| 2452655.76876 | |||
| 2452655.80707 | |||
| 2452655.84568 | |||
| 2452655.88341 | |||
| long | 5 | 2452655.73077 | |
| 2452655.78041 | |||
| 2452655.81872 | |||
| 2452655.85701 | |||
| 2452655.89490 | |||
| short | 5 | 2452655.72684 | |
| 2452655.77667 | |||
| 2452655.81491 | |||
| 2452655.85327 | |||
| 2452655.89116 | |||
| 2003 Jan 17 | long | 7 | 2452656.64191 |
| 2452656.68023 | |||
| 2452656.72500 | |||
| 2452656.76363 | |||
| 2452656.80270 | |||
| 2452656.84125 | |||
| 2452656.88129 | |||
| short | 7 | 2452656.63677 | |
| 2452656.67572 | |||
| 2452656.72057 | |||
| 2452656.75909 | |||
| 2452656.79805 | |||
| 2452656.83668 | |||
| 2452656.87652 | |||
| long | 7 | 2452656.65095 | |
| 2452656.69519 | |||
| 2452656.73391 | |||
| 2452656.77238 | |||
| 2452656.81125 | |||
| 2452656.85048 | |||
| 2452656.89037 | |||
| short | 7 | 2452656.64706 | |
| 2452656.68480 | |||
| 2452656.72993 | |||
| 2452656.76837 | |||
| 2452656.80753 | |||
| 2452656.84657 | |||
| 2452656.88620 | |||
| long | 7 | 2452656.65643 | |
| 2452656.70081 | |||
| 2452656.74172 | |||
| 2452656.78003 | |||
| 2452656.81670 | |||
| 2452656.85609 | |||
| 2452656.89592 | |||
| short | 7 | 2452656.66025 | |
| 2452656.70467 | |||
| 2452656.73783 | |||
| 2452656.77625 | |||
| 2452656.82052 | |||
| 2452656.86029 | |||
| 2452656.90020 | |||
| long | 7 | 2452656.66661 | |
| 2452656.71092 | |||
| 2452656.74953 | |||
| 2452656.78802 | |||
| 2452656.82649 | |||
| 2452656.86648 | |||
| 2452656.90659 | |||
| short | 7 | 2452656.66254 | |
| 2452656.70706 | |||
| 2452656.74577 | |||
| 2452656.78419 | |||
| 2452656.82269 | |||
| 2452656.86271 | |||
| 2452656.90252 | |||
| 2003 Jan 19 | long | 1 | 2452658.80562 |
| short | 3 | 2452658.80091 | |
| 2452658.84655 | |||
| 2452658.88929 | |||
| short | 2 | 2452658.81034 | |
| 2452658.85586 | |||
| short | 1 | 2452658.81810 | |
| short | 2 | 2452658.82642 | |
| 2452658.87448 | |||
| 2003 Jan 20 | long | 3 | 2452659.69923 |
| 2452659.73927 | |||
| 2452659.78394 | |||
| short | 3 | 2452659.69449 | |
| 2452659.73461 | |||
| 2452659.77938 | |||
| long | 3 | 2452659.70758 | |
| 2452659.74787 | |||
| 2452659.79236 | |||
| short | 3 | 2452659.70375 | |
| 2452659.74389 | |||
| 2452659.78848 | |||
| long | 3 | 2452659.71525 | |
| 2452659.75586 | |||
| 2452659.80028 | |||
| short | 3 | 2452659.71140 | |
| 2452659.75189 | |||
| 2452659.79629 | |||
| long | 3 | 2452659.72508 | |
| 2452659.76987 | |||
| 2452659.80822 | |||
| short | 3 | 2452659.72127 | |
| 2452659.76597 | |||
| 2452659.80436 | |||
| 2003 Jan 21 | short | 1 | 2452660.87434 |
| short | 1 | 2452660.88349 | |
| short | 1 | 2452660.89865 | |
| 2003 Jan 22 | long | 1 | 2452661.70622 |
| short | 2 | 2452661.70159 | |
| 2452661.86023 | |||
| long | 1 | 2452661.83375 | |
| short | 1 | 2452661.71098 | |
| long | 1 | 2452661.84161 | |
| short | 1 | 2452661.83778 | |
| short | 1 | 2452661.84603 | |
| 2003 Jan 23 | long | 4 | 2452662.63928 |
| 2452662.67797 | |||
| 2452662.71604 | |||
| 2452662.75484 | |||
| short | 5 | 2452662.63462 | |
| 2452662.67339 | |||
| 2452662.71156 | |||
| 2452662.75033 | |||
| 2452662.79970 | |||
| long | 6 | 2452662.64782 | |
| 2452662.68635 | |||
| 2452662.72483 | |||
| 2452662.76400 | |||
| 2452662.81349 | |||
| 2452662.85621 | |||
| short | 6 | 2452662.64387 | |
| 2452662.68253 | |||
| 2452662.72065 | |||
| 2452662.75986 | |||
| 2452662.80971 | |||
| 2452662.85213 | |||
| long | 5 | 2452662.65582 | |
| 2452662.69412 | |||
| 2452662.73251 | |||
| 2452662.77315 | |||
| 2452662.82160 | |||
| short | 5 | 2452662.65175 | |
| 2452662.69017 | |||
| 2452662.72875 | |||
| 2452662.76936 | |||
| 2452662.86015 | |||
| long | 4 | 2452662.66371 | |
| 2452662.74026 | |||
| 2452662.78107 | |||
| 2452662.82975 | |||
| short | 4 | 2452662.65992 | |
| 2452662.69818 | |||
| 2452662.73643 | |||
| 2452662.77733 | |||
| 2003 Jan 25 | long | 1 | 2452664.81536 |
| short | 2 | 2452664.81050 | |
| 2452664.85198 | |||
| long | 1 | 2452664.82516 | |
| short | 1 | 2452664.82035 | |
| long | 1 | 2452664.83348 | |
| short | 1 | 2452664.82927 | |
| long | 1 | 2452664.84101 | |
| short | 1 | 2452664.83732 | |
| Loiano | |||
| 2003 Jan 15 | long | 3 | 2452655.31530 |
| 2452655.37790 | |||
| 2452655.43330 | |||
| short | 4 | 2452655.31070 | |
| 2452655.31140 | |||
| 2452655.33080 | |||
| 2452655.43200 | |||
| long | 3 | 2452655.33870 | |
| 2452655.40080 | |||
| 2452655.44700 | |||
| short | 2 | 2452655.39840 | |
| 2452655.44550 | |||
| long | 3 | 2452655.34910 | |
| 2452655.41040 | |||
| 2452655.45690 | |||
| short | 2 | 2452655.40820 | |
| 2452655.45560 | |||
| long | 2 | 2452655.36310 | |
| 2452655.42120 | |||
| short | 2 | 2452655.37050 | |
| 2452655.41910 | |||
| 2003 Jan 16 | long | 1 | 2452656.46640 |
| short | 1 | 2452656.46530 | |
| 2003 Jan 18 | long | 3 | 2452658.31120 |
| 2452658.36380 | |||
| 2452658.41440 | |||
| short | 3 | 2452658.31000 | |
| 2452658.36230 | |||
| 2452658.41320 | |||
| long | 3 | 2452658.32980 | |
| 2452658.37810 | |||
| 2452658.43280 | |||
| short | 3 | 2452658.32860 | |
| 2452658.37690 | |||
| 2452658.42740 | |||
| long | 3 | 2452658.34020 | |
| 2452658.38810 | |||
| 2452658.44180 | |||
| short | 3 | 2452658.33900 | |
| 2452658.38670 | |||
| 2452658.44060 | |||
| long | 3 | 2452658.34880 | |
| 2452658.39840 | |||
| 2452658.45470 | |||
| short | 2 | 2452658.39700 | |
| 2452658.45020 | |||
| 2003 Jan 19 | long | 4 | 2452659.28790 |
| 2452659.33810 | |||
| 2452659.38800 | |||
| 2452659.46500 | |||
| short | 1 | 2452659.46330 | |
| long | 4 | 2452659.30670 | |
| 2452659.35630 | |||
| 2452659.40160 | |||
| 2452659.48030 | |||
| short | 4 | 2452659.30560 | |
| 2452659.35520 | |||
| 2452659.39990 | |||
| 2452659.47910 | |||
| long | 4 | 2452659.31510 | |
| 2452659.36440 | |||
| 2452659.41030 | |||
| 2452659.48820 | |||
| short | 4 | 2452659.31400 | |
| 2452659.36320 | |||
| 2452659.40920 | |||
| 2452659.48710 | |||
| long | 4 | 2452659.32480 | |
| 2452659.37350 | |||
| 2452659.41900 | |||
| 2452659.49700 | |||
| short | 4 | 2452659.32300 | |
| 2452659.37210 | |||
| 2452659.41790 | |||
| 2452659.49570 | |||
| 2003 Jan 22 | long | 2 | 2452662.29290 |
| 2452662.36200 | |||
| short | 2 | 2452662.29150 | |
| 2452662.35710 | |||
| long | 1 | 2452662.30880 | |
| short | 1 | 2452662.30770 | |
| long | 1 | 2452662.31990 | |
| short | 1 | 2452662.31870 | |
| long | 1 | 2452662.33070 | |
| short | 1 | 2452662.32950 | |
| COUP | LCoptaaOptical light curves included in database. | LCcorrbbOptical light curves time-correlated with the X-ray light curve as indicated by a Kendall’s test (§2.3.2). | Ca IIccEquivalent width in Å of Ca II IR triplet lines. Stars with EW[Ca II] Å are identified as active accretors while those with EW[Ca II] Å are identified as non-accretors (see §3.2). | SignddSign of the Kendall’s correlation statistic from for those light curves with statistically significant correlations. | eeVariability period in days from previous optical monitoring reported in the literature. Typically, is assumed to reflect the rotation period of the star. | ffFlag from Flaccomio et al. (2005) indicating period of X-ray light curve relative to optical period: A value of 1 indicates that the X-ray period is equal to the optical period, indicates that the X-ray period is equal to one-half of the optical period. ‘Poss.’ indicates a possibly periodic X-ray light curve. | GroupggClassification of objects based on the nature of the observed time-correlated X-ray/optical variability; see §3.3. |
|---|---|---|---|---|---|---|---|
| 28 | 1.6 | 4.41 | A | ||||
| 54 | 1.0 | A | |||||
| 97 | 3.4 | ||||||
| 112 | 0.7 | 6.52 | Poss. | AB | |||
| 122 | 0.0 | 9.19 | Poss. | AB | |||
| 139 | 0.9 | 9.04 | B | ||||
| 147 | 1.0 | B | |||||
| 152 | A | ||||||
| 161 | 1.4 | 5.46 | 1 | B | |||
| 197 | |||||||
| 226 | 1.2 | 10.98 | 1 | B | |||
| 241 | 2.8 | 9.81 | |||||
| 250 | 9.6 | 6.76 | 1 | ABC | |||
| 298 | 0.0 | 6.14 | A | ||||
| 309 | |||||||
| 325 | 0.0 | A | |||||
| 346 | 0.0 | ||||||
| 501 | 25.2 | 16.33 | Poss. | AB | |||
| 566 | AB | ||||||
| 597 | 4.5 | A | |||||
| 718 | 5.74 | AB | |||||
| 816 | C | ||||||
| 1071 | 1.6 | 0.96 | B | ||||
| 1076 | 11.68 | ||||||
| 1143 | 13.00 | B | |||||
| 1212 | |||||||
| 1252 | 1.6 | 11.68 | |||||
| 1264 | 1.8 | 6.63 | |||||
| 1292 | 3.0 | AB | |||||
| 1309 | |||||||
| 1316 | 1.8 | A | |||||
| 1328 | |||||||
| 1355 | 0.0 | 10.36 | 1 | B | |||
| 1384 | 1.9 | 2.85 | 1 | A | |||
| 1387 | 0.0 | 6.42 | A | ||||
| 1463 | 10.66 | 1 | B | ||||
| 1521 | B | ||||||
| 1572 | 0.0 | ||||||
| 1590 | 1.2 | 7.10 | B | ||||
| 1608 | 1.3 | 4.21 | A |