Multi-band study of NGC 7424 and its two newly-discovered ULXs
Abstract
We have studied the face-on, barred spiral NGC 7424 (site of the rare Type IIb SN 2001ig) with Chandra, Gemini and the Australia Telescope Compact Array. After giving revised X-ray colours and luminosity of the supernova, here we focus on some other interesting sources in the galaxy: in particular, our serendipitous discovery of two ultraluminous X-ray sources (ULXs). The brighter one ( erg s-1) has a power-law-like spectrum with photon index . The other ULX shows a spectral state transition or outburst between the two Chandra observations, 20 days apart. Optical data show that this ULX is located in a young (age – Myr), bright complex rich with OB stars and clusters. An exceptionally bright, unresolved radio source ( mJy at GHz, implying a radio luminosity twice as high as Cas A) is found slightly offset from the ULX ( pc). Its radio spectral index suggests optically-thin synchrotron emission, either from a young supernova remnant or from a radio lobe powered by a ULX jet. An even brighter, unresolved radio source ( mJy at GHz) is found in another young, massive stellar complex, not associated with any X-ray sources: based on its flatter radio spectral index (), we suggest that it is a young pulsar wind nebula, a factor of more radio luminous than the Crab.
keywords:
black hole physics — radio continuum: ISM — supernova remnants — X-ray: binaries — galaxies: individual: NGC 7424.1 Introduction
The physical interpretation of ultra-luminous X-ray sources (ULXs) remains a fervently debated and unsolved problem (for recent reviews, see King 2006; Fabbiano & White 2006; Colbert & Miller 2004). They could be scaled-up equivalents of Galactic black hole (BH) X-ray binaries, with a higher-mass accretor (up to a few for the brightest sources, if the accretion is isotropic and Eddington-limited). Alternatively, they could be beamed sources—either mild geometrical beaming or relativistic Doppler boosting have been suggested (King et al. 2001; Körding, Falcke & Markoff 2002; Fabrika & Mescheryakov 2001). A direct comparison with Galactic BH X-ray binaries is hampered by at least two problems. Firstly, the mass and evolutionary state of the donor star is unknown in almost all cases: some ULXs appear to be associated with OB associations or young star clusters; others, however, do not have optical counterparts down to typical detection limits mag. Secondly, most ULXs have been observed in the X-rays only once or few times over the last decade; thus, it is still unclear whether they follow the same patterns of spectral evolution and state transitions as daily-monitored Galactic BH X-ray binaries, and over what time-scale.
In this paper, we report the serendipitous discovery of two ULXs in the face-on SABcd galaxy NGC 7424. Henceforth, we adopt a distance Mpc (Tully 1988); a slightly lower distance of Mpc was estimated by Böker et al. (2002). The galaxy was observed twice with Chandra, on 2002 May 21–22 and 2002 June 11, to study the X-ray supernova SN 2001ig (Evans, White & Bembrick 2001; Schlegel & Ryder 2002). For the same reason, it was monitored on a regular basis for three years with the Australia Telescope Compact Array (ATCA) (Ryder et al. 2004). We studied the X-ray spectral state of the two ULXs found near SN 2001ig, and their variability between the two observations. We then searched for their radio and optical counterparts, using the ATCA dataset, together with archival HST/WFPC2 and new Gemini images (Ryder, Murrowood & Stathakis 2006)111High-resolution colour images of NGC 7424 from the Gemini observations are available at http://www.gemini.edu/2001igpr. Finally, we determined the X-ray luminosity and colours of the other bright X-ray sources detected in the field of this galaxy.
2 X-ray data analysis
We analysed the two Chandra datasets (Table 1) with standard tasks from the CIAO-3.3 data-reduction package222http://cxc.harvard.edu/ciao. Specifically, we checked for aspect offsets in the level-1 event files, and applied the appropriate astrometric corrections. We created new bad-pixel files with the acis_run_hotpix script, which flags hot pixels and cosmic-ray afterglows. We then created new level-2 event files with acis_process_events, which provides the newest gain maps, time-dependent gain corrections, charge-transfer-inefficiency corrections, pixel and PHA randomization. We then filtered the event files for bad grades and applied the good-time-intervals. We checked that there were no significant background flares in either observations.
We used wavdetect to identify discrete sources in both datasets, and in different energy bands. We also used a combined image (obtained with merge_all) to detect fainter sources. Lightcurves of the brightest sources were obtained with dmextract. Spectra and corresponding response files were extracted with specextract, and modelled with XSPEC version 11.3.1 (Arnaud 1996).
| Obs. ID | Instrument | Start date | Exp. time (ks) |
|---|---|---|---|
| 3495 | ACIS-S | 2002-05-21 23:34:38 | 23.4 |
| 3496 | ACIS-S | 2002-06-11 06:02:07 | 23.9 |
3 X-ray study: main results
3.1 Overview
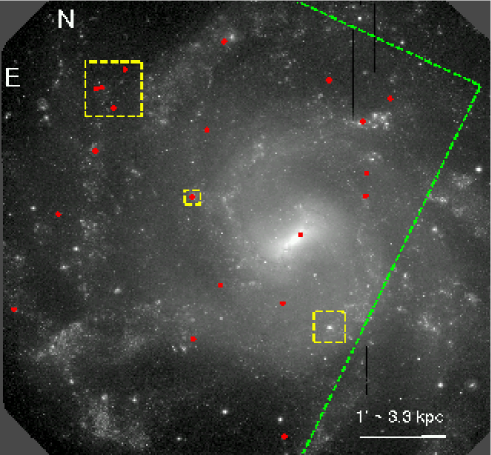
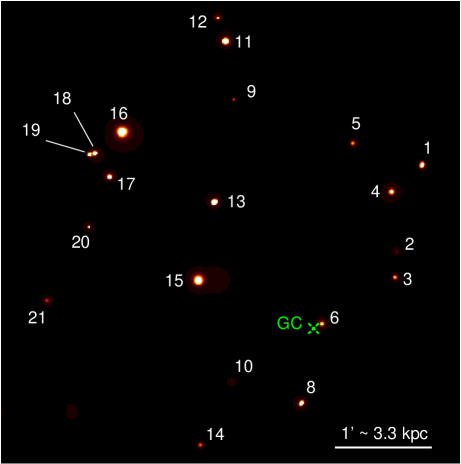
From the combined 47.3 ks image, we identified 22 point-like sources inside the D25 ellipse (Table 2 and Figure 1), at a significance in the – keV energy band. In fact, the ACIS field of view covers only of that region: this is partly because the S3 chip is centered on the location of SN 2001ig rather than the galactic nucleus; however, the nucleus is also in the field of view.
| No. | R.A.(2000) | Dec.(2000) | Notes | ||||
|---|---|---|---|---|---|---|---|
| ( ct s-1) | ( ct s-1) | ( ct s-1) | ( ct s-1) | ||||
| 01 | |||||||
| 02 | |||||||
| 03 | |||||||
| 04 | |||||||
| 05 | |||||||
| 06 | SSS | ||||||
| 07 | |||||||
| 08 | |||||||
| 09 | SSS | ||||||
| 10 | |||||||
| 11 | BHC | ||||||
| 12 | |||||||
| 13 | QSO? | ||||||
| 14 | |||||||
| 15 | ULX 2 | ||||||
| 16 | ULX 1 | ||||||
| 17 | QSO | ||||||
| 18 | |||||||
| 19 | SN 2001ig | ||||||
| 20 | |||||||
| 21 | |||||||
| 22 | fg star? |
| No. | ID | Obs. | ||||
|---|---|---|---|---|---|---|
| ( ct s-1) | ( ct s-1) | ( ct s-1) | ( ct s-1) | |||
| 11 | BHC | 1 | ||||
| 2 | ||||||
| 15 | ULX 2 | 1 | ||||
| 2 | ||||||
| 16 | ULX 1 | 1 | ||||
| 2 | ||||||
| 19 | SN 2001ig | 1 | ||||
| 2 |
Assuming a power-law spectrum with photon index and line-of-sight Galactic column density cm-2 (Dickey & Lockman 1990), we estimate that the completeness limit in the combined image is erg s-1 (i.e., ct s-1). From the Chandra Deep Field – curve (Moretti et al. 2003), we estimate that of the 22 Chandra sources (Table 2) are background AGN. For example, source No. 17 is almost certainly a background radio quasar (Ryder et al. 2004): this is also consistent with its hard and heavily absorbed power-law spectrum in the X-ray band. Source No. 13 is also likely to be a background AGN, based on its hard X-ray spectrum (not shown here) and its point-like optical counterpart with an optical/X-ray flux ratio (Barger et al. 2003).
The two brightest sources (Table 2) are in the ULX regime, and will be discussed in detail later (Sections 3.1 and 3.2). The original target of the observation, SN 2001ig, was seen with a count rate of ct s-1 in the 2002 May 21–22 observation, as previously reported (Schlegel & Ryder 2002). This corresponds to a – keV luminosity erg s-1 for a thermal plasma model with keV (suitable to the soft X-ray colors of the source). It declined to about half this value in the 2002 June 11 observation (Table 3).
NGC 7424 is a bulgeless late-type spiral galaxy with a bright, massive nuclear star cluster ( mag, : Walcher et al. 2005). It is still unclear whether this subclass of spiral galaxies also have a supermassive or perhaps intermediate-mass nuclear BH. In some cases, an X-ray source coincides with the nuclear star cluster (e.g., in M 33 and in M 74). Instead, we do not find any nuclear X-ray sources in NGC 7424. Interestingly, however, a super-soft source is located pc north-west of the nuclear star cluster. For a blackbody temperature eV, typical of this class of sources, the unabsorbed luminosity is erg s-1 in the – keV band, corresponding to a bolometric luminosity erg s-1. Another, fainter super-soft source is located in the outskirts of the galaxy.
A bright X-ray source (No. 11 in Table 2), located in a spiral arm, has an X-ray spectrum which is well fitted by a disc-blackbody model (Shakura & Sunyaev 1973; Makishima et al. 1986) with keV (Figure 2, and Table 4 for the fit parameters). Based on this standard model, the unabsorbed luminosity in the – keV band is erg s-1. Spectral properties and luminosity suggest that this source is consistent with a BH X-ray binary in a high/soft state, for example similar to LMC X-1 or LMC X-3 (Nowak et al. 2001; Wu et al. 2001).
3.2 ULX 1: power-law dominated
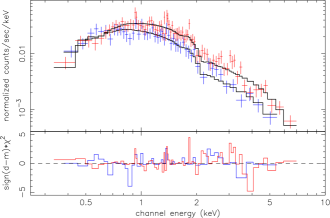
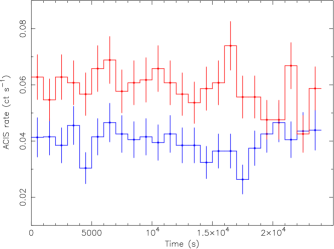
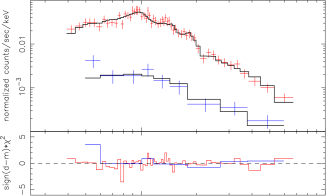
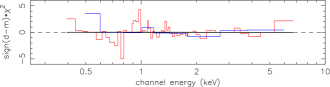
In both observations, the spectrum of ULX 1 is well fitted (Figure 3) by an absorbed333Throughout this paper, we used wabs in XSPEC to model the photoelectric absorption (Bałucińska-Church & McCammon 1992). As a check, we repeated our fits with a more complex absorption model, tbabs (Wilms, Allen & McCray 2000): the difference in the best-fitting value of the column density between the two models is , well within the errors, and all the other spectral parameters remain essentially unchanged. Besides, the true metal abundance of the interstellar medium in NGC 7424 is unknown. Hence, for our current purposes, wabs is a suitable approximation. power-law of photon index (Table 5). The unabsorbed luminosity appears to have increased by almost a factor of two in the second observation, reaching erg s-1 in 2002 June (Figures 4, 5). There is no evidence of a soft excess or thermal disc component. We also coadded the spectra from May and June to improve the signal-to-noise ratio of possible thermal-plasma emission lines, but found none. A very luminous source in the same field was also found by ROSAT/PSPC (observed on 1990 November 11–12), at a count rate of ct s-1 (ROSAT All Sky Survey Faint Source Catalog: Voges et al. 2000; data available on-line), corresponding to an unabsorbed luminosity of erg s-1 in the – keV band. The displacement between the ROSAT and Chandra positions is consistent with the PSPC error.
Many bright ULXs have been found to have power-law dominated spectra, with (Winter, Mushotzky & Reynolds 2006; Stobbart, Roberts & Wilms 2006), similar to this source. In other bright ULXs detected with better signal-to-noise, a small “soft excess” with fitted blackbody temperatures – keV (sometimes interpreted as the disc of an intermediate-mass BH: Miller, Fabian & Miller 2004) is often also present, in addition to the dominant power-law. In the standard understanding of BH spectral states (e.g., McClintock & Remillard 2006), the power-law is produced via inverse-Compton scattering of cooler seed photons in a hot corona. However, the hardness of the ULX power-law component is difficult to reconcile with the standard spectral-state classification of Galactic BH candidates. The latter class of sources is generally power-law dominated either in the low/hard state—but then, their X-ray luminosity is only —or in the very high state, at —but in that case, the power-law is steeper, with a photon index .
Various scenarios have been suggested to explain hard power-law dominated ULXs. They might indeed be in the low/hard state, emitting well below their Eddington limit (Winter et al. 2006). If that is the case, their BH masses would be as high as a few , supporting the intermediate-mass BH interpretation. However, it is not clear why we have never seen any of those objects in a high state, with erg s-1.
Alternatively, it was speculated that the true X-ray spectrum in the – keV band is not really a power-law, but the sum of a hot disc (– keV) and an additional, cooler ( keV) thermal component produced via Compton downscattering (Stobbart et al. 2006). In many cases, it is hard to distinguish between a power-law and a disc-blackbody component in the limited Chandra energy band, particularly for spectra with only counts. In the case of ULX 1, in particular, we also obtain formally good fits with a thermal component at keV and a disc-blackbody component with keV in the first observation, and keV in the second one. This alternative model, however, does not improve the simpler power-law fit. We do not find evidence of spectral curvature at energies keV, as noted in other sources (Stobbart et al. 2006), but the signal-to-noise level is too low to draw any firm conclusions.
A third possibility is that such power-law-dominated ULXs belong to the same steep-power-law state of Galactic BHs (assuming that we can indeed apply the same spectral-state classification to stellar-mass BHs and ULXs). The fitted photon index may appear flatter perhaps because of very broad, relativistically-smeared absorption lines from highly ionized plasma, which remove some of the power-law emission at lower energies (Goncalves & Soria 2006).
A fourth possibility is that the X-ray power-law component is not the result of thermal Comptonization of disc photons in a corona, but is produced independently, via other mechanisms. For example, it could result from nonthermal synchrotron and Compton processes in a relativistic jet (Markoff, Falcke & Fender 2001; Markoff, Nowak & Wilms 2005). It has been proposed (Kuncic & Bicknell 2004) that magnetized disc outflows can drain most of the accretion power from the disc, because of non-zero magnetic torques acting on its surface. If we are observing such sources along the jet axis, the thermal disc component becomes negligible compared with the boosted power-law component, even for accretion rates Eddington rate. This would support the microquasar scenario for ULXs.
| Parameter | Value (May/June combined) |
|---|---|
| Parameter | Value (Obs 1) | Value (Obs 2) |
|---|---|---|

3.3 ULX 2: catching a state transition
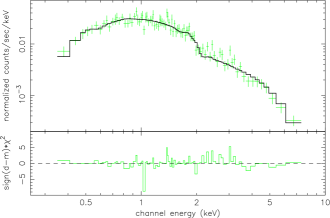
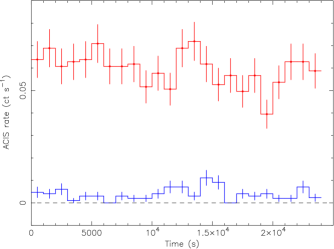
The second ULX in NGC 7424 was an order of magnitude brighter on 2002 June 11, compared with three weeks earlier (Table 3; Figures 6, 7). In the first observation, the source has a hard spectrum, consistent with a power-law of index , and unabsorbed luminosity erg s-1 (Table 6). In the second observation, its spectrum shows a softer continuum, with photon index if fitted with a simple power-law model (). In fact, there are weak but systematic features at energies – keV, typical of line emission from an optically-thin thermal plasma; adding a thermal component improves the fit (). In this model (Table 6), , the plasma temperature is keV, the unabsorbed luminosity in the thermal component is erg s-1 (mostly in the – keV band), and the total unabsorbed luminosity is erg s-1. Comparing the fluxes and spectral models for the two observations, we rule out the possibility that the thermal-plasma component is simply underlying emission from unrelated sources, for example a supernova remnant (SNR), because it would have already been detected in the first observation. It could instead be the result of the outburst, which may have produced an outflow of hot gas around the source.
State transitions are very unusual for bright ULXs, which generally do not vary by more than a factor of a few over many years; a notable exception is a source in NGC 3628 (Strickland et al. 2001). On the other hand, stronger variability or on/off transitions have been seen in fainter ( a few erg s-1) ULXs, for example in the Antennae (Fabbiano et al. 2003). The short timespan ( days) over which the spectral change took place is similar to state transitions in stellar-mass BHs, usually attributed to thermal-viscous disc instabilities (Meyer & Meyer-Hofmeister 1981). Such limit-cycle behaviour has never been clearly identified in ULXs.
For the thermal-viscous instability to occur, the outer disc has to be cooler than the Hydrogen ionization threshold. This condition can be used to constrain the mass and size of the binary system. For example, it was shown (Kalogera et al. 2004) that if the Roche-lobe filling donor star has a mass (consistent with the young optical environment around ULX 2, see Section 4), transient behaviour is statistically more likely to occur for BH masses . Conversely, for donor stars with masses , the limit-cycle instability can occur for any BH mass. With similar arguments, based on the temperature of an X-ray irradiated disc, it can be shown (van Paradijs 1996) that ULX 2 should have a limit-cycle behaviour if
| (1) |
where is the binary period in days, and we used the emitted luminosity of ULX 2 in its higher state. Choosing, for example, and , one obtains ; for , .
| Parameter | Value 1 | Value 2 | Value 2 |
| po | po | po+vapec | |
| - | - | ||
| [Mg/H] | - | - | |
| [Si/H][S/H][Ar/H] | - | - | |
| - | - | ||
4 Optical environments of the ULXs
Optical images of the galaxy were obtained with the Gemini Multi-Object Spectrograph (GMOS-South), on 2004 September 14, in the (exposure time s), ( s) and ( s) broad bands (Sloan photometric system), in exceptional seeing conditions (–). For more details on the observations, as well as a discussion of the extinction, zeropoints and colour terms, see Ryder et al. (2006). Colour coefficients for a simple conversion to the standard photometric system are given in Table 7 of Smith et al. (2002). Ryder et al. (2006) carried out an optical study of the counterpart and environment of SN 2001ig. Here, we focus instead on the environments around the two ULXs, which appear significantly different.
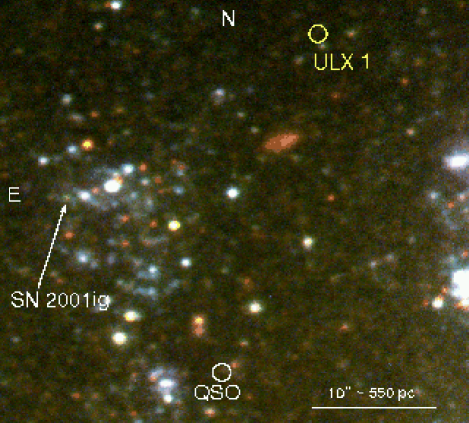
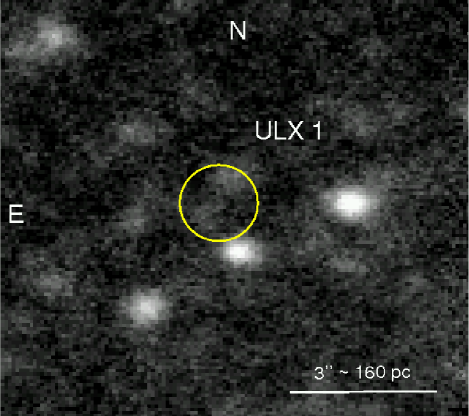
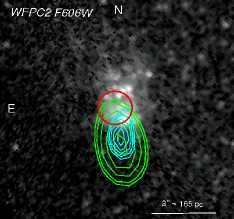
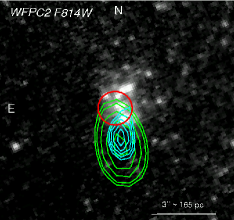
ULX 1 is far from massive young star clusters or OB associations (Figure 8, top panel). The paucity of bright young stars in its environment may be partly explained by patchy dust extinction (Ryder et al. 2006); however, from the fitted in the Chandra spectrum (Table 5) it appears that the X-ray source itself is not affected by more than about 1 mag of -band extinction. There are no optical counterparts formally detected above the level in any of the three Gemini images; however, two faint sources are clearly visible inside the error circle in a combined image obtained by normalizing and coadding the three optical bands (Figure 8, bottom panel). For the brighter candidate counterpart, we estimate mag, mag, mag, corresponding to an absolute magnitude mag, typical of main-sequence early B stars. A few brighter, isolated OB stars (possibly blue supergiants) are also found nearby.
Conversely, ULX 2 is located inside a bright, young stellar complex (Figures 9, 10), pc in diameter. This region contains a massive star cluster, just south of the positional error circle for ULX 2, and various other fainter groups of OB stars. The optical brightness of the whole complex is mag, mag, mag, mag (corresponding to mag). For the brightest unresolved cluster, we estimate mag, mag, mag, mag (corresponding to mag). For the other smaller groups of stars at the northern edge of the X-ray error circle, mag, mag, mag, mag. The distinctive average colours of this stellar complex, quite blue at mag mag, but with mag mag, correspond to a brief evolutionary phase dominated by stars with masses – becoming supergiants. Using the latest evolutionary tracks in Starburst99 (Leitherer et al. 1999) for instantaneous star formation, we estimate an age of Myr at solar metallicity (), or Myr for . The optical brightness of the whole complex corresponds to a total stellar mass at , or at . For the biggest compact cluster, the estimated masses are , or , respectively. The other clusters in the stellar complex have masses .
It is still not clear whether those two different environments for ULX 1 and 2 correspond to two fundamentally different classes of ULXs, for example in terms of BH mass, age, donor type, emission processes, or simply to different channels of formation. It has been suggested (Portegies Zwart & McMillan 2002; Gürkan, Freitag & Rasio 2004) that ULXs may contain intermediate-mass BHs formed in the core of a young super star-cluster, via runaway stellar coalescence; these BHs would become X-ray bright if powered for example by Roche-lobe accretion from an OB donor star. Notice, however, that the young star clusters near ULX 2 are smaller than a super star-cluster, generally defined as having a mass a few . The difference is not purely semantic. A super star-cluster is massive and compact enough that it may undergo runaway core collapse and coalescence of the O stars in its core, over their main-sequence life-time, Myr. Instead, clusters with masses of – do not have enough O stars to produce an intermediate-mass BH through this process; however, they might still be able to form a massive progenitor star in the core, via large-scale gas collapse and protostellar mergers, over a time-scale of yr. (A similar process may be currently happening in our own backyard, in the collapsing protocluster NGC 2264-C; Peretto, André & Belloche 2006). In fact, many more ULXs have been found associated to medium-size clusters and OB associations, than inside or close to super star-clusters. This may already give us a clue to their most likely formation process.
5 Radio observations
5.1 ULX counterparts: main results
Ryder et al. (2004) monitored SN 2001ig from 2001 December to 2004 April with the ATCA in Narrabri, New South Wales. The observed field includes the locations of both ULX 1 and ULX 2. A total of 37 observations were taken, with a typical synthesis time of 2–4 h. Calibrated visibilities of each of the observations were used to create sensitive radio images at 1.384, 2.368/2.496, 4.790 and 8.640 GHz. The CLEAN-ing procedure was restricted to an area containing the supernova and nearby radio source and was stopped either after 1000 iterations or when the peak residual reached a level of 0.5 mJy. Self-calibration was applied to enhance the dynamic range of the images, which were then primary-beam corrected. We coadded the separate images from each observation at each observing frequency using the MIRIAD task imcomb, with inverse variance weighting; we chose not to include a handful of images that had very sparse (U, V) coverage and consequently a very elongated beam.
The 2.368/2.496 GHz data cube was collapsed into a single averaged plane using the MIRIAD task avmaths: the average frequency was 2.432 GHz. However, we obtained a considerable improvement in the signal-to-noise ratio of the 2.4 GHz emission by omitting the 2.496-GHz data taken until 2002 June 30, because they had higher in-band interference. The root-mean-square noise level in the four bands is listed in Table 7. This is the deepest multi-band search of ULX radio counterparts in a nearby galaxy, with excellent sensitivity (detection limit mJy) especially at the three highest observing frequencies.
We find no evidence of radio emission near the location of ULX 1. At the location of ULX 2, on the other hand, there is unresolved radio emission significantly above the noise level at 2.4 and 4.8 GHz (Table 7); at precisely the same location, there is also enhanced emission, above the average background level, at 1.4 and 8.6 GHz, but not strong enough to be considered a formal detection (– above the background). The 2.4 and 4.8 GHz fluxes suggest an optically-thin synchrotron source of index444Here we define . ; this spectral shape is also consistent with the flux measured at 1.4 and 8.6 GHz.
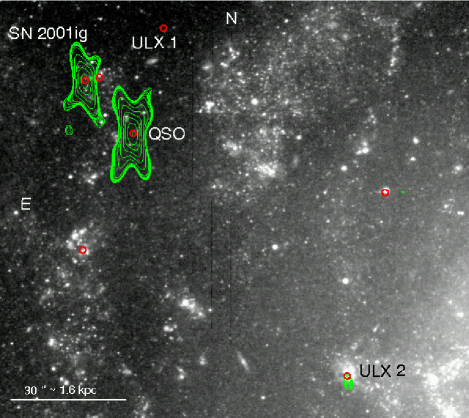
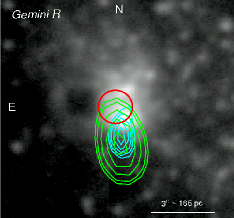
The source is detected at similar levels both in the combined 2.496-GHz dataset between 2001 December and 2002 June, and (with better signal-to-noise ratio) in the subsequent 2.368-GHz observations. This suggests that it did not arise as a result of (or in association with) the X-ray state transition of 2002 May/June, although we do not have a simultaneous X-ray/radio observation at that epoch. Figure 9 shows the resulting 2.368 GHz contours overlaid on a Gemini -band image, with Chandra error circles indicating the locations of X-ray point sources in the NE quadrant of the galaxy. The radio emission near ULX 2 is the third brightest source in this field, after SN 2001ig and the nearby background source (most likely a quasar).
| rms | |||
| (GHz) | (Jy) | (Jy) | (Jy) |
| Source near ULX 2 | Source B | ||
| 1.384 | 145 | () | () |
| 2.368 | 40 | 235 | 267 |
| 4.790 | 34 | 138 | 223 |
| 8.640 | 45 | () | NA |
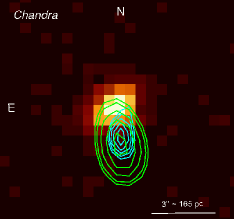
Taken together, the 2.4 and 4.8 GHz ATCA observations of ULX 2 provide conclusive evidence of a radio counterpart, physically associated with the X-ray source, the young stellar complex, or both. There are very few confirmed detections of individual radio sources associated with ULXs. The full list to-date consists of: one source in NGC 5408 (Kaaret et al. 2003; Soria et al. 2006); one in Holmberg II (Tongue & Westpfahl 1995; Miller, Mushotzky & Neff 2005); one in NGC 6946 (Roberts & Colbert 2006; Swartz et al. 2006 in preparation); and probably two in M 82 (Kronberg & Sramek 1985; Körding et al. 2005), where, however, confusion is a problem and chance coincidences are more likely. In NGC 7424, the centroid of the radio emission, both at 2.4 and 4.8 GHz, is clearly offset from the X-ray position of ULX 2 by , to the South (Figure 10). This corresponds to pc at the assumed distance. The offsets cannot be attributed to a systematic astrometric error as the radio coordinates of the peak emission from SN 2001ig and the nearby background source lie within their respective Chandra error circles. On the other hand, considering that there are no other radio or X-ray sources within 3 kpc, the possibility of a chance coincidence at least with the stellar complex, if not directly with the ULX, is unlikely.
5.2 Interpretation
There are a few possible interpretations of the candidate radio counterpart to ULX 2. One possibility is that the emission is Doppler-boosted synchrotron radiation from a jet. The one-sidedness of the radio offset from the Chandra position is then naturally explained by de-boosting of the opposite jet, as is often the case in radio galaxies and quasars. A radio offset of pc is not substantially larger than the size of the jet in, for example, the Galactic microquasar SS 433 (Downes, Pauls & Salter 1986; Dubner et al. 1998). However, a flat radio spectrum is expected from a steady jet in a beamed source (core emission), whereas our 2.4 and 4.8 GHz measured fluxes (Table 7) imply , which is more consistent with a radio lobe signature. We can also rule out (see also Freeland et al. 2006) the possibility that radio and X-ray emission are produced by the same synchrotron component. Optically-thin, Doppler-boosted radio emission may however be produced by sporadic ejections (eg., Fender, Belloni & Gallo 2004). Monitoring of the position and flux of the radio source in the next few years would test this scenario.
An alternative possibility is that the emission arises in a radio lobe, produced by long-term jet activity from ULX 2. It has been suggested (Heinz 2002; Hardcastle & Worrall 2000; Hardcastle 2005) that the radio lobes of microquasars may be considerably less prominent and more short-lived than those of FR II radio galaxies because of lower effective densities in the surrounding interstellar medium, relative to the intergalactic medium: the under-dense environment favours adiabatic losses over synchrotron losses. Moreover, the counterpart to ULX 2 appears to be a single radio structure, whereas FR II radio galaxies tend to exhibit double radio lobes. Nevertheless, it is possible that we see only a single radio lobe associated with ULX 2 because only one side of its jet has impacted onto a molecular cloud or an over-density in the local interstellar medium, allowing the lobe to form.
A third possibility is that the radio emission is optically-thin synchrotron radiation produced by a young SNR, perhaps from the progenitor of the BH in ULX 2 itself. We already noted from the Gemini data (Section 4) that ULX 2 lies in a region characterized by young star clusters, with characteristic ages – Myr. In fact, the position of the most massive cluster is still marginally consistent with the radio source. From its estimated mass and age (Section 4), we estimate a current rate of 1 SN every – kyr in that cluster alone, and 1 every – kyr in the whole complex. Hence, the odds of finding a young SNR (age yr) in that region are not negligible. As a comparison, the source is times as luminous as the prototypical core-collapse young SNR, Cas A, with a similar spectral index (Reynoso & Goss 2002). If the SNR is associated with the ULX, the radio/X-ray offset can be explained by an initial kick velocity: a recoil speed of would be sufficient to explain an pc offset after yr.
We can estimate an upper limit on the energy content of an expanding synchrotron bubble (SNR or lobe) using the minimum-energy argument (e.g., Pacholczyk 1970; Bicknell 2005). Since the source in NGC 7424 is unresolved, its linear size must be . Assuming a ratio of relativistic proton to electron energies , and a range of electron Lorentz factors , we obtain a total energy erg (see also a more extended discussion of this argument in Soria et al. 2006). This exceeds the typical energies inferred for normal supernovae: perhaps not surprisingly, since we already know that its radio luminosity would put it at the upper end of all known SNRs. However, the energy estimate is only an upper limit and is most sensitive to the source size , with . If one could firmly establish that the energy is too high to have been imparted by a supernova, then the jet scenario would become more likely. But one could equally well invoke a class of more energetic hypernovae, with a higher core mass, as the progenitors of ULXs. Higher spatial resolution maps with the VLA (in A or B configuration) could provide stronger observational constraints on the SNR versus lobe interpretation of the radio emission.
A similar ambiguity between the SNR and radio lobe scenarios was also discussed for the ULX/radio associations in Holmberg II (where the lobe interpretation is deemed much more likely: Miller et al. 2005) and NGC 5408 (where the lobe scenario was considered slightly more likely: Soria et al. 2006). Both radio counterparts are times less luminous than the source near ULX 2 in NGC 7424. The radio source near the ULX in NGC 6946 was initially classified as an SNR (MF 16: van Dyk et al. 1994; Blair, Fesen & Schlegel 2001) but is now also being re-evaluated as a possible radio-lobe structure, based on its associated optical morphology (Swartz et al. 2006, in preparation); its radio luminosity and spectral index are almost exactly the same as the source in NGC 7424. For M 82 (Körding et al. 2005), both ULX-D and ULX-F have persistent, compact radio sources slightly displaced ( and respectively) from the Chandra positions; both radio sources have a luminosity a factor of higher than the radio source near ULX 2 in NGC 7424. They have been classified as SNRs by analogy with other compact sources in M 82, but there are no elements to rule out a lobe origin. There was also a transient source near ULX-D ( displacement), reaching a luminosity times higher than the NGC 7424 source, in 1981, but declining and turning off after a few months; it can be interpreted either as a beamed flare from the ULX itself, or as a new supernova missed in the optical band because of extinction.
Perhaps the most striking similarity of all detections of candidate ULX radio counterparts is the association in all cases with young or actively star-forming regions. This suggests that the exceptionally strong radio emission is not intrinsic to the ULXs or due to chance geometrical factors (Doppler-boosted ejections) but is more likely to have been enhanced by the dense environment (radio lobe scenario) or to be due to young SNRs. So far, there have been no core radio detections of ULX counterparts. Hence, it is also evident that we cannot directly compare X-ray and radio luminosities via fundamental-plane relations (e.g., Merloni, Heinz & di Matteo 2003); we may instead compare, in principle, the ULX (instantaneous) X-ray luminosities with the (integrated) mechanical power injected into the radio lobes. If some or most ULX radio counterparts are synchrotron lobes, we would expect to find similar structures around other ULXs currently in quiescence; the relative abundance of such sources would constrain the average ULX duty cycle. It would be even more difficult to recognize and distinguish those radio sources from bright SNRs, when they are not associated with a bright, accreting X-ray source. If we only had the first of our two Chandra observations, ULX 2 itself may have gone unnoticed and its radio counterpart would have been classified as an SNR without further questioning.
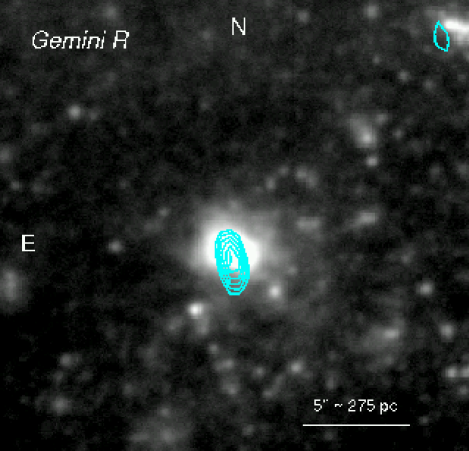
5.3 Source B: a pulsar wind nebula?
Finally, we found another exceptionally bright, unresolved radio source located south-west of the nucleus, coincident with another bright knot of young stars and clusters inside the southern spiral arm (Figures 1, 11); in the optical bands, this young complex is mag brighter than the stellar complex associated with ULX 2. A study of that region is beyond the scope of this paper. Here we simply point out that there is no X-ray emission erg s-1 from that complex. Instead, the radio source (J2000 coordinates: R.A. ; Dec. ), labelled “Source B” in Table 7, is even brighter than the one near ULX 2. It has a rather flat spectral index ( between and GHz.) Such indices are generally found in plerions, also known as pulsar-wind-nebulae (Weiler & Panagia 1978; Gaensler & Slane 2006); the Crab Nebula is the best-studied example. The radio emission in this class of SNRs is mostly powered by spin-down luminosity of the central compact object (a pulsar in all known cases), via a magnetized wind which may also interact with the expanding SNR shell. The radio luminosity of Source B in NGC 7424 is times the Crab luminosity; among the highest known, although similar or even higher luminosities were found in a few recent SNe such as SN 1979C and SN 1986J (Bartel & Bietenholz 2005). If Source B is indeed a pulsar wind nebula, a radio luminosity erg s-1 Hz-1 at GHz suggests an age a few yr (e.g., Bandiera, Pacini & Salvati 1984; Frail & Scharringhausen 1997); its X-ray luminosity may be erg s-1 (e.g., Becker & Trümper 1997), just below our detection limit.
6 Summary and conclusions
We studied the brightest X-ray sources and their optical and radio counterparts and environments in the face-on spiral galaxy NGC 7424. The galaxy was originally monitored in various energy bands to study the evolution of SN 2001ig. In particular, we studied it with Gemini in the , and optical bands, in 2004; with the ATCA in four radio bands, over many observations between 2001 and 2004; and with Chandra, twice, on 2002 May 21–22 and June 11. Optical and radio results on SN 2001ig are reported elsewhere (Ryder et al. 2004, 2006); here we only revise its X-ray colours and luminosity, erg s-1 on 2002 May 21–22, declining to erg s-1 on 2002 June 11, for a keV thermal plasma.
Our monitoring of NGC 7424 has led us to the serendipitous discovery of two ULXs with interesting multi-band properties. ULX 1 shows a increase in flux between the two observations, reaching an emitted luminosity erg s-1 in the second one. It may have been even brighter when observed by ROSAT, in 1990. Its X-ray spectrum is well fitted with a power-law of photon index . This is significantly flatter (harder) than the typical values found in Galactic BHs when they are bright () and power-law dominated. Various other bright ULXs have shown this feature, which is yet to be properly understood: we have briefly discussed some possible explanations. ULX 1 is in a relatively empty interarm region, far from any bright clusters or star-forming complexes; the brightest optical source in the Chandra error box has an absolute magnitude mag, consistent with a main-sequence B star.
ULX 2 is more peculiar for at least three reasons. Firstly, it showed some kind of outburst or state transition between the two Chandra observations, increasing its brightness by an order of magnitude. Thermal plasma emission is also detected in its high state. Secondly, unlike ULX 1, it is located in an exceptionally bright, young stellar complex (age – Myr depending on the assumed metal abundance), which also includes a few compact clusters. It is still unclear why some ULXs are in low-density, probably older environments while others are associated with OB associations and young star clusters. A similar dichotomy is sometimes found within the same galaxy. For example, the late-type spiral galaxy NGC 4559 also contains two bright ULXs (Cropper et al. 2004), one of them located in an interarm region relatively devoid of bright stars, the other in a bright star-forming complex a few hundred pc in size (Soria et al. 2005).
In the case of ULX 2 in NGC 7424, the biggest star cluster in its environment has a mass a few . In general, ULXs seem to be associated with young medium-size clusters much more often than with super star-clusters (). This may give us a clue to the most likely formation process for the accreting BHs. In fact, the observed X-ray luminosities only require BH masses up to . The necessary (but not sufficient) condition to end up with such a BH is to have a massive stellar progenitor, perhaps up to , preferebly with low metal abundance. We speculate that the most efficient process to create such a massive progenitor could be an externally-triggered, dynamical gas collapse in a medium-size protocluster, together with a few Class-0 protostellar mergers, rather than runaway mergers of main-sequence O stars in a super star-cluster.
The third reason why ULX 2 is remarkable is the presence of an exceptionally bright (twice as luminous as Cas A), unresolved radio source slightly offset from the ULX ( pc). Its radio spectral index () is consistent with optically-thin synchrotron emission. Two alternative interpretations for the radio source are either lobe emission, powered by a ULX jet, or a young, bright SNR (or perhaps hypernova remnant) associated with the young stellar complex or maybe even the progenitor of the ULX itself. Compact radio sources of similar brightness and spectral index have been found associated with a handful of other ULXs, in some cases implying energies up to erg. In almost all cases, it is impossible to rule out either of those two scenarios altogether. It may even be possible that jet lobes and an underlying SNR coexist, like in the Galactic microquasar SS 433.
Another bright (in fact, even brighter), unresolved radio source was found in the southern spiral arm, also associated with a young, massive stellar complex. In that case, however, there are no X-ray sources nearby. Moreover, its radio spectral index is flatter (). We speculate that it is most likely to be a very young pulsar-wind nebula, times more luminous than the Crab Nebula. However, further radio and X-ray observations of this peculiar source will be necessary to test this hypothesis and rule out other scenarios, for example beamed radio core emission from a microblazar.
This year, Chandra is carrying out a complete snapshot survey of ULXs in about 150 galaxies within 15 Mpc, to pinpoint their locations (PI: D. Swartz). A systematic optical survey of the same galaxies is also being carried out or planned, to classify and study the ULX optical counterparts. However, much more work remains to be done to plan and implement a correspondingly deep, complete radio survey, which would determine what fraction of ULXs are associated with optically-thin synchrotron sources, whether those sources are statistically different from normal SNRs, and perhaps also help distinguishing between SNR and radio lobe scenarios. The long-term goal of combined radio/X-ray studies is to determine the balance of power in accreting BHs, between radiative (X-rays) and mechanical luminosity (jet power) in different spectral states.
Acknowledgments
We thank Geoff Bicknell and Richard Hunstead for discussions. RS acknowledges support from an OIF Marie Curie Fellowship, as well as financial support from the University of Sydney during his visit there.
References
- (1) Arnaud K. A., 1996, in Jacoby G. H., Barnes J., eds, Astronomical Data Analysis Software and Systems V, ASP Conference Series, Vol. 101, p. 17
- (2) Bałucińska-Church M., McCammon D., 1992, ApJ, 400, 699
- (3) Bandiera R., Pacini F., Salvati M. 1984, ApJ, 284, 134
- (4) Barger A. J., et al., 2003, AJ, 126, 632
- (5) Becker W., Truemper J., 1997, A&A, 326, 682
- (6) Bicknell G. V., 2005, Lecture Notes on High Energy Astrophysics (Australian National University, Canberra), http://www.mso.anu.edu.au/geoff/HEA/HEA.html
- (7) Blair W. P., Fesen R. A., Schlegel E. M., 2001, AJ, 121, 1497
- (8) Böker T., Laine S., van der Marel R. P., Sarzi M., Rix H.-W., Ho L. C., Shields J. C. 2002, AJ, 123, 1389
- (9) Colbert E. J. M., Miller M. C., 2004, in Novello M., Perez-Bergliaffa S., Ruffini R., eds, proceedings of the Tenth Marcel Grossmann Meeting on General Relativity, Rio de Janeiro, July 20-26, 2003. World Scientific, Singapore (astro-ph/0402677)
- (10) Cropper M., Soria R., Mushotzky R. F., Wu K., Markwardt C. B., Pakull M., 2004, MNRAS, 349, 39
- (11) Dickey J. M., Lockman F. J., 1990, ARA&A, 28, 215
- (12) Downes A. J. B., Pauls T., Salter C. J., 1986, MNRAS, 218, 393
- (13) Dubner G. M., Holdaway M., Goss W. M., Mirabel I. F., 1998, AJ, 116, 1842
- (14) Evans R. O., White B., Bembrick C., 2001, IAUC 7772
- (15) Fabbiano G., White N. E., 2006, in Lewin W. H. G., van der Klis M., eds, Compact Stellar X-ray Sources. Cambridge Univ. Press, Cambridge (astro-ph/0307077)
- (16) Fabbiano G., et al., 2003, ApJ, 584, L5
- (17) Fabrika S., Mescheryakov A., 2001, in Schilizzi R. T., ed., Proceedings of IAU Symposium 205, Manchester, August 2000, p. 268 (astro-ph/0103070)
- (18) Fender R. P., Belloni T. M., Gallo E., 2004, MNRAS, 355, 1105
- (19) Frail D. A., Scharringhausen B. R., 1997, ApJ, 480, 364
- Freeland et al. (2006) Freeland M., Kuncic Z., Soria R., Bicknell G. V., 2006, MNRAS, submitted.
- (21) Gaensler B. M., Slane P. O., 2006, ARA&A, Vol. 44, 17, in press (astro-ph/0601081)
- (22) Goncalves A. C., Soria R., 2006, MNRAS, submitted
- (23) Gürkan M. A., Freitag M., Rasio F. A., 2004, ApJ, 604, 632
- Hardcastle (2005) Hardcastle, M. J. 2005, A&A, 434, 35
- (25) Hardcastle M. J., Worrall D. M., 2000, MNRAS, 319, 562
- Heinz (2002) Heinz, S. 2002, A&A, 388, L40
- Kaaret et al. (2003) Kaaret, P., Corbel, S., Prestwich., A. H., Zezas, A. 2003, Science, 299, 365
- (28) Kalogera V., Henninger M., Ivanova N., King A. R., 2004, ApJ, 603, L41
- (29) King A. R., 2006, in Lewin W. H. G., van der Klis M., eds, Compact Stellar X-ray Sources. Cambridge Univ. Press, Cambridge (astro-ph/0301118)
- (30) King A. R., Davies M. B., Ward M. J., Fabbiano G., Elvis M., 2001, ApJ, 552, L109
- (31) Körding E., Falcke H., Markoff S., 2002, A&A, 382, L13
- Körding et al. (2005) Körding, E., Colbert, E., Falcke, H. 2005, A&A, 436, 427
- Kronberg & Sramek (1985) Kronberg, P. P., Sramek, R. A. 1985, Science, 227, 28
- (34) Kuncic Z., Bicknell G. V., 2004, ApJ, 616, 669
- (35) Leitherer C., et al. 1999, ApJS, 123, 3
- (36) McClintock J. E., Remillard R. A., 2006, in Lewin W. H. G., van der Klis M., eds, Compact Stellar X-ray Sources. Cambridge Univ. Press, Cambridge (astro-ph/0306213)
- (37) Makishima K., Maejima Y., Mitsuda K., Bradt H. V., Remillard R. A., Tuohy I. R., Hoshi R., Nakagawa, M., 1986, ApJ, 308, 635
- (38) Markoff S., Falcke H., Fender R., 2001, A&A, 372, L25
- (39) Markoff S., Nowak M. A., Wilms J., 2005, ApJ, 635, 1203
- (40) Merloni A., Heinz S., di Matteo T., 2003, MNRAS, 345, 1057
- (41) Meyer F., Meyer-Hofmeister E., 1981, A&A, 104, L10
- (42) Miller J. M., Fabian A. C., Miller M. C., 2004, ApJ, 614, L117
- Miller et al. (2005) Miller N. A., Mushotzky R. F., Neff S. G., 2005, ApJ, 623, L109
- (44) Moretti A., Campana S., Lazzati D., Tagliaferri G., 2003, ApJ, 588, 696
- (45) Nowak M. A., Wilms J., Heindl W. A., Pottschmidt K., Dove J. B., Begelman M. C.. 2001, MNRAS, 320, 316
- (46) Pacholczyk A. G., 1970, Radio Astrophysics (San Francisco: Freeman)
- (47) Peretto N., André P., Belloche A., 2006, A&A, 445, 979
- (48) Portegies Zwart S. F., McMillan S. L. W., 2002, ApJ, 576, 899
- (49) Reynoso E. M., Goss W. M., 2002, ApJ, 575, 871
- (50) Roberts T. P., Colbert E. J. M., 2003, MNRAS, 341, L49
- (51) Ryder S. D., Murrowood C. E., Stathakis R. A., 2006, MNRAS, in press (astro-ph/0603336)
- Ryder et al. (2004) Ryder, S. D., Sadler, E. M., Subrahmanyan, R., Weiler, K. W., Panagia, N., Stockdale, C. 2004, MNRAS, 349, 1093
- (53) Shakura N. I., Sunyaev R. A., 1973, A&A, 24, 337
- (54) Schlegel E. M., Ryder S., 2002, IAUC 7913
- (55) Soria R., Cropper M., Pakull M., Mushotzky R., Wu K., 2005, MNRAS, 356, 12
- Soria et al. (2006) Soria, R., Fender, R. P., Hannikainen, A. M., Read, A. M., Stevens, I. R. 2006, MNRAS, in press (astro-ph/0603029)
- (57) Stobbart A.-M., Roberts T. P., Wilms J. 2006, MNRAS, 368, 397
- (58) Strickland D. K., Colbert E. J. M., Heckman T. M., Weaver K. A., Dahlem M., Stevens I. R., 2001, ApJ, 560, 707
- Tongue & Westpfahl (1995) Tongue, T. D., Westpfahl, D. J. 1995, AJ, 109, 2462
- (60) Tully R. B., 1988, Nearby Galaxy Catalog (Cambridge University Press)
- (61) van Dyk S. D., Sramek R. A., Weiler K. W., Hyman S. D., Virden R. E., 1994, ApJ, 425, L77
- (62) van Paradijs J., 1996, ApJ, 464, L139
- (63) Voges W., et al., 2000, ROSAT All-Sky Survey Faint Source Catalog (available on VizieR)
- (64) Walcher C. J., et al., 2005, ApJ, 618, 237
- (65) Weiler K. W., Panagia N., 1978, A&A, 70, 419
- (66) Wilms J., Allen A., McCray R., 2000, ApJ, 542, 914
- (67) Winter L. M., Mushotzky R. F., Reynolds C. S., 2006, ApJ, submitted (astro-ph/0512480)
- (68) Wu K., Soria R., Page M. J., Sakelliou I., Kahn S. M., de Vries C. P., 2001, A&A, 365, L267