Konkoly Observatory, Budapest, Pf. 67, H-1525 Hungary
11email: E.Forgacs-Dajka@astro.elte.hu
Dynamics of the fast solar tachocline
We present detailed numerical calculations of the fast solar tachocline based on the assumption that the dynamo field dominates over the dynamics of the tachocline. In the present paper of the series, we focus on three shortfalls of the earlier models. First, instead of the simple oscillating dipole poloidal field we study the more general magnetic field structures reminiscent of the butterfly diagram. The migrating field is prescribed as the observed axisymmetric radial magnetic field (Stenflo, 1988, 1994). Our results are in good agreement with our analitical estimate and our previous works in Forgács-Dajka & Petrovay (2001, 2002), but the polar ”dip” in isorotational surfaces is strongly reduced in this case. On the other hand, a more realistic model should have a magnetic diffusivity decreasing significantly inside the radiative interior, so we also explore the effect of diffusivity and magnetic Prandtl number varying with depth. We found that the downwards decreasing magnetic diffusivity and Prandtl number have no significant effect on the solution, although the temporal variation of the tachocline thickness has decreased.
Key Words.:
Sun: interior, MHD, Sun: rotation1 Introduction
Helioseismic data allow us to study the structure and rotation rate of the solar interior. The tachocline is a thin transitional layer below the solar convective zone. In this layer the surface-like rotation of the convection zone changes to near-uniform rotation in the radiative interior. The existence and properties of this layer have been known from helioseismic studies, recently reviewed by Corbard et al. (2001). The tachocline is known to be extremely thin; the central radius of the tachocline appears to lie within the range , and its thickness is estimated to be (Kosovichev, 1996; Corbard et al., 1999; Schou et al., 1998; Charbonneau et al., 1999).
Precise values for the parameters of the solar tachocline as such mean position, thickness, latitudinal and temporal variations, depend on the inversion techniques used for helioseismic data. Elliott & Gough (1999) suggest that there exists a difference in the sound speed profile between the observations and the Standard Solar Models. By including an additional mixing layer below the convection zone, they calibrate the thickness of the tachocline and they find that the mean tachocline thickness is with a formal standard error of about %. The observed light-element abundances at the surface also suggest that the mixing process in the solar tachocline is confined to a shallow layer (Brun et al., 1999, 2002).
Making use of the most recent helioseismic results one can investigate the temporal variation and the latitudinal structure of the tachocline. Basu & Antia (2001) found that the tachocline is prolate, with the difference between the tachocline position at and that at latitude being about . This is in agreement with results obtained by Charbonneau et al. (1999). Basu & Antia (2001) also report an increase in thickness of the tachocline with latitude, but this increase is less significant, though still at the level. Regarding the dynamical aspect, one would expect temporal variations associated with the solar cycle to appear in the tachocline (Howe et al., 2000; Basu & Antia, 2001; Corbard et al., 2001). Howe et al. (2000) report that a large-scale oscillation may be taking place in this layer with a period about yr. It is not clear whether this period is associated with solar-cycle-related variations, and Basu & Antia (2001) did not find any periodic or systematic changes in rotation rate in the tachocline region. This fact may be the consequence of the insufficiency of the helioseismic data.
The extreme thinness of the tachocline implies a strongly anisotropic transport of angular momentum (Spiegel & Zahn, 1992). Several different mechanisms have been proposed for this transport, but it is now widely believed that the magnetic field is instrumental in its origin. It is known that an oscillating magnetic field cannot propagate far into the radiative zone. The extent of the penetration of this magnetic field is the skin depth , where is the magnetic diffusivity and is the frequency of the cycle. On the one hand, for cms the dynamo field cannot penetrate the tachocline, and we can expect the tachocline to be pervaded by the internal primordial field. On the other hand, for cms the tachocline dynamics should be governed by the dynamo field. As the associated diffusive and Lorentz timescales are also very different, these two cases basically correspond to the case of “slow” and “fast” tachocline, discussed in the literature (see esp. Table I in Gilman, 2000).
In recent years the case of a slow tachocline has been investigated extensively by a number of authors. Rüdiger & Kitchatinov (1997) and MacGregor & Charbonneau (1999) studied the interaction between a large-scale field with fixed poloidal component and differential rotation without taking into consideration the meridional circulation. They found that the internal poloidal field of G is sufficient to confine the tachocline to its observed thickness if the internal field is fully contained within the radiative zone. Gough & McIntyre (1998) presented a model for the solar tachocline which allows the nonlinear interaction between the meridional flows and a large-scale magnetic field in self-consistent way. Garaud (2001) performed calculations taking into account the meridional flow and the self-consistent evolution of the poloidal field.
In the first paper of these series (Forgács-Dajka & Petrovay, 2002, hereafter Paper I), we studied the alternative case of a fast, turbulent tachocline with a turbulent diffusivity of about cm2/s and we presented detailed numerical calculations allowing for the self-consistent evolution of the dipolar poloidal field. It was found that a sufficiently strong oscillatory poloidal field with dipolar latitude dependence at the tachocline-convective zone boundary is able to confine the tachocline to its observed thickness. This is in good agreement with our analitical estimate in Forgács-Dajka & Petrovay (2001).
In this paper, instead of a dipolar field we consider the more realistic case of a migrating field, studying its effect on the dynamics of the solar tachocline. After formulating the mathematical problem in Sect. 2, results of our model containing a migrating magnetic field will be presented in Sect. 3 We also explore the effect of the meridional flow and the impact of varying the diffusivity with radius. Finally, Sect. 4 summarizes the main results.
2 The model
In order to describe the differential rotation and the evolution of the large-scale magnetic field in the solar interior it is useful to write the equation of motion and the hydromagnetic induction equation in a frame rotating with the fixed internal rotation rate. These equations can be found in the first paper of these series (Paper I Sect. 2.1).
2.1 Flow Field
The flow field was treated in the same manner as in Paper I, nevertheless, some additional remarks are taken here. As we mentioned in Paper I Sect. 3.4, the total flow field can be written as the sum of the differential rotation and meridional circulation. While we compute the evolution of the angular velocity with time, the meridional circulation is prescribed in our region, because in this case we focus on the effect of any meridional circulation in the tachocline, not on the complex problem of meridional circulation in the convective zone. Recent helioseismic inversions have shown that the outer convective envelope is pervaded by a poleward meridional flow. Such inversions currently do not provide accurate meridional flow information at greater depth, thus we turn for guidance to the numerical simulations of thermally driven turbulent convection recently carried out by Miesch et al. (2000), Küker & Stix (2001) and Kitchatinov & Rüdiger (1995). These simulations generate a mean meridional circulation and in these the meridional flow penetrates into the stable interior. In an attempt to incorporate at least qualitatively these observational and computational results, we used a model similar to that described in Paper I.
The strong subadiabatic stratification of the solar interior sets an upper limit to the meridional flow. An elementary estimate discussed in Paper I yields . On the other hand Miesch et al. (2000) found that depending on assumed values of some of the input parameters this pattern is a persistent equatorward or poleward circulation in the overshoot region. Accordingly, the flow parameters used in our calculations were chosen to produce simple smooth one- and two-celled flow patterns obeying the amplitude constraint as before mentioned, while reproducing the observed flow speed near the surface. For the density, we used the following expression:
| (1) |
where the values of the parameters used are , and . The flow patterns are shown in Paper I Figs. 9 and 10. In these cases, the speed of the horizontal motion is cm/s in the upper part of the radiative interior.
2.2 Poloidal Field

It is well known that sunspot activity occurs in the form of waves with periods yr, which propagate from middle latitudes towards the solar equator. In the extended butterfly diagram (Makarov & Sivaraman, 1989), one can see the poleward migration of the magnetic fields indicated by the migration pattern of a number of tracers such as quiescent prominences or the coronal green line.
Stenflo (1988, 1994) analyzed yr of synoptic observations of the Sun’s magnetic field carried out daily at the Mount Wilson and Kitt Peak observatories over all solar latitudes and longitudes. The observed longitudinal magnetic field has been converted to a radial magnetic field assuming that the field direction is on average radial in the layers where the field is measured. This provides an opportunity to analyse the global modes of the Sun. Stenflo (1988, 1994) expanded the radial magnetic field in spherical harmonics and he found that the zonal magnetic field pattern can be represented as a superposition of discrete modes with purely sinusoidal time variations with frequency yr-1. Consequently, the evolutionary pattern of the axisymmetric radial magnetic field can be written in the following form:
| (2) |
with
| (3) |
where is the radial, axisymmetric magnetic field, is the amplitude, is the phase lag, is the time lag and .
Petrovay & Szakály (1999) found that the latitudinal distribution of the field at the surface reflects the conditions at the bottom of the convective zone, i.e. in this regard the convective zone behaves as a “steamy window”. Thus, if we assume that the above formula describes the time-evolution of the radial magnetic field at the base of the convective zone, then the development of the vector potential is given by:
| (4) |
where is an arbitrary function. Stenflo (1988, 1994) also studied the dominance of the odd and even modes and he showed that the odd modes prevail in the evolution of the radial, axisymmetric magnetic field.
2.3 Equations for Our Model
Based on Paper I Sect. 2.1, the azimuthal components of Eqs. (1–2), including the effects of diffusion, Coriolis force, meridional circulation, toroidal field production by shear, and Lorentz force, read
| L | ||||
| C | ||||
| M1 | ||||
| M2 | ||||
| M3 | ||||
(For the sake of completeness we repeated here Eqs. () of Paper I which contain a typo.) In these equations, represents the terms associated with the Lorentz force, denotes the terms associated with the Coriolis force and M1, M2, M3 denote the terms associated with the advection by meridional circulation.

2.4 Boundary Conditions for the Physical Parameters
Our model does not include the convection zone, so the computational domain for the present calculations consists of just an annular meridional cut in the northern hemisphere in the upper part of the radiative interior, between radii and , where is the radius of the bottom of the convection zone. For the solution of Eqs. (2.3–2.3) we use the following boundary conditions.
Assuming the deep radiative core to be a rigidly rotating perfect conductor, we set both and to zero at the lower boundary. Both these quantities are also set to zero along the symmetry axis and they are antisymmetric about the equator. Furthermore, our upper boundary condition on the poloidal field is the solution of Eq. (4). For the upper boundary condition chosen for the toroidal field we assume that the toroidal field is negligible in the convective zone compared to its value in the tachocline. Such a hypothetical situation is in line with current thinking in dynamo theory, and it may be a natural consequence of buoyancy-driven instabilities effectively removing any toroidal flux from the convective zone.
For we require axial and equatorial symmetry, and at the bottom of the convection zone we suppose that the rotation rate can be described with the same expression as in the upper part of the convection zone. Since the observations indicate that the differential rotation varies little within the convection zone and in the deep radiative interior, we can take at the bottom of the computational domain, so the lower boundary condition for is different than in Forgács-Dajka & Petrovay (2001, 2002) where at the bottom of our box. Finally, we summarize and formulate these conditions in this way:
| (16) |
where is the rigid rotation speed at the observed rate nHz and is the rotation rate, which can be described with the same expression as in the upper part of the convection zone.
In accordance with the observations of the GONG network, the expression used for is
| (17) |
2.5 Solution procedure
The Navier-Stokes, the induction equations and the equation for the poloidal magnetic field are coupled, nonseparable partial differential equations. We solve them as an initial-boundary value problem. We use a time relaxation method with a finite difference scheme first order accurate in time to solve the equations. A uniformly spaced grid is set up with 128 grid points in the direction and 64 grid points in the direction.
The initial conditions chosen for all calculations are
| (24) |
Starting from the initial conditions, the solution is allowed to evolve in time until it relaxes to a very nearly periodic behaviour.

3 Results
As stated above, we examine the influence of a migrating field on the radial spreading of the differential rotation into the radiative interior. Prescribing a migrating magnetic field at the top we define the form of the vector potential from the observed radial magnetic field. Besides the effect of the field strength, we study the consequences of the varying the diffusivity and the magnetic Prandtl number with radius, and the influence of the meridional circulation.
3.1 Solution Without Meridional Circulation
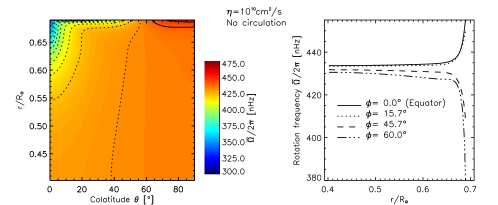
In the first calculations, only the field strength varies from case to case. The values of the viscosity and magnetic diffusivity chosen for these simulations are identical, , i.e. the magnetic Prandtl number is one and the meridional circulation is neglected. Several calculations were run with different field strengths and we chose the most suitable case for us, where the sufficiently strong magnetic field is able to interfere the spreading of the differential rotation into the radiative interior and to reproduce the observed thickness of the tachocline. This case is shown in Fig. 2 after relaxation 111Color figures and computer animations illustrating the time development of some of our solutions can be downloaded from the following web site: http://astro.elte.hu/kutat/sol/fast2/fast2e.html.
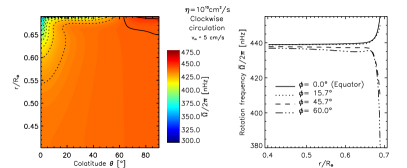
In the left-hand panel we plotted the contours of the time-average of the rotation rate, which is defined as
| (25) | |||||
| (26) |
where yr is the period of the cycle.
In the right-hand panel we plotted the rotation rate at different latitudes as a function of radius. We note that in Paper I we plotted the differential rotation amplitude in right-hand panels, where was weighted with latitude and was normalized (see Eq. (23) in Paper I). However, in this paper we retained the values of the frequency, so in this case the results can be compared easier with helioseismic observations and even the more insignificant variations of the rotation rate are more conspicouos. Based on the helioseismic observations we expect that the differential rotation changes to the rigid rotation in a thin transition region. It is well visible that the prescribed differential rotation at the base of the convection zone changes to the near-uniform rotation in a thin layer.
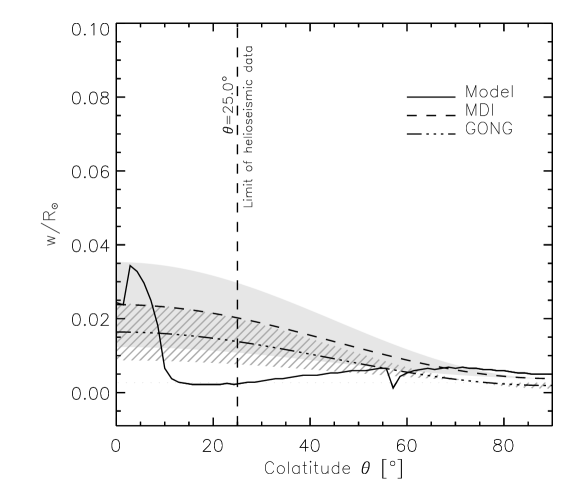
We also study in detail the dynamics of the tachocline and compare to the observations. Accordingly, the thickness of the tachocline and the change in the rotation rate across the tachocline are defined as in Basu (1997). Thus, the jump in the rotation rate across the tachocline is the difference between the rotation rate at the base of the convection zone and the rotation rate in the interior. The thickness of the tachocline is defined as the rotation rate increases from the factor of its maximum value to the factor of its maximum value in the range to .
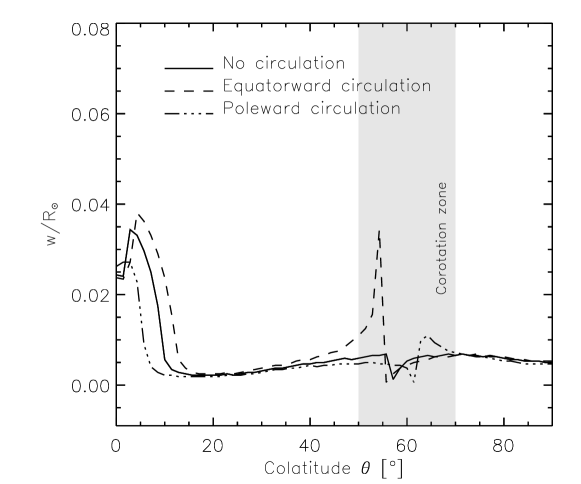
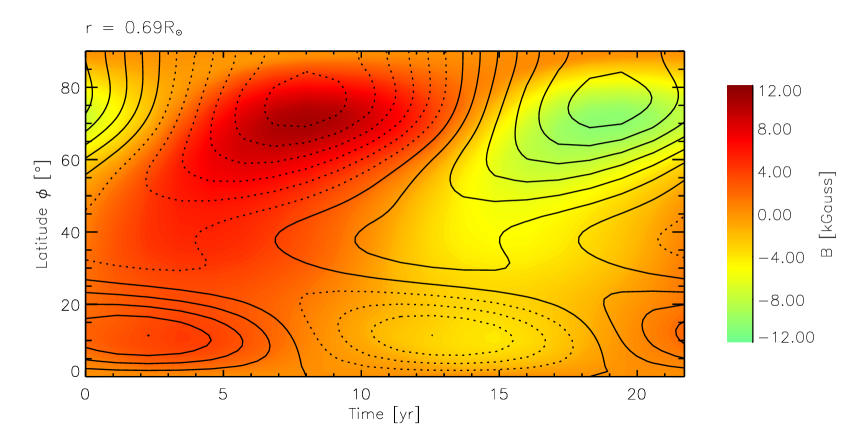
The fast tachocline shows a quite marked latitude-dependence in our results, as illustrated in Figs. 3-4. In both figures we also plot the results of the helioseismic measurements from MDI and GONG (Basu & Antia, 2001). It should be noted that, according to the helioseismic results, the latitudinal variation in position of tachocline is significant, while the variation in width is not clear, but the results tend to suggest that the thickness increases with latitude. Since the top of the computational domain is fixed at in our model, therefore the position of the tachocline cannot be directly compared with the observations. Notice that the thickness of the tachocline is close to zero at around the colatitude of , because at this colatitude the rotation rate is equal to the rigid rotation velocity. This region is the so-called corotation zone (Fig. 3). In addition to latitudinal variations, we also investigate the temporal variations in the properties of the tachocline, and we find that the thickness of the tachocline depends on cycle phase (Fig. 5). This variation is not confirmed by the observations, but the helioseismic data set is relatively short. The development of the toroidal magnetic field and the radial magnetic field shown in Fig. 6 correspond to the observed evolutionary pattern of the magnetic field, i.e. the butterfly diagram.
3.2 Solution With Weak Meridional Circulation
In the second case, we study the influence of the meridional circulation. As we mentioned, the strong subadiabatic stratification sets an upper limit to the amplitude of the meridional circulation ().
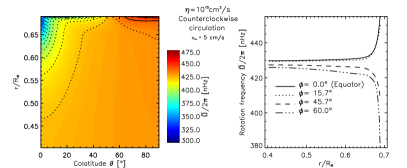
We use the flow patterns shown in Paper I Figs. 9 and 10, where the speed of the horizontal flow is weak. In these cases, we considered the effect of the meridional flow on the magnetic field (M2, M3 in Eqs. (2.3-2.3)). The results with the meridional circulation included can be seen in Fig. 7. The poloidal field amplitude used here was the same as in the previous case. Notice that the effect of the weak meridional flow of on the magnetic field is not dramatic.
In Fig. 7 it can be seen that the rigid rotation rate is shifted compared to the first case in accordance with the direction of flow. An equatorward flow in the tachocline region increases the near-uniform rotation rate, while a poleward flow reduces it. We remark that the lower boundary condition for is different than in Forgács-Dajka & Petrovay (2001, 2002) where at the bottom of our box. In these cases at the bottom of the computational domain, so the effect of the meridional circulation on the rotation is perceptible in the radiative interior. It is apparent that the deep meridional flow changes the rigid rotation rate. If we raised the amplitude of the meridional circulation at the upper part of the radiative interior (), but we reduced the penetration of the meridional circulation – the meridional motion is in the overshoot region –, the shift is not dramatic. This result could play an important role in the model for the solar dynamo models wherein a meridional flow penetrates into the stable layers below the tachocline (Nandy & Choudhuri, 2002).
In Fig. 8 the differences between the three results are apparent. Note that the rotation rate in the interior is changed in these cases and we used it to define the thickness of the tachocline. It is well visible that the effect of the weak circulation is not dramatic and chiefly limited to the pole. In this paper the toroidal field strength is higher as in the earlier paper and on the other hand the upper boundary condition on the poloidal field is controlling the influence of the meridional motion. In case of equatorward circulation it can be seen that the tachocline thickness at the pole extended and in the corotation zone the peak is apparent. Both are due to the transport by the equatorward motion. If we assume that in the tachocline region the circulation is toward the pole then the thickness at the high latitudes is reducible. It must be noted of course that the solar dynamo theories favour the counterclockwise circulation. On the other hand in our model we have not emphasized the role of the circulation, but the role of the Maxwell stresses which are capable to limit the shear layer to its observed thickness. We studied it for the sake of completeness.
3.3 Varying the diffusivity with radius and
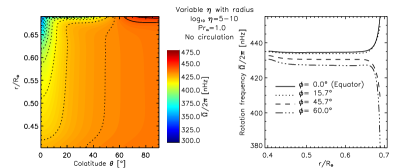
In this section the diffusivity is allowed to vary with radius. In Paper I we only investigated cases where the diffusivities are constant throughout the computational domain. The question may arise that the high viscosity in the deep radiative zone could be a disfigurement to our results? In order to answer, we change the magnetic diffusivity and the viscosity with radius as
| (27) |
where , is the maximum value of the diffusivity and viscosity, and are geometric parameters. Important notice that the used numerical technique sets a limit to this variation with radius. Namely, the lowest value of viscosity or magnetic difusivity in the domain determines the diffusive timescale as against the time step which is determined by the highest value of these. Hence the very low value of viscosity gives rise to the extremly long integration times.
Thus, in this case we set these parameters as follows: , and , and the magnetic Prandtl number is one . The magnetic diffusivity is varied with depth between approx. and . This variation of the diffusivity, while quantitatively much milder than expected physically, provides an opportunity for us to consider the effects of a variable diffusivity without the necessity of impossibly long integration times.
In left-hand panel of Fig. 9 it is clearly visible that the influence of the downwards decreasing diffusivity on the solution is small. However it is noticeable that in the polar region the differential rotation penetrates into deeper layers of the radiative interior. On the other hand the amplitude of the temporal variation of the thickness is smaller than in the case of Fig. 5.
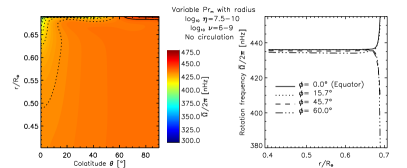
3.4 Varying the magnetic Prandtl number with depth
Under realistic conditions, the turbulent magnetic diffusivity in the tachocline should be reduced to the microscopic magnetic diffusivity in the radiative core and the turbulent viscosity to molecular and radiative viscosity. However the magnetic diffusivity is greater than the viscosity and it is less reduced than the viscosity (see esp. Fig. 1 in Rüdiger & Kitchatinov, 1997), so the magnetic Prandtl number is varied with depth.
As argued earlier, the low diffusivities often make the numerical simulations problematic, therefore we tried to give a qualitative test instead of a quantitative analysis. Accordingly, we used the above formula (27) to define the variation of and with radius and the required parameters are following: , , for and , , for , so the magnetic Prandtl number is varied between 0.024 and 0.1.
Our result is illustrated in right-hand panel of Fig. 9. In this case the poloidal field strength is G and the maximum value of the toroidal field is G. It is well visible that the penetration of the differential rotation into the radiative interior is strongly reduced in the polar region and the temporal variation of the thickness is also decreased (see Fig 10).

4 Discussion and Conclusion
The models discussed in this paper show that the dynamo field dominates over the dynamics of the fast solar tachocline provided that the turbulent diffusivity in the tachocline region exceeds cms.
In our first work (Forgács-Dajka & Petrovay, 2001) we presented an analytical estimate for the strength of an oscillatory poloidal field, which is able to confine the tachocline to its observed thickness for cms. Based on the estimate we showed a simple numerical calculation. A crucial assumption in this calculation is that the oscillatory poloidal magnetic field does penetrate below the convective zone to depths comparable to the tachocline thickness and the penetration is prescribed a priori.
In our forthcoming model (Paper I), instead of the a priori prescribed oscillatory poloidal magnetic field we included the evolution equation for the poloidal field, but the poloidal field was a simple oscillating dipole, which was not very realistic. In that work we also explored the parameter space a bit more widely by varying the magnetic Prandtl number and the diffusivity, but we did not investigate the effects of the variations of these parameters with depth. We found that the confining field strength increased with increasing viscosity and magnetic Prandtl number.
In the present work we focus on three shortfalls of the earlier models. First, instead of the simple oscillating dipole poloidal field we study the more general magnetic field structures reminiscent of the butterfly diagram. On the other hand, a more realistic model should have a magnetic diffusivity decreasing significantly inside the radiative interior.
For the more general magnetic field structures, we use the results of Stenflo (1988, 1994), where the evolutionary pattern of the axisymmetric magnetic field can be written as a superposition of the sinusoidal, yr variations for the odd modes spherical harmonic components. Based on our previous works we studied the field strength and we found that a sufficiently strong migrating magnetic field is able to reproduce the observed thickness of the tachocline. This agrees with the results in Forgács-Dajka & Petrovay (2001, 2002), apart from the fact that the time-latitude diagram for the toroidal field (Fig. 6) is now similar to the butterfly diagram. The lower boundary condition for is different than in Forgács-Dajka & Petrovay (2001, 2002), giving us a possibility to study the effect of the dynamics of the upper layers on the inside layers. In Fig. 2 it can be seen that because of the high diffusivity there is a little deviation in the rotation rate compared to the fixed internal rotation rate at different latitudes. Furthermore an equatorward meridional circulation in the tachocline region increases the near-uniform rotation rate, while a poleward flow reduces it. Note that this phenomenon is sensitive to the penetration depth of the flow into the upper radiative interior. We found that the internal rotation rate is not shifted extremly in spite of the increasing amplitude of circulation if the circulation is dominated in the upper part of the tachocline. The downwards decreasing diffusivity or rather the magnetic Prandtl number does not appreciably affect the solution. Evidently, this model is simplified treatment of the turbulence in the tachocline, nevertheless it gave us an opportunity to consider these effects. The varying magnetic diffusivity and Prandtl number with depth give rise to a change of the temporal variation of the tachocline thickness. It is shown in Fig. 10 that the downwards decreasing magnetic Prandtl number tends to reduce the spatiotemporal variation.
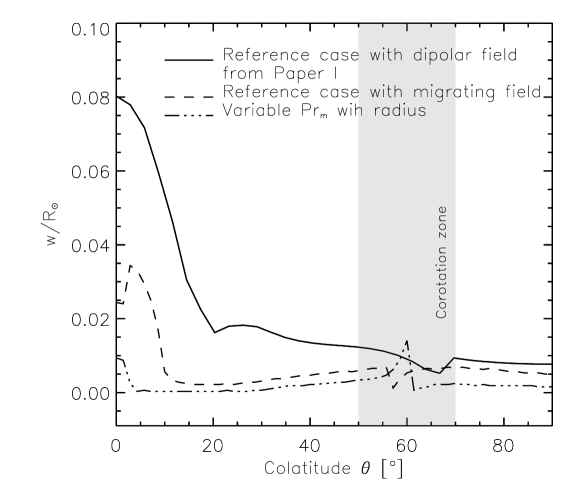
The main results of present and earlier models is that the dynamo field in the turbulent tachocline by Maxwell stresses is capable to limit the shear layer to its observed thickness. The next step of this analysis consists in comparing the numerical results in the present work and the model in Paper I with the helioseismic results. In Paper I the thickness of the tachocline showed the ”pit” at the pole, which is not confirmed by the available helioseismic information, which may be in consequence of the latitudinal limit of observations. In Paper I the poloidal field was a simple oscillating dipole, and the reality of this pit needs to be verified with other poloidal field geometries and other parameters. In this paper we found that in case of the more general magnetic field structure the polar pit is reduced to its half and in case of varying the magnetic Prandtl number with depth the pit is almost disappeared (Fig. 11). If we use the more general field geometry reminiscent of the butterfly diagram, the penetration depth of the differential rotation into the radiative interior in the polar region is decreased owing to the fact that at higher latitudes the stonger magnetic fields stay up. In case of the decreasing magnetic Prandtl number the influence of the Maxwell stresses are in the ascendant compared with the viscous stresses, so the permeation of the differential rotation below the convective zone at the pole reduces further. On the other hand regarding the dynamical aspect, we studied the temporal variations of tachocline. Due to the relatively short helioseismic data set, the temporal variations associated with the solar cycle to appear in the tachocline is not clear. In both models, the vector potential of the magnetic field is prescribed with a period of 22 years at the top of the computational domain, so we found that the thickness of the tachocline depends on cycle phase. However the amplitude of the temporal variations can be reduced if the impact of Maxwell stresses is enhanced compared with the viscous stresses – for example the magnetic Prandtl number is less than one (cf. Fig. 10).
As stated earlier, an important shortfall of these models is obviously the extremely simplified treatment of the turbulent transport. If the turbulence arises from the instabilities in the tachocline, then the diffusivities should clearly be some, possibly very complex, functionals of the velocity field and of the magnetic field. The next step to model this would be to use a Smagorinsky-type formula or model for the diffusivities.
Other important points what we should consider in the future are the boundary conditions on the magnetic field and the complete dynamo-generated poloidal field, because the conditions in the present treatment poorly represent the dynamical interaction between the flow and the magnetic field in the tachocline and the convection zone (Petrovay, 2000). Many theoretical models suggest that the toroidal magnetic field is up to G in the tachocline, required to produce sunspots in low latitudes (Petrovay & Moreno-Insertis, 1997). In our model the peak toroidal field is above about G, but this may change if different boundary conditions are used or the dynamo-generated field is included. Dikpati & Gilman (2001); Gilman & Dikpati (2002) suggest that the dynamo-generated toroidal field should play an important role in the global instability of tachocline differential rotation. In future work we plan to develop our model along the lines described above.
Acknowledgements.
I would like to thank J. O. Stenflo for providing the parameters of the evolutionary pattern of the axisymmetric radial magnetic field, K. Petrovay for helpful discussions on the manuscript and my colleagues (T. Borkovits and V. Könyves) for their help. This work was supported in part by the OTKA under grant no. T043741.References
- Basu (1997) Basu, S. 1997, MNRAS, 288, 572
- Basu & Antia (2001) Basu, S., Antia, H. M. 2001, MNRAS, 324, 498
- Brun et al. (1999) Brun, A. S., Turck-Chièze, S., Zahn, J.-P. 1999, ApJ, 525, 1032
- Brun et al. (2002) Brun, A. S., Antia, H. M., Chitre, S. M., Zahn, J.-P. 2002, A&A, 391, 725
- Charbonneau et al. (1999) Charbonneau, P., Christensen-Dalsgaard, J., Henning, R., et al. 1999, ApJ, 527, 445
- Corbard et al. (1999) Corbard, T., Blanc-F raud, L., Berthomieu, G., et al. 1999, A&A, 344, 696
- Corbard et al. (2001) Corbard, T., Jiménez-Reyes, S. J., Tomczyk, S., et al. 2001, in Helio- and Asteroseismology at the Dawn of the Millennium (ESA Publ. SP-464), p. 265
- Dikpati & Gilman (2001) Dikpati, M, Gilman, P. A. 2001, ApJ, 559, 428
- Elliott & Gough (1999) Elliott J. R., Gough D. O. 1999, ApJ, 516, 475
- Forgács-Dajka & Petrovay (2001) Forgács-Dajka, E., Petrovay, K. 2001, Sol. Phys., 203, 195
- Forgács-Dajka & Petrovay (2002) Forgács-Dajka, E., Petrovay, K. 2002, A&A, 389, 629 (Paper I)
- Garaud (2001) Garaud, P. 2001, MNRAS, 329, 1
- Gilman (2000) Gilman, P. A. 2000, Sol. Phys., 192, 27
- Gilman & Dikpati (2002) Gilman, P. A., Dikpati, M. 2002, ApJ, 576, 1031
- Gough & McIntyre (1998) Gough, D. O., McIntyre, M. E. 1998, Nature, 394, 755
- Howe et al. (2000) Howe, R., Christensen-Dalsgaard, J., Hill, F., et al. 2000, Science, 287, 2456
- Kitchatinov & Rüdiger (1995) Kitchatinov, L. L., Rüdiger, G. & 1995, A&A, 299, 446
- Kosovichev (1996) Kosovichev, A.G. 1996, ApJ, 469, L61
- Küker & Stix (2001) Küker, M., & Stix, M. 2001, A&A, 366, 668
- MacGregor & Charbonneau (1999) MacGregor, K. B., Charbonneau, P. 1999, ApJ, 519, 911
- Makarov & Sivaraman (1989) Makarov, V. I., Sivaraman, K. R. 1989, Sol. Phys., 123, 367
- Miesch et al. (2000) Miesch, M. S., Elliott, J. R., Toomre, J., et al. 2000, ApJ, 532, 593
- Nandy & Choudhuri (2002) Nandy, D., Choudhuri, A. R. 2002, Science, 296, 1671
- Petrovay & Moreno-Insertis (1997) Petrovay, K. and Moreno-Insertis, F. 1997, ApJ, 485, 398
- Petrovay & Szakály (1999) Petrovay, K. and Szakály, G. 1999, Sol. Phys., 185, 1
- Petrovay (2000) Petrovay, K. 2000, in The Solar Cycle and Terrestrial Climate, ESA Publ. SP-463, p. 3; also astro-ph/0010096
- Rüdiger & Kitchatinov (1997) Rüdiger, G., Kitchatinov, L. L. 1997, Astr. Nachr., 318, 273
- Schou et al. (1998) Schou, J., Antia, H. M., Basu, S., et al. 1998, ApJ, 505, 390
- Spiegel & Zahn (1992) Spiegel, E. A., Zahn J.-P. 1992, A&A265, 106
- Stenflo (1988) Stenflo, J. O. 1988, Astrophys.& Space Sci.144, 321
- Stenflo (1994) Stenflo, J. O. 1994, in R. J. Rutten and C. J. Schrijver (eds.), Solar Surface Magnetism, p. 365