-band observations of boxy bulges. I. Morphology and surface brightness profiles
Abstract
In this first paper of a series on the structure of boxy and peanut-shaped (B/PS) bulges, n-band observations of a sample of edge-on spiral galaxies are described and discussed. n-band observations best trace the dominant luminous galactic mass and are minimally affected by dust. Images, unsharp-masked images, as well as major-axis and vertically-summed surface brightness profiles are presented and discussed. Galaxies with a B/PS bulge tend to have a more complex morphology than galaxies with other bulge types, more often showing centered or off-centered X structures, secondary maxima along the major-axis and spiral-like structures. While probably not uniquely related to bars, those features are observed in three-dimensional N-body simulations of barred discs and may trace the main bar orbit families. The surface brightness profiles of galaxies with a B/PS bulge are also more complex, typically containing or more clearly separated regions, including a shallow or flat intermediate region (Freeman Type II profiles). The breaks in the profiles offer evidence for bar-driven transfer of angular momentum and radial redistribution of material. The profiles further suggest a rapid variation of the scaleheight of the disc material, contrary to conventional wisdom but again as expected from the vertical resonances and instabilities present in barred discs. Interestingly, the steep inner region of the surface brightness profiles is often shorter than the isophotally thick part of the galaxies, itself always shorter than the flat intermediate region of the profiles. The steep inner region is also much more prominent along the major-axis than in the vertically-summed profiles. Similarly to other recent work but contrary to the standard ‘bulge + disc’ model (where the bulge is both thick and steep), we thus propose that galaxies with a B/PS bulge are composed of a thin concentrated disc (a disc-like bulge) contained within a partially thick bar (the B/PS bulge), itself contained within a thin outer disc. The inner disc likely formed secularly through bar-driven processes and is responsible for the steep inner region of the surface brightness profiles, traditionally associated with a classic bulge, while the bar is responsible for the flat intermediate region of the surface brightness profiles and the thick complex morphological structures observed. Those components are strongly coupled dynamically and are formed mostly of the same (disc) material, shaped by the weak but relentless action of the bar resonances. Any competing formation scenario for galaxies with a B/PS bulge, which represent at least per cent of the local disc galaxy population, must explain equally well and self-consistently the above morphological and photometric properties, the complex gas and stellar kinematics observed, and the correlations between them.
keywords:
galaxies: bulges – galaxies: evolution – galaxies: formation – galaxies: photometry – galaxies: spiral – galaxies: structure1 INTRODUCTION
Since the work of Davies et al. (1983), bulges have largely been considered as low-luminosity elliptical galaxies, suggesting a rapid formation dominated either by mergers and accretion of external material (e.g. Kauffmann 1996; Kauffmann, Charlot & White 1996; but see also Bekki & Chiba 2001; Aguerri, Balcells & Peletier 2001) or possibly by dissipative gravitational collapse (e.g. Eggen, Lynden-Bell & Sandage 1962; Carlberg 1984a, b; Steinmetz & Müller 1995; but see also Noguchi 1998, 1999). Over the last decade, however, there has been much criticism of this idea. In particular, the realization that most bulges have an inner surface brightness profile shallower than the expected law (e.g. Andredakis, Peletier & Balcells, 1995; de Jong, 1996; MacArthur, Courteau & Holtzman, 2003; Balcells et al., 2003) argues against both mechanisms (e.g. Hjorth & Madsen, 1995; Aguerri et al., 2001). Alternative models where bulges grow secularly (i.e. over a long timescale and in relative isolation) have also been developed and studied, many of them bar-driven (e.g. Pfenniger & Norman, 1990; Friedli & Benz, 1993, 1995; Norman, Sellwood & Hasan, 1996), and much observational data support them (e.g. Wozniak et al., 1995; Erwin & Sparke, 2002).
Of primary concern here, several pieces of evidence point to the identification of most boxy and peanut-shaped (B/PS) bulges in edge-on spiral galaxies with the bars of barred spirals. In -body simulations, whenever a disc galaxy forms a bar, a B/PS bar/bulge develops soon after. This process was studied first by Combes & Sanders (1981), later on by Combes et al. (1990) and Raha et al. (1991), and more recently by Mihos et al. (1995), Athanassoula & Misiriotis (2002), Athanassoula (2002, 2003, 2005) and Martinez-Valpuesta, Shlosman & Heller (2005).
The observed incidence of B/PS bulges is consistent with that expected if they are associated with relatively strong bars. Recent work by Lütticke, Dettmar & Pohlen (2000a, b) demonstrates that per cent of all bulges are B/PS, while amongst those the exact shape of the bulge depends mainly on the viewing angle to the bar. As shown by the numerical simulations, true peanuts are bars seen side-on, i.e. with the major-axis of the bar roughly perpendicular to the line-of-sight. For less favourable viewing angles, the bulge/bar looks boxy, and if the bar is seen end-on it looks almost spherical. Stronger bars also lead to more prominent peanut shapes, as demonstrated observationally (e.g. Lütticke et al., 2000b) and theoretically (e.g. Athanassoula & Misiriotis, 2002; Bureau & Athanassoula, 2005).
The kinematics of discs harboring a B/PS bulge, as measured from both ionized-gas emission lines and stellar absorption lines, show the behaviour expected of barred spirals viewed edge-on. This has been demonstrated by the observations of Kuijken & Merrifield (1995), Merrifiel & Kuijken (1999), Bureau & Freeman (1997, 1999) and Chung & Bureau (2004), and by the modeling of Athanassoula & Bureau (1999) and Bureau & Athanassoula (1999, 2005). Similar tests are now also available for face-on bars (Debattista et al., 2005).
There is thus ample evidence that edge-on galaxies with a B/PS bulge are simply barred disc galaxies, and that the B/PS bulges themselves represent the thickest parts of the bars (see Athanassoula 2005 for a review of all arguments). Yet there has been little convincing evidence for this from surface photometry alone, the best work being that of Lütticke et al. (2000a, b). Early studies of non-spheroidal bulges used mostly optical images (e.g. Jarvis, 1987; Shaw & Gilmore, 1989; Shaw, 1993) and the interpretation was often hampered by the large amount of extinction. As we will show in this paper, it truly takes the combination of N-body simulations and orbit studies with near-infrared (NIR) images to derive direct and convincing photometric evidence relating B/PS bulges and bars.
Skokos, Patsis & Athanassoula (2002a, b) and Patsis, Skokos & Athanassoula (2002, 2003a) studied the orbital structure of three-dimensional (3D) bars exhaustively (but see also Pfenniger, 1984; Pfenniger & Friedli, 1991). They find families of orbits which can not only provide the backbone of the boxy and peanut shapes, but can also cause local enhancements within the disc itself. Since extinction is far less important in the NIR, -band images are the ideal tool to study the morphology of galaxies with a B/PS bulge, to look for similarities with barred orbital structures.
In this paper, the first of a series, we study a sample of edge-on spiral galaxies, most of them with a B/PS bulge, for which we have obtained high-quality -band images. Much complementary data exist for this sample (e.g. Bureau & Freeman, 1997, 1999; Chung & Bureau, 2004; Bureau & Chung, 2006), but the primary goal here is to study the morphology of the B/PS structures and their host discs, similarly to Lütticke et al. (2000b). As we shall see, we find several features ressembling closely those expected of 3D bars: bulges with X shapes, secondary disc enhancements, inner rings, etc. A second paper discusses scaleheight variations in the same galaxies (Athanassoula, Aronica & Bureau 2006, hereafter Paper II; but see also Aronica et al. 2003, 2004).
2 SAMPLE DESCRIPTION
We study here the sample of Bureau & Freeman (1999) and Chung & Bureau (2004), which was drawn from the catalogs of galaxies with a B/PS bulge of Jarvis (1986), Shaw (1987) and de Souza & dos Anjos (1987), as well as from galaxies with extreme axial ratios (; Karachentsev, Karachentseva & Parnovsky 1993). We include galaxies with extended as well as no or confined ionized-gas emission, even though the latter were not specifically studied by Bureau & Freeman (1999). The sample thus consists of edge-on spirals, all of which are visible from the south () and have a bulge larger than in diameter (to be able to identify bars kinematically in moderate seeing). of the bulges were classified as having a B/PS bulge by Bureau & Freeman (1999) and constitute a ‘control’ sample and have varied morphologies.
Basic galaxy properties are listed in Table 1, along with a classification of the bulges’ shape from Lütticke et al. (2000a). Although still relying on a visual inspection of optical contour plots, Lütticke et al. (2000a) homogeneously classified over edge-on galaxies, including all our objects. Only bulges were classified differently by Bureau & Freeman (1999) and Lütticke et al. (2000a). A complete comparison of the classifications as well as of the ionized-gas and stellar kinematics is provided in Chung & Bureau (2004). Bureau & Chung (2006) discuss in more depth objects where counter-rotating ionized-gas was discovered (see also Chung et al., 2006). As demonstrated by Lütticke et al. (2000a), the classification of the bulges’ shape is robust between the optical and NIR, but NIR images are essential to study their detailed structure, due to the frequent and significant extinction from dust in the equatorial plane (e.g. Lütticke et al., 2000b). All sample galaxies therefore also have (where is the diameter at the mag arcsec-2 isophotal level in ), which allows for the NIR imaging discussed here to be acquired in a reasonable amount of time with a small-field camera.
| Galaxy | R.A.(2000) | Dec.(2000) | Type | Bulge | ||||
| mag | mag | arcmin | km s-1 | |||||
| (1) | (2) | (3) | (4) | (5) | (6) | (7) | (8) | (9) |
| B/PS bulges | ||||||||
| NGC 128 | 00 29 15.1 | +02 51 50 | S0 pec | 1.0 | 12.7 | -21.4 | 2.81 | 4228 |
| ESO 151-G004 | 00 56 07.3 | -53 11 28 | S00 | 1.0 | 14.7 | -20.4 | 1.31 | 7456 |
| NGC 1381 | 03 36 31.7 | -35 17 43 | SA0 | 2.0 | 12.7 | -19.2 | 2.63 | 1776 |
| NGC 1596 | 04 27 37.8 | -55 01 37 | SA0 | 4.0 | 12.0 | -19.3 | 3.89 | 1509 |
| NGC 1886 | 05 21 48.2 | -23 48 36 | Sab | 1.0 | 13.8 | -19.2 | 3.23 | 1737 |
| NGC 2310 | 06 53 53.8 | -40 51 46 | S0 | 2.0 | 12.6 | -18.6 | 4.16 | 1187 |
| ESO 311-G012 | 07 47 34.0 | -41 27 07 | S0/a? | 2.0 | 12.4 | -20.0 | 3.71 | 1130 |
| NGC 2788A | 09 02 40.2 | -68 13 38 | Sb | 1.0 | 13.6 | -21.5 | 2.88 | 4056 |
| IC 2531 | 09 59 55.4 | -29 37 02 | Sb | 1.0 | 12.9 | -21.6 | 6.76 | 2474 |
| NGC 3203 | 10 19 34.4 | -26 41 53 | SA(r)0+? | 3.0 | 13.0 | -19.9 | 2.81 | 2410 |
| NGC 3390 | 10 48 04.4 | -31 32 02 | Sb | 2.0 | 12.8 | -21.5 | 3.46 | 3039 |
| NGC 4469 | 12 29 28.0 | +08 44 59 | SB(s)0/a? | 1.0 | 12.4 | -17.8 | 3.46 | 576 |
| NGC 4710 | 12 49 38.9 | +15 09 57 | SA(r)0+ | 1.5 | 11.9 | -19.8 | 4.89 | 1324 |
| PGC 44931 | 13 01 49.5 | -08 20 10 | Sbc | 1.0 | 14.2 | -21.1 | 2.81 | 3804 |
| ESO 443-G042 | 13 03 29.9 | -29 49 36 | Sb | 1.0 | 13.9 | -20.6 | 2.88 | 2912 |
| NGC 5746 | 14 44 55.9 | +01 57 17 | SAB(rs)b? | 1.0 | 11.4 | -21.8 | 6.91 | 1720 |
| IC 4767 | 18 47 41.6 | -63 24 20 | S pec | 1.0 | 14.3 | -19.5 | 1.51 | 3544 |
| NGC 6722 | 19 03 39.6 | -64 53 41 | Sb | 1.0 | 13.5 | -22.2 | 2.88 | 5749 |
| NGC 6771 | 19 18 39.6 | -60 32 46 | SA(r)0+? | 1.0 | 13.6 | -20.5 | 2.34 | 4221 |
| ESO 185-G053 | 20 03 00.4 | -55 56 53 | SB pec | 2.0 | 14.3 | -20.0 | 1.23 | 4475 |
| IC 4937 | 20 05 17.9 | -56 15 20 | Sb | 1.0 | 14.8 | -18.6 | 1.86 | 2337 |
| ESO 597-G036 | 20 48 15.0 | -19 50 58 | S00 pec | 1.0 | 15.2 | -20.7 | 0.87 | 8694 |
| IC 5096 | 21 18 21.8 | -63 45 42 | Sb | 4.0 | 13.6 | -20.7 | 3.16 | 3142 |
| ESO 240-G011 | 23 37 50.5 | -47 43 37 | Sb | 4.0 | 13.4 | -21.0 | 4.89 | 2842 |
| Control sample | ||||||||
| NGC 1032 | 02 39 23.6 | +01 05 38 | S0/a | 4.0 | 12.7 | -20.7 | 3.46 | 2722 |
| NGC 3957 | 11 54 01.5 | -19 34 09 | SA0+ | 3.0 | 13.0 | -19.0 | 3.09 | 1686 |
| NGC 4703 | 12 49 18.9 | -09 06 30 | Sb | 4.0 | 14.0 | -21.1 | 2.45 | 4458 |
| NGC 5084 | 13 20 16.8 | -21 49 38 | S0 | 4.0 | 11.5 | -20.9 | 10.71 | 1725 |
| NGC 7123 | 21 50 46.4 | -70 19 59 | Sa | 4.0 | 13.6 | -20.3 | 2.51 | 3737 |
| IC 5176 | 22 14 55.3 | -66 50 56 | SAB(s)bc? | 4.0 | 13.4 | -19.6 | 4.36 | 1746 |
Notes: All parameters are from LEDA (Lyon-Meudon Extragalactic Database), except the morphological type (Jarvis, 1986; de Souza & dos Anjos, 1987; Shaw, 1987; Karachentsev et al., 1993) and bulge type (Lütticke et al., 2000a). Bulge types – represent B/PS bulges and bulge type spheroidal bulges. ESO 151-G004’s redshift and corrected absolute magnitude are from Chung & Bureau (2004).
3 OBSERVATIONS AND DATA REDUCTION
The observations were carried out at the 2.3m telescope of Siding Spring Observatory over runs from 1996 January to 1997 March, for a total of nights. Mounted at the Cassegrain focus, the CASPIR111http://www.mso.anu.edu.au/observing/2.3m/CASPIR/ (Cryogenic Array Spectrometer/Imager; McGregor et al. 1994) instrument was used in direct imaging mode with a arcsec pix-1 scale. Its pix2 SBRC InSb CCD ( pixels) then yields a arcsec arcsec field-of-view. All observations were obtained with a narrow -band filter, n, of central wavelength and width . The readout noise with the double sample readout method used (relative sampling) was about e and the dark current e s-1 over most of the array, although there are a number of hot pixels. For s integrations (see below) and typical background brightness conditions (– n mag arcsec-2), our observations are always background limited.
For all observations except biases and standard stars, the integration time for a single frame was s, resulting from the average of twelve s exposures (individual exposures were not saved). The total integrations were built-up using a script taking frames of each field, each dithered by ( pixels; the biggest bad pixel patch) parallel or perpendicular to the galaxy major-axis, and interspersed by sky frames. The lot was bracketed by dark and bias frames and repeated typically times, for a total on-source integration time of min per field, slightly less on sky. For a galaxy requiring mosaicing of fields, for example, the sequence was: bias, dark, sky, field_1 [dith 0], field_2 [dith 0], sky, field_1 [dith 1], field_2 [dith 1], sky, field_1 [dith 2], …This ensures sufficiently fast sampling of the sky and allows to average out bad pixels when the frames are combined. Using the instrument rotator, the CCD rows were always aligned (and centered) on the galaxy major-axis, facilitating mosaicing. Mosaics of to fields (with per cent overlap) were required depending on the galaxy, and all mosaics include plenty of sky area around the target.
The data reduction was mostly carried out within the CASPIR IRAF (Image Reduction and Analysis Facility) package, following as closely as possible the procedures recommended in the CASPIR manual. Dark, sky, and object frames were first bias-subtracted and linearized, and the skies and objects dark-subtracted. Sky and object frames were then flatfielded and the sky subtracted from the objects. All the frames of a given object were then combined together with proper offsets to form the final image. The bias and dark frames used for subtraction were nightly (or fractions of a night if deemed necessary) medians of all such frames. For sky subtraction, running medians of a few sky frames were used, time-centered around the object frame being reduced. A flat was obtained every night from the difference of domes frames taken with an incandescent lamp on and off. For most objects, a mosaic was created for each dither position (e.g. for field_1 [dith 0] and field_2 [dith 0] in the example above) using blind offsets (the offsets given to the telescope), and all such mosaics were then added by registering compact sources (galaxy nucleus and foreground stars). This procedure minimizes registering errors due to a drift of the telescope pointing over time, and is required because a guide star common to all fields of a mosaic could not be obtained for most targets (the overlap of the guider fields being minimal or non-existent). A common background across the different fields of each mosaic was imposed by subtracting the proper constant from each field when necessary (imperfect sky subtraction).
A photometric zero-point on the Carter SAAO system (Carter & Meadows, 1995) was derived nightly by observing IRIS (Infrared Imaging Spectrograph) photometric standards throughout the night. The n-band atmospheric extinction correction coefficient was also calculated each night by following a few standard stars over a range of airmasses (typical value mag airmass-1). The galaxy images were also corrected for Galactic extinction, although this is negligible for most objects. When frames were obtained under less than photometric conditions, their fluxes were first scaled to the level of photometric ones before being combined. The final images generally have a background level slightly different from zero, and this was again corrected by subtracting a constant.
4 IMAGES
4.1 Morphological features
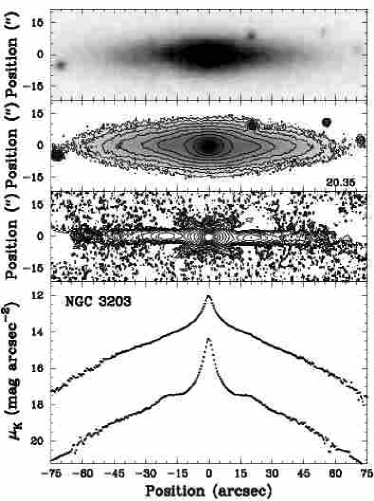
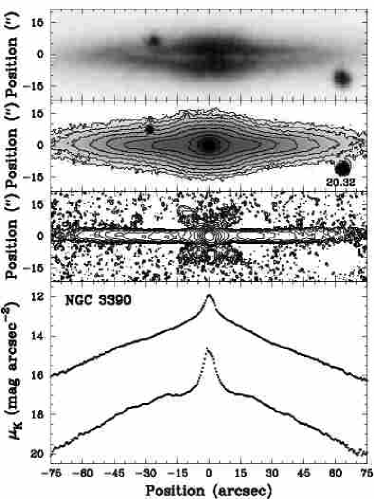
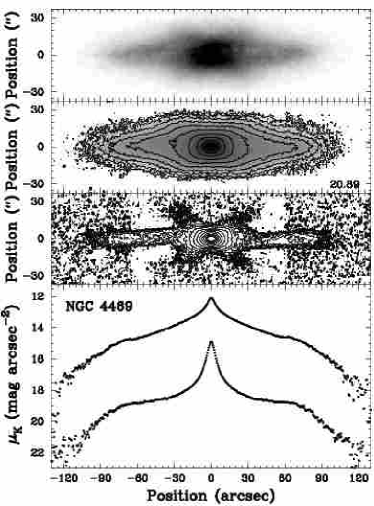
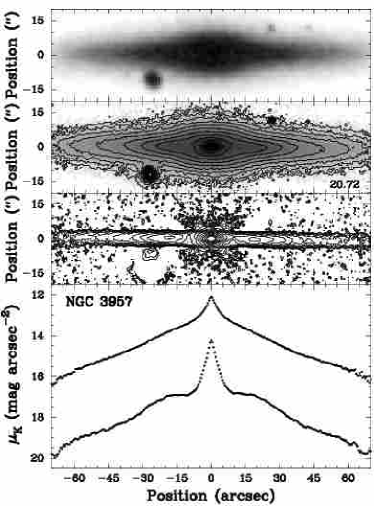
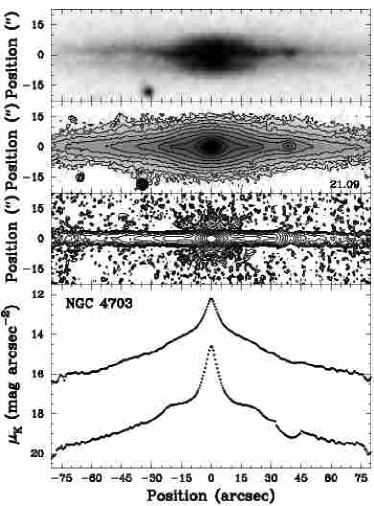
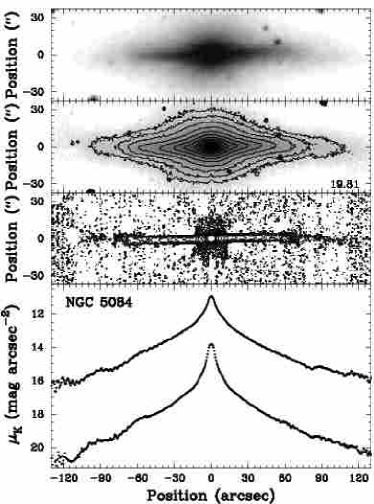
Figures 1 and 2 show, respectively, our data for galaxies with a B/PS bulge and for those of the control sample. Each panel contains, from top to bottom, first a Digitized Sky Survey (DSS) image of the galaxy (for comparison), second our n-band image and third an unsharp-masked n-band image (see below), all spatially registered. The surface brightness profiles which follow will be discussed in the next section (§ 5). As our main interest here is the galaxy bulges, we only show the inner parts of our mosaics, which generally extend up to and beyond the large-scale discs.
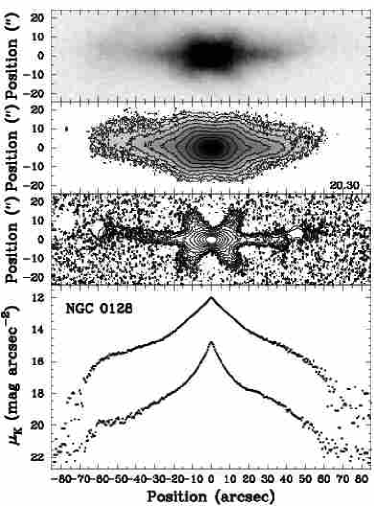
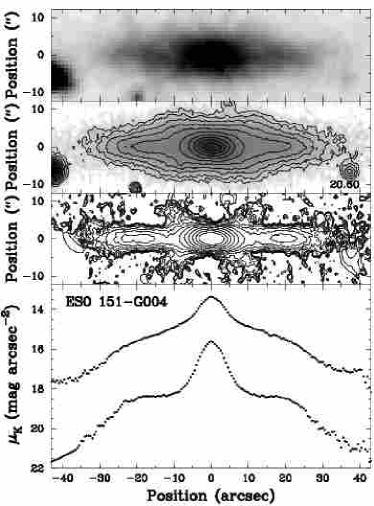
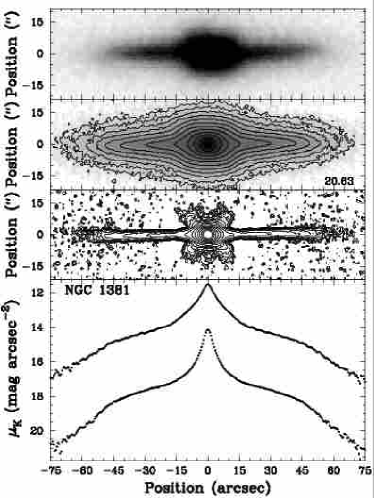
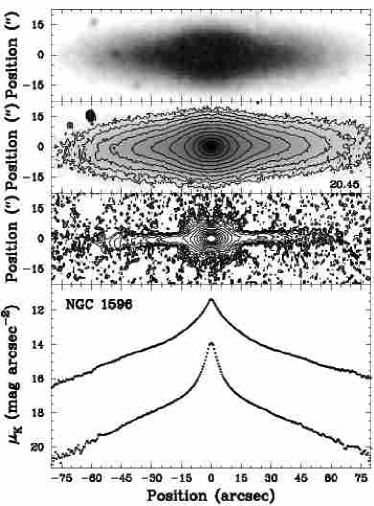
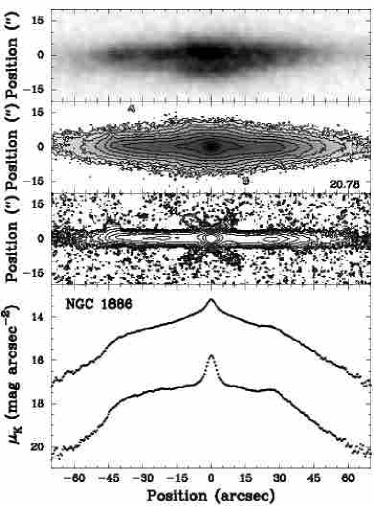
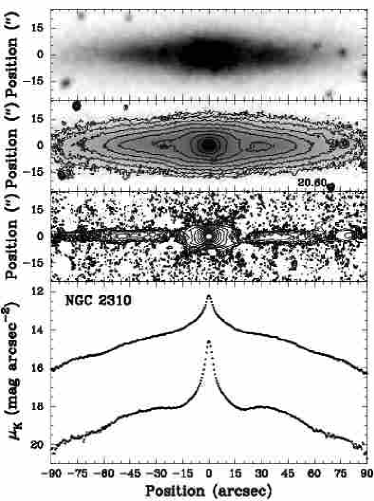
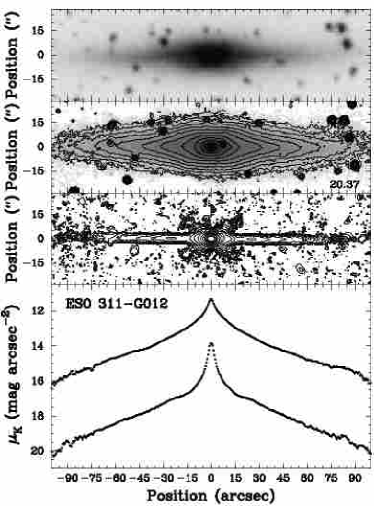
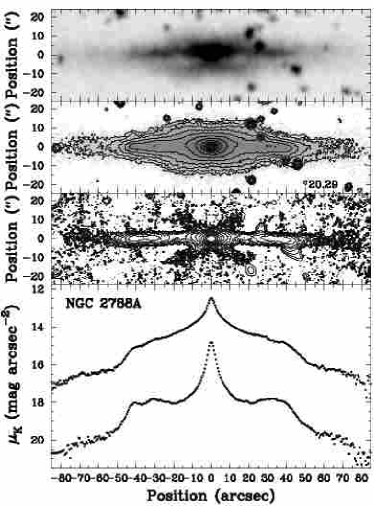
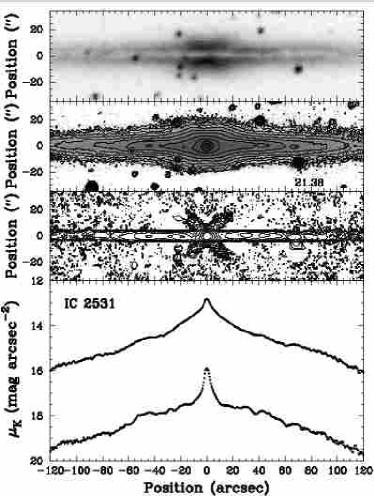
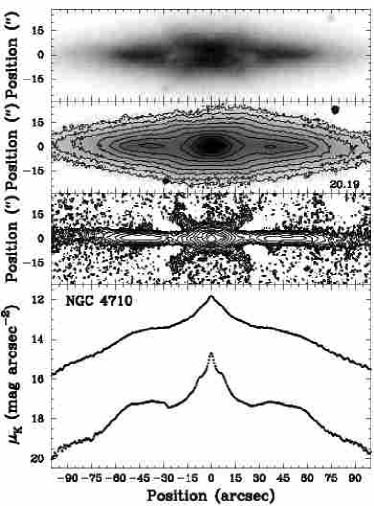
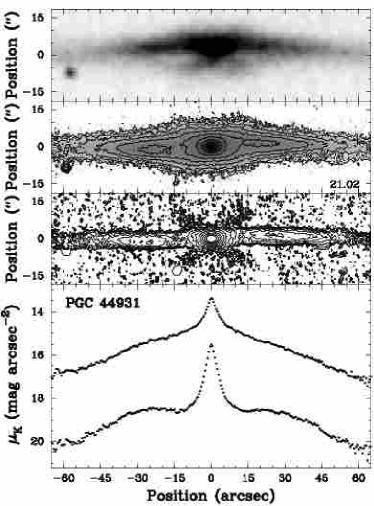
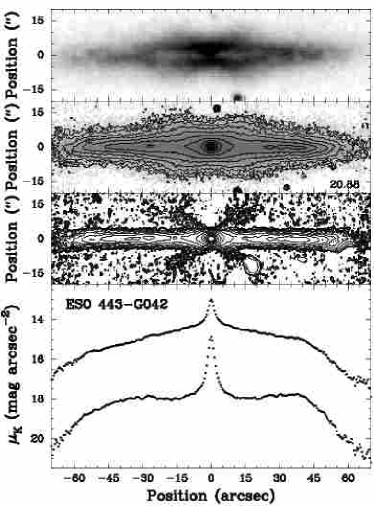
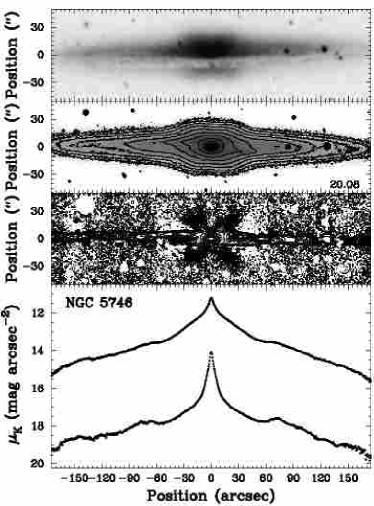
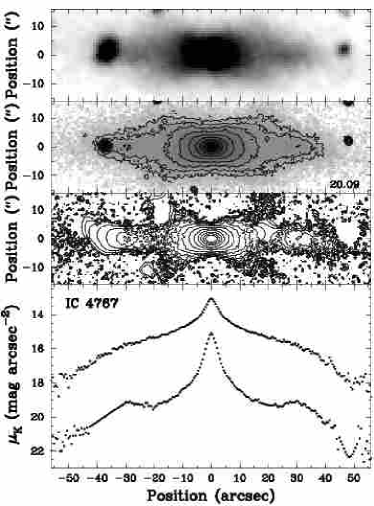
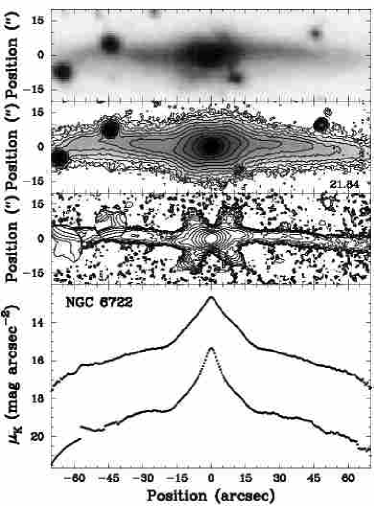
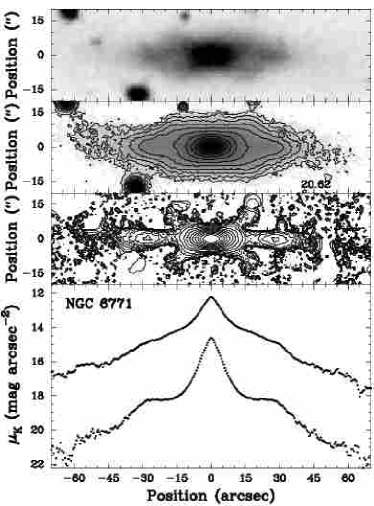
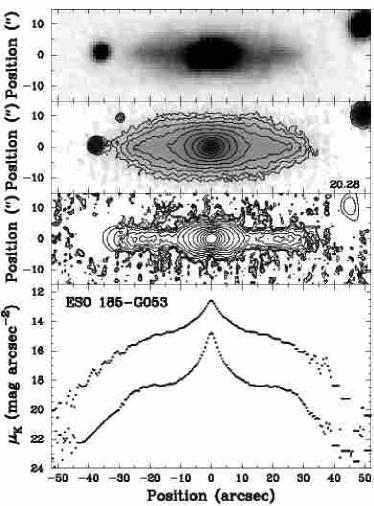
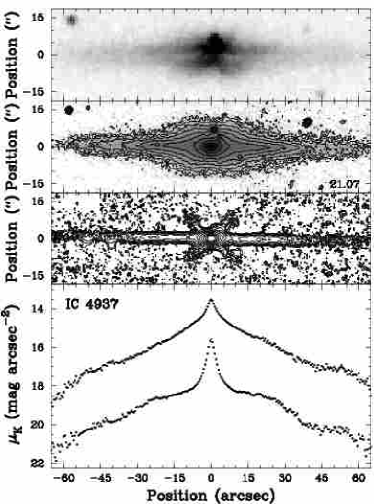
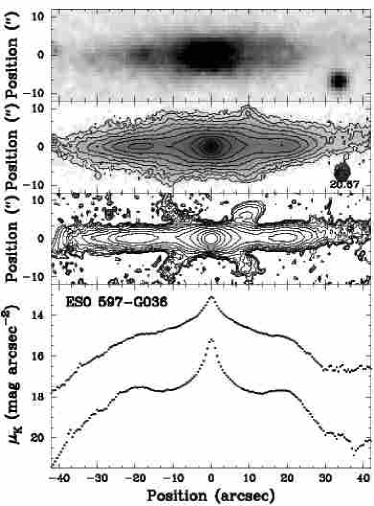
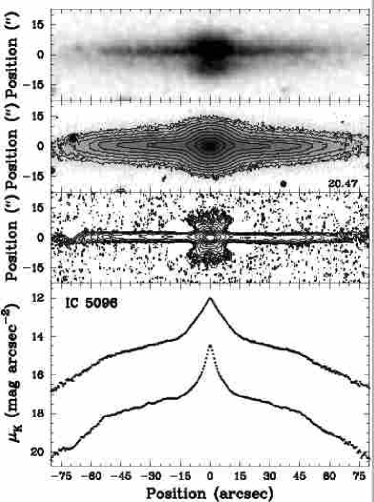
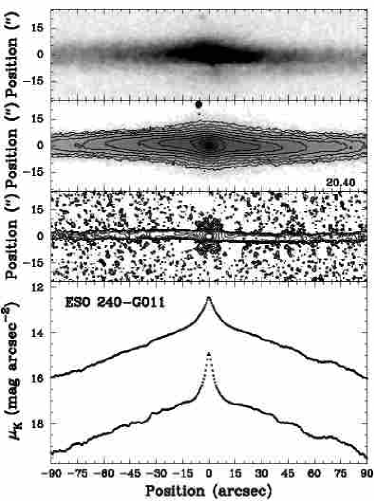
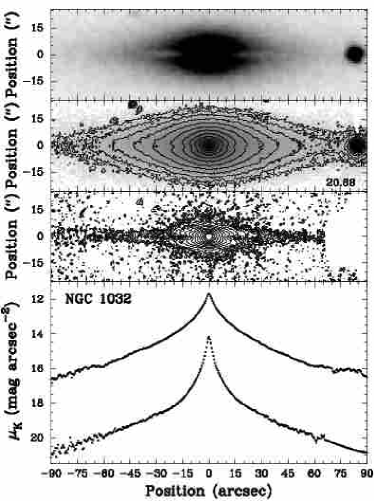
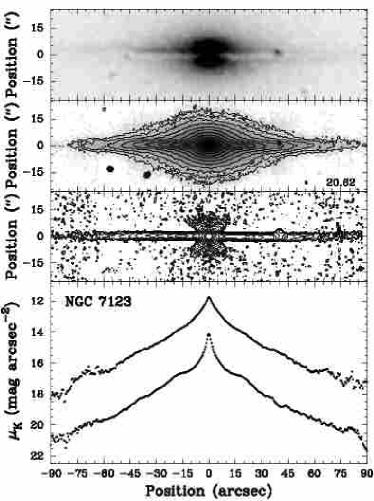
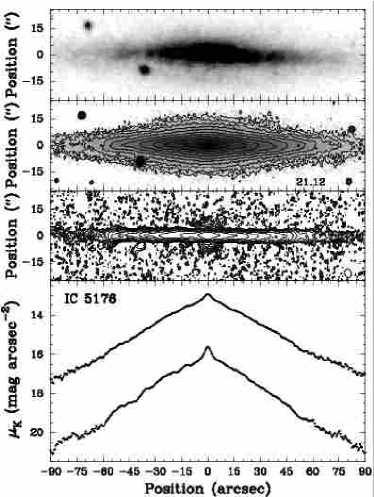
Comparing the DSS and n-band images, the advantages of working in the NIR become obvious. Most importantly, dust extinction within the galaxies, when present, is drastically reduced (see, e.g., IC 2531 and NGC 7123), although it remains non-negligible in a few objects (e.g. NGC 1032). Generally, the B/PS and associated features are also sharper at n-band, although this is hard to quantify. For a similar reason, unsharp-masking, which enhances local extrema, is ideal to highlight readily apparent morphological features and reveal weaker ones.
The unsharp-masked images of Figures 1–2 were obtained by median-filtering the n-band images, that is by replacing the value of each pixel by the difference between it and that of the median within a centered circular aperture. The size of the aperture was held fixed across each image, but it was varied from galaxy to galaxy to best highlight the features of interest here: X shapes, secondary disc enhancements, … Bigger apertures yield unsharp-masked images more similar to the original n-band image, while smaller apertures enhance smaller scale features such as central discs, spiral arms and remaining dust lanes. The apertures used in Figures 1–2 are thus tightly correlated to the characteristic size of the morphological features enhanced. We also note that the unsharp-masked images were obtained from n-band images with the foreground stars interpolated over. This process is not perfect, however, and can create artefacts in the unsharp-masked images, especially near the equatorial plane of the galaxies where the luminosity gradients are steep. One must thus be careful when interpreting the results (see, e.g., NGC 2788A and NGC 6722).
As the same morphological features are present in many galaxies, we provide a generic description of those features below and list the specific features observed in each object in columns – of Table 2. We note however that, for some objects, some features are best seen in images unsharp-masked on a spatial scale different from that shown in Figures 1–2. To create Table 2, we thus analysed images unsharp-masked with circular apertures of radii ranging from arcsec ( pixels) to arcsec ( pixels).
Off-centered X (OX). Many galaxies show an X shape structure in the bulge region, usually most easily visible in the unsharp-masked n-band image. In many cases, however, if one follows the branches of the X, the ridges do not cross in the centre of the galaxy but rather fall short of it. This leads to a ‘’ feature rather than a true ‘’, which we dub an off-centered X (OX). Excellent examples are NGC 128 and NGC 6771, but there are many.
Centered X (CX). In a comparable number of cases, the branches of the X do cross in the center of the galaxy, and we dub this feature a centered X (CX). Although the transition between off-centered and centered X is somewhat ill-defined, good examples of centered X features include NGC 1381 and IC 2531.
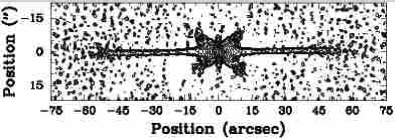
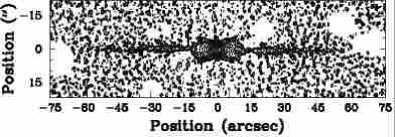
Minor-axis extremum (ME). Many galaxies show a rather narrow and elongated local maximum along the minor-axis, which we dub minor-axis extremum (ME). They are generally only visible in n-band images unsharp-masked on a smaller scale than that presented in Figures 1–2, so we show the cases of NGC 1381 and NGC 3203 in Figure 3 for illustrative purposes.
Secondary maxima (SM). Many galaxies display local maxima away from the center along the major-axis, which we dub secondary maxima (SM). While sometimes readily visible in the original n-band image (e.g. NGC 4710 and ESO 597-G036), most are easily seen only in the unsharp-masked images (e.g. ESO 151-G004 and NGC 3203).
Spiral arms (SA). A number of galaxies display narrow and elongated local maxima which are not aligned with either axes but rather are typically slightly offset from the major-axis, and sometimes even partially wind around the bulge forming a pseudo-ring. Those features are generally bisymmetric and are again most easily visible in the unsharp-masked n-band images. We dub them spiral arms (SA) for obvious reasons. Good examples include NGC 4469 and NGC 5746 (but see also the much weaker example of NGC 3203 in Fig. 3).
In Table 2, we finally give an indication of the inclination of the galaxies, labeling them either inclined (I), when the galaxy is obviously more than a few degrees from exactly edge-on, quasi edge-on (Q), when the galaxy is apparently away from edge-on by at most a few degrees, and exactly edge-on (E), when there is no indication at all that the galaxy is not exactly edge-on. There is obviously a continuum of inclinations, but the first class generally includes galaxies where spirals arms are easily visible (e.g. NGC 4469 and NGC 5746), while the second includes mostly galaxies with weak spirals arms or a slightly off-centered (in the vertical direction) dust lane (e.g. NGC 3203 and NGC 2788A). This classification will be especially important in Paper II, dealing with the vertical surface brightness profiles, since disc projection effects can not be neglected for discs significantly away from edge-on.
| Galaxy | Images | Profiles | Notes | ||||||
| OX | CX | ME | SM | SA | I | MA | SU | ||
| (1) | (2) | (3) | (4) | (5) | (6) | (7) | (8) | (9) | (10) |
| B/PS bulges | |||||||||
| NGC 128 | OX | ME | SM | E | 3 | 3 | Warped disc ( mode?) | ||
| ESO 151-G004 | OX | SM | SA | Q | 3F | 3 | |||
| NGC 1381 | CX | ME | E | 3 | 3 | Upwardly curved CX ()? | |||
| NGC 1596 | OX? | ME | E | 2 | 2 | ||||
| NGC 1886 | CX | ME | SM | Q | 3F | 3 | |||
| NGC 2310 | CX | SM | SA | I | 3F | 2 | Inner ring with outer spiral arms | ||
| ESO 311-G012 | OX | ME | SM | E | 3 | 2 | |||
| NGC 2788A | CX | ME? | SM | Q | 4F | 4 | |||
| IC 2531 | CX | SM | E | 3F | 2 | ||||
| NGC 3203 | OX | ME | SM | SA | Q | 3F | 2 | ||
| NGC 3390 | CX | SM | SA | Q | 3F | 2 | |||
| NGC 4469 | OX | ME? | SM | SA | I | 3F | 3 | ||
| NGC 4710 | OX | SM | SA? | Q | 4F | 3F | Inner surface brightness plateau? | ||
| PGC 44931 | CX | ME? | SM | SA | I | 3F | 2 | Inner ring with outer spiral arms? | |
| ESO 443-G042 | OX | SM | Q | 3F | 3 | ||||
| NGC 5746 | CX | SM | SA | I | 3F | 3 | Inner ring with outer spiral arms | ||
| IC 4767 | OX | SM | Q | 3F | 3 | ||||
| NGC 6722 | OX | ME? | SM | SA | I | 3F | 2 | Inner ring with outer spiral arms, warped disc? | |
| NGC 6771 | OX | ME | SM | Q | 3F | 3 | |||
| ESO 185-G053 | CX? | SM | E | 3F | 3 | ‘( )’-shaped structure | |||
| IC 4937 | OX | SM | SA? | Q | 3F | 2 | |||
| ESO 597-G036 | OX | ME? | SM | E | 3F | 3 | |||
| IC 5096 | CX | ME | SM | Q | 3 | 3 | |||
| ESO 240-G011 | CX? | ME? | SA | I | 3 | 2 | Inner ring with outer spiral arms | ||
| Control sample | |||||||||
| NGC 1032 | ME | E | 2 | 2 | |||||
| NGC 3957 | CX | ME | SM | Q | 3F | 2 | |||
| NGC 4703 | ME | SM | Q | 4F | 3 | ||||
| NGC 5084 | ME | SA? | Q | 2 | 2 | ||||
| NGC 7123 | CX | ME | E | 3 | 2 | ||||
| IC 5176 | ME | SA? | E | 2 | 2 | ||||
Notes: For the images, the features listed were identified on images unsharp-masked on scales ranging from to arcsec. OX: off-centered X feature, CX: centered X feature, ME: minor-axis extremum, SM: secondary maxima along major-axis, SA: spiral arms, I: inclination. For the inclination, the galaxies are classified as edge-on (E), quasi-edge-on (Q), or inclined (I). For the surface brightness profiles, we list the number of clearly distinct regions. MA: major-axis profile, SU: vertically-summed profile. The letter ‘F’ denotes a flat intermediate region.
4.2 Incidence of morphological features
The most striking result from Figures 1–2 is that the morphology of the galaxies with a B/PS bulge is much more complex than that of the control sample galaxies, in the sense that galaxies with a B/PS bulge contain more of the morphological features described in § 4.1 (and best-revealed by unsharp-masking; see Table 2). Indeed, at least per cent of galaxies with a B/PS bulge possess an off-centered X feature and at least per cent a centered one, while only per cent of the control galaxies have either. Similarly, per cent of the galaxies with a B/PS bulge have secondary maxima along the major-axis, while only per cent of the control galaxies do. For the presence of spiral arms, the ratios become, respectively, at least per cent and perhaps nil. Only for the minor-axis extrema are those percentages inverted, with at most per cent of galaxies with a B/PS bulge possessing one but all control galaxies. Those statistics thus suggest that both centered and off-centered X features, secondary major-axis maxima and spiral arms are preferentially associated with B/PS bulges, while only minor-axis extrema are found preferentially in other bulge types. In fact, the contrast between the main and control samples would be even greater if, as we will argue in § 6.5, the control sample was not contaminated by weak B/PS bulges (NGC 3957 and NGC 4703).
We also note that, given the large number of secondary maxima observed at -band (in fact, more than in the optical images), it is unlikely that they are due to the presence of obscuring dust filaments inclined with respect to the equatorial plane, as was suggested by various authors (e.g. Sandage, 1961; Whitmore & Bell, 1988).
4.3 Origin of morphological features and the orbital structure of bars
Although the accretion of external material can give rise to X-shaped features (e.g. Binney & Petrou, 1985; Hernquist & Quinn, 1988, 1989; Whitmore & Bell, 1988), those are generally centered and it is unlikely that any long-lasting off-centered X could be produced. Since we observe a majority of off-centered X in our sample, and since there is no obvious discontinuity between the two, it is more attractive to look for a unique mechanism which can simultaneously explain both centered and off-centered stable X features.
Athanassoula (2005) unsharp-masked a high-quality -body simulation of a barred disc. The results provide an essentially perfect match to the secondary maxima discussed above and, depending on the viewing angle to the bar, to the off-centered and centered X features, suggesting a link between those features and edge-on bars. We discuss below the possible origin of this link through the orbital structure of barred discs and then discuss some caveats.
The most important orbit families in 3D bar models are those of the tree, all elongated parallel to the bar and located within corotation. They include the family itself (restricted to the equatorial plane) and many other families bifurcating from the at vertical resonances of increasing energies. Sellwood & Wilkinson (1993) provide a general introduction, but we adopt here the notation of Skokos et al. (2002a, b) and call them , , , etc. The morphological features identified in § 4.1 can then be reproduced by superposing orbits of the appropriate shapes, as done by Patsis et al. (2002). Patsis & Xilouris (2006) recently explored very similar ideas, with identical conclusions.
The centered and off-centered X features, in particular, can both arise out of families extending out of the equatorial plane in the vertical direction. The family (also called banana orbits; e.g. Pfenniger & Friedli 1991), bifurcating from the family at the 2:1 vertical resonance, has the largest vertical extent and is shaped like a smile or a frown. As shown by the orbit superpositions of Patsis et al. (2002), orbits seen side-on have a morphology entirely consistent with an off-centered X. Depending on the model (i.e. mass distribution and pattern speed) and viewing angle, centered X features can also be created.
The and orbit families (bifurcating from the family at the 3:1 vertical resonance and shaped like a ‘’) and the orbit family (bifurcating at the 4:1 resonance and shaped like a ‘w’) can also give rise to centered or off-centered X features, depending on the model and viewing angle (see, again, Patsis et al., 2002). This is also the case for the family, which does not bifurcate from the orbits but is morphologically similar to the family, although it was present in only one model.
The orbit superpositions of Patsis et al. (2002) further show that the orbit families described above (as well as higher order families such as , and ) can give rise to a number of maxima along the major-axis, similar to the secondary maxima identified in § 4.1. Those maxima generally occur at larger radii than the X features and near (but within) the ends of the bar, often where orbits have loops. An alternative and more straightforward explanation is that the secondary maxima observed are simply the edge-on projections of inner rings (edge brightening), known to exist in a large fraction of barred spiral galaxies and located at the end of the bar (e.g. Kormendy, 1979; Buta, 1995). Inner rings naturally form in gas-rich discs under the influence of rotating bars (e.g. Schwarz, 1981, 1984; Byrd et al., 1994), but they also develop in purely dissipationless simulations (e.g. Athanassoula & Misiriotis, 2002; Bureau & Athanassoula, 2005). Either way, both mechanisms support a relationship to bars, and both mechanisms may coexist. Accretion scenarios producing centered X features, on the other hand, will generally not produce secondary maxima along the major-axis (even less so systematically located outside of the X feature itsef), making them even less attractive.
The orbit superpositions of Patsis et al. (2002) show that the barred orbit families considered above can also give rise to the minor-axis extrema described in § 4.1, especially when seen end-on. The orbits are particularly interesting in this respect but were little studied by Skokos et al. (2002a, b) and deserve more attention. This is encouraging, but the fact that all control sample galaxies also show a minor-axis extremum suggests that this feature is not related to B/PS bulges (and thus presumably to bars). We do not properly understand the origin of this feature.
As we mentioned in § 4.1, because of the morphological similarities, we interpret the local maxima elongated parallel to but slightly offset from the major-axis of the galaxies as spiral arms. If this association is true, which we have no reason to doubt, then obviously spiral arms can only be detected in galaxies that are not perfectly edge-on. In fact, we have used the presence of spirals to quantify the inclination of the galaxies in Table 2. Since we have no other independent and reliable way to estimate the inclination of the galaxies precisely (as we do not know the intrinsic thickness of the discs), we can not guarantee that the inclination distribution is similar between the sample of galaxies with a B/PS bulge and the control sample. Thus, a reliable comparison of the incidence of spiral arms between the two samples is not possible, and we do not discuss this feature at length.
Suffice it to say that the apparently slightly higher incidence of spiral arms in galaxies with a B/PS bulge is consistent with the suggestion that B/PS bulges are simply thick bars viewed edge-on. Indeed, bars are very good at driving (grand design) spiral patterns (e.g. Athanassoula, 1980; Thielheim & Wolff, 1984; Elmegreen & Elmegreen, 1989) and spiral arms are preferentially found in barred galaxies (e.g. Elmegreen & Elmegreen, 1989; Buta et al., 2005). Furthermore, for the few galaxies where a (partial) inner ring with outer spiral arms is visible (e.g. NGC 5746), the ring is systematically located just at the end of the flat intermediate region of the major-axis surface brightness profiles (see § 5; all such galaxies have an intermediate region, and it is flat in all cases but one). If, as we argue in § 5, the end of the intermediate surface brightness profile region also marks the end of the bar, then this trend is entirely consistent with observations of more face-on barred spiral galaxies (e.g. Kormendy, 1979; Buta, 1995) and the expectations from theory (e.g. Schwarz, 1981, 1984; Byrd et al., 1994).
On a different note, we must point out that while the (barred) picture proposed above is attractive and supported by much independent evidence (see § 1), it may not be unique. Indeed, as simple tests show, surface brightness distributions created from nested rectangular isophotes can also give rise to centered and off-centered X-shapes when unsharp-masked, independently of their origin. As axisymmetric boxy distributions can in principle also exist (e.g. Binney & Petrou, 1985; May, van Albada & Norman, 1985; Rowley, 1988), it is possible that bars are not uniquely related to the complex features observed. However, as the N-body simulations and orbit properties discussed above show, barred models are consistent with the unsharp-masked features in much details, while this remains to be shown for other models.
5 SURFACE BRIGHTNESS PROFILES
5.1 Profile features
In addition to the DSS, n-band and unsharp-masked n-band images, the panels of Figures 1–2 also contain two surface brightness profiles. The fainter ones represent the major-axis surface brightness profiles, extracted using a constant position angle, an approximation that is valid in the inner parts of all galaxies and in the outer parts of all but a few (e.g. NGC 128, NGC 6722, NGC 6771 and ESO 597-G036). The brighter surface brightness profiles were obtained by summing the data in the vertical direction, as if the galaxies were infinitely thin, again assuming a constant position angle for the major-axis. In both cases, the n-band images with the foreground sources interpolated over were used, and the vertical profiles were summed until the noise level of the image was reached. While the noise level varies slightly from object to object, such a limit is sufficient for our purposes.
While our summed surface brightness profiles are not strictly equivalent to azimuthally-averaged surface brightness profiles in more face-on galaxies, or to cuts at a given position angle (i.e. they are also integrated along the line-of-sight through the edge-on discs), a comparison is nevertheless possible and useful. Indeed, because the luminosity of discs generally decreases rapidly with radius, the light at any given position in our profiles is still dominated by that near the same (cylindrical) radius. Our profiles can also be compared to those in Lütticke et al. (2000b), who showed profiles (cuts) parallel to but offset from the major-axis for a number of edge-on spiral galaxies.
In columns and , Table 2 lists the number of distinct regions present in the surface brightness profiles of each galaxy, each region being typically separated by a clear radial break (although one must be cautious with badly interpolated foreground sources). From the surface brightness profiles of face-on galaxies, we would generally expect each profile to show only two distinct regions if the galaxy is axisymmetric. A first region at small radii, generally associated with the bulge, where the profile is steep (generally steeper than an exponential profile), and a second region at larger radii, generally associated with the disc, where the profile is exponential222We remind the reader that the surface brightness profile of an edge-on exponential disc is not exactly linear in a (logarithmic) surface brightness vs. projected radius plot, but slightly curved (see, e.g., Pohlen et al., 2000).. However, such two-region profiles are rare in our data, especially along the major-axis (but see NGC 1596 and NGC 1032). Most profiles show an additional region at intermediate radii, where the profile is shallower than the outer disc, even often flat or slightly rising with radius (denoted by the letter ‘F’ in Table 2; e.g. ESO 151-G004 and NGC 2310). Such three-region surface brightness profiles are often referred to as Freeman Type II profiles in the literature (Freeman, 1970). A few galaxies also show two distinct intermediate regions, one shallow following the steep central component and one steep preceding the outer exponential disc, for a total of four regions (e.g. NGC 2788A and NGC4710). We do not discuss (or count) here apparent radial breaks in the outer discs, since they are presumably only weakly related to the bulge structure. Figure 4 shows a cartoon version of the various types of profiles identified in Table 2.

5.2 Incidence of profile features
Again, the most obvious and basic result from Figures 1–2 is that the surface brightness profiles of the galaxies with a B/PS bulge are much more complex than those of the control sample galaxies, especially along the major-axis, in the sense that the surface brightness profiles of galaxies with a B/PS bulge typically contain a larger number of distinct regions separated by clear radial breaks (see Table 2). Indeed, along the major-axis, per cent of the galaxies with a B/PS bulge have a surface brightness profile with or more regions (Freeman Type II profile), per cent of which have a flat intermediate region, while the corresponding fractions for the control sample are, respectively, only and per cent. The statistics are not as sharply contrasted when the profiles summed along the vertical axis are considered, but the differences remain significant. For example, per cent of the galaxies with a B/PS bulge have a summed surface brightness profile with a least regions, while only per cent of the control galaxies do. Those fractions are in rough agreement with those of Lütticke et al. (2000b), who carried out a similar analysis. As for the morphological features, it thus appears that complex surface brightness profiles are preferentially associated with B/PS bulges. And again, the contrast between the main and control samples would be sharper if the control sample had been better selected (i.e. if NGC 3957 and NGC 4703 has been excluded; see § 6.5).
5.3 Origin of profile features and relationship to bars
The fact that practically all galaxies with a B/PS bulge have a major-axis surface brightness profile with an intermediate, often flat region is particularly important, as it is inconsistent with an axisymmetric bulge and exponential disc model, no matter how steep the bulge profile is (i.e. no matter what the Sersic index of the bulge is). There is thus apparently a third photometric or morphological ‘component’ dominating at intermediate radii. We argue below, however, that in such Freeman Type II profiles, both the steep inner region and the flat intermediate region are ultimately caused by a single bar viewed edge-on, without the necessity of a classic bulge.
Bureau & Athanassoula (2005) followed the temporal evolution of the major-axis surface brightness profile in a large number of barred -body simulations viewed edge-on. They showed that bar formation and evolution within an (initially) exponential disc is associated with the buildup and continued growth of a dense central region, resulting in a central peak (which would normally be identified with a bulge) and with the formation and gradual flattening of an intermediate region, in addition to the outer exponential disc (see also Athanassoula & Misiriotis 2002; Athanassoula 2003). The central peak extends to – original disc scalelengths while the intermediate region extends to the end of the bar, well beyond the central peak and the thickest part of the bar. The existence of three surface brightness profile regions is thus totally normal (and expected) in barred galaxies, but it remains unexplained in classic bulge models, unless there is an additional bar. In fact, four-region surface brightness profiles are also often produced in barred models (e.g. Fig. 3 in Bureau & Athanassoula 2005).
As expected from the elongated boxy/peanut shape of the bar, the ratio of the length of the thickest part of the bar (or that of the central peak) to that of the flat intermediate region increases in -body simulations as the viewing angle increases (from end-on to side-on). This trend is also present in our data, where the ratio of the length of the thickest part of the bulges (or that of the central peak) to that of the intermediate region is generally larger in peanut-shaped bulges than in boxy ones (compare, e.g., NGC 5746 and NGC 6722 to NGC 1381 and IC 5096). There is however much variety, as many strong peanut-shaped bulges have a small ratio (see, e.g., NGC 1886 and ESO 443-G042), and likely many causes for it. First, as far as the surface brightness profile and bar shape are concerned, there is a certain degeneracy between bar strength and viewing angle (a strong bar seen at intermediate viewing angle may appear similar to a weaker bar seen exactly side-on; e.g. Bureau & Athanassoula 2005). Second, the ratio described evolves in -body simulations, generally decreasing with time as the bar strengthens and lengthens but the central component changes little (see, again, Bureau & Athanassoula, 2005). Third, gas inflow and subsequent star formation (absent from the pure -body models) may substantially modify the light distribution in the central regions (e.g. Heller & Shlosman, 1994; Friedli & Benz, 1995). Fourth, the presence (or absence) of rings and lenses will complicate the comparison. We also note that as the profiles of Bureau & Athanassoula (2005) were integrated vertically over original disc scalelengths, they are somewhat intermediate between our major-axis and summed profiles.
In fact, the variety observed in the ratios of the length of the thickest part of the bulge (or that of the central peak) to that of the intermediate region may well be dominated by the range of bar strengths present in the sample, rather than by the range of viewing angles. This is also suggested by the data of Lütticke et al. (2000b), and it would similarly imply that the observed boxy-peanut ‘sequence’ is not mainly one of viewing angle, but is instead driven by a varying (i.e. increasing) bar strength. The small ratios observed in strong peanut-shaped bulges such as NGC 1886 and ESO 443-G042 can then be explained only if the central surface brightness peak and the thick part of the bulges are shorter in stronger bars (in a relative sense). This is natural if the inner part of the surface brightness profiles is dominated by a disc-like bulge, as will be argued in § 6.4. Indeed, Athanassoula (1992a, b) showed that the size of (bar-driven) nuclear gas discs is limited by the outer inner Lindblad resonance (i.e. by the outermost orbit, elongated perpendicular to the bar), which itself inversely depends on the bar strength. Then, the stronger the bar, the smaller the nuclear disc.
6 DISCUSSION
6.1 Radial redistribution of material
Athanassoula (2002, 2003) argued that much of the bar-driven evolution in discs is due to a transfer of angular momentum from the inner (barred) disc to the outer disc (beyond corotation) and the dark halo, leading to a strengthening, lengthening and slowing down of the bar with time. To isolate the effects of angular momentum exchange, which leads to a radial redistribution of matter, we must preferentially consider the vertically-summed surface brightnes profiles of Figures 1 and 2. While fewer galaxies with a B/PS bulge exhibit or more regions in the summed profile than along the major-axis, a majority still do, while only one of the control sample galaxies does (see Table 2).
In scenarios where the formation and evolution of discs is dominated either by collapse or the gradual accretion of discrete components (e.g. cannibalized dwarf or satellite galaxies), there is no obvious mechanism to create the radial breaks in the disc density distribution observed in our sample galaxies, even less to explain the spatial correlation of those breaks with the ionized-gas and stellar kinematics (see Bureau & Freeman, 1999; Chung & Bureau, 2004). Similarly, the traditional interpretation of Freeman Type II profiles as inwardly truncated discs neither proposes an origin for the truncation nor explains why the truncation is only partial and the surface brightness profiles systematically have the specific shape observed. In bar-driven evolution scenarios, however, a break naturally occurs at the end of the bar (e.g. Athanassoula & Misiriotis, 2002; Athanassoula, 2002, 2003; Bureau & Athanassoula, 2005). If this is indeed the case here, then the break in a surface brightness profiles at the end of the intermediate region should systematically mark the bar’s end.
Our major-axis surface brightness profiles match those of Athanassoula & Misiriotis (2002) and Bureau & Athanassoula (2005), and as we mentioned already the kinematics of the sample galaxies agree very well with barred galaxy models (see Bureau & Freeman, 1999; Athanassoula & Bureau, 1999; Chung & Bureau, 2004; Bureau & Athanassoula, 2005). A quick comparison further shows that the position where the rotation curve flattens, generally associated with the end of the bar (e.g. Bureau & Athanassoula, 2005), always occurs very near (although generally slightly within) the break in the n-band surface brightness profile. Thus, our surface brightness profiles are consistent with those expected from bar-driven evolution scenarios, and the complex surface brightness profiles observed appear to be a direct consequence of the transfer of angular momentum and the radial (and vertical) rearrangement of material by the bar.
Most barred galaxies appear to have fast bars, whereby corotation, defined as the radius where the stars and bar pattern rotate at the same speed (and marking the transition between material loosing and gaining angular momentum), is located just beyond the end of the bar (see, e.g., Gerssen, Kuijken & Merrifield, 2003; Aguerri, Debattista & Corsini, 2003). Since the pattern speeds of the bars in our sample are unknown, a direct test of this is impossible. However, for the few galaxies with an apparent inner ring (see Table 2), the ring radius is systematically (roughly) equal to that of the break at the end of the intermediate surface brightness region. Given that inner rings are generally thought to occur near the inner 4:1 (ultra-harmonic) and corotation resonances (e.g. Schwarz, 1981, 1984; Athanassoula et al., 1982; Buta, 1995; Patsis, Skokos & Athanassoula, 2003b), our galaxies are consistent with harbouring fast bars.
It is also interesting to note that the two latest galaxies in our sample, ESO 240-G011 and IC 5176 (with very small bulges and thus presumably very weak bars, if any) both have completely featureless (single) exponential outer discs. They thus offer useful benchmarks against which more complex systems can be compared.
6.2 Vertical redistribution of material
To isolate the effects of the vertical redistribution of material within bars, as predicted by models where the bar buckles and thickens (e.g. Combes & Sanders, 1981; Combes et al., 1990; Raha et al., 1991), we compare here the major-axis and vertically-summed surface brightness profiles of our sample galaxies.
A cursory examination of our major-axis and summed surface brightness profiles shows that, for most galaxies with a B/PS bulge, they differ markedly from one another. As already pointed out, the vertically-summed profiles generally show fewer of the features described in § 5 and they approach more closely a simple bulge plus exponential disc description, while the major-axis profiles generally show a steeper inner peak and a flatter intermediate region (the outer regions have a comparable slope in both profiles). Excellent examples of this are ESO151-G 004 and PGC 44931, but there are many.
If the scaleheight of the stars in a galaxy is constant with radius, one expects the major-axis and vertically-summed profiles to have the same functional form but different zero-points, i.e. be offset but parallel to one another (although not exactly, since the profiles are vertically-summed to a given surface brightness level rather than to a fixed number of scaleheights). This is not the case for most galaxies, however, even when the major-axis surface brightness profile is flat (when summing to a given surface brightness level is equivalent to summing to a fixed number of scaleheights), suggesting that the stellar scaleheights are not constant. See, again, ESO 151-G004 and PGC 44931, although any galaxy with a flat intermediate profile will do.
By discussing a single scaleheight, even in regions where the inner peak of the surface brightness profiles is non-negligible, we have however implicitely amalgamated the bulge and disc (no matter how the former is defined). In the classic bulge and disc model, where the bulge and disc represent structurally and kinematically distinct compoments, this will necessarily lead to a variation of the scaleheight, although one would naively expect this variation to be monotonic. The major-axis and vertically-summed surface brightness profiles of Figure 1, however, show that the variations are not monotonic. Furthermore, the functional difference between the two profiles is systematically greatest in the flat intermediate region, which would never be associated with a bulge (even in classic models) and is clearly dominated by disc material. Our major-axis and vertically-summed surface brightness profiles thus show that the radial scaleheight variations are real and that they occur in the discs (i.e. they are not due to bulge material), in direct contradiction to the long accepted wisdom that disc scaleheights are radially constant (see, e.g., van der Kruit & Searle, 1981a, b, 1982a, 1982b; Shaw & Gilmore, 1990; de Grijs & van der Kruit, 1996). In fact, our results support a picture where the bulge and disc are not intrinsically distinct (either structurally or kinematically), but both instead emerge from the rapid radial variation of the scaleheight of the disc material (due to bar-related vertical resonances). This will be discussed in more depth in Paper II, where it will also be shown that the variations are as expected from barred -body models. Viewed simplistically, our observations argue for the reassignment of (most of) the bulge material to the disc (a B/PS bulge), but this is an important conceptual change.
To our knowledge, a variable stellar scaleheight has only been identified and discussed in a few galaxies. In the outer parts of NGC 3115, Capaccioli et al. (1988) assign the variation to the end of the disc self-gravity, while in the inner parts of the Milky Way Kent, Dame & Fazio (1991) assign it to a variable ratio of young to old stars (their data in fact already show strong hints of the peanut shape of the Galactic bulge and a Freeman Type II profile). de Grijs & Peletier (1997) do note an increase of the scaleheight with (projected) radius in a large number of edge-on spiral galaxies, but they assign the increase to the presence of a thick disc with scalelength and scaleheight larger than those of the dominant (thin) disc component. Upon closer inspection, a number of other studies arguing for a constant scaleheight as a function of (projected) radius actually do detect variations, but those are generally monotonic and are argued to be consistent with the influence of a structurally distinct bulge (in the center) or a thickening of the outer disc (near the edge of the optical disc). The scaleheight variations are thus rejected as artefacts unrelated to the dominant disc, presumed thin (e.g. de Grijs & van der Kruit, 1996). While this is defendable in some cases, it is doubtful in others, and the non-monotonic variations observed here and in Paper II in the inner and intermediate regions of our sample galaxies can not be explained away in such manners. Possible variations in the outer parts of our galaxies (e.g. flaring) are not of direct interest to the bulges’ structure.
6.3 Classic versus ‘pseudo’-bulges
As discussed also in Athanassoula (2005), galaxy bulges have traditionally been defined either as 1) the steep central component of the surface brightness profile (generally steeper and brighter than the inward extrapolation of the outer exponential disc; e.g. Carollo, Ferguson & Wyse 1999), 2) the thick galactic component (in isophotal terms, clearly sticking out of the equatorial plane in nearly edge-on objects) or 3) the kinematically hot component (the central peak in the velocity dispersion profile). Those three definitions have been used interchangeably and have generally been considered equivalent and consistent. But is this really the case?
Many diverse results show those views to be grossly oversimplified (see, e.g., Wyse, Gilmore & Franx 1997 for an early review). For example, there is now much evidence that some bulges are really concentrated (thin) discs, or equivalently that the central parts of discs can have a density profile steeper than that of the outer disc (see, e.g., Kormendy 1993 and Kormendy & Kennicutt 2004 for reviews). The central surface brightness profiles of most bulges also rarely approach the classic law (e.g. Andredakis et al., 1995; Balcells et al., 2003). Although our own surface brightness profiles are not ideal to tackle this last issue, because of the line-of-sight integration through the outer disc, many objects are nearly exponential in the center and we specifically study the minor-axis profiles in Paper II. Most importantly, our sample is ideal to test the equivalence of thick structures with steep light profiles and high velocity dispersions.
The images and surface brightness profiles of Figure 1 reveal that, in some galaxies, the thick central structure (defined isophotally) extends past the steep inner region of the surface brightness profile (both along the major-axis and vertically summed). Those two definitions of a bulge are thus neither equivalent nor consistent, at least in those cases. Our observations thus show that the steep inner region of the surface brightness profile is often contained within the thick central component. This was already hinted at by the poorer optical profiles of Chung & Bureau (2004), although Lütticke et al. (2000b) found them to be generally equal. Examples include ESO 151-G004, NGC 2788A and ESO 443-G042, but there are many. In fact, our observations suggest that those two bulge definitions only seem to agree systematically in galaxies with a boxy-shaped (or round) bulge, such as NGC 1381 and IC 5096, while the disagreement is worst in some of the the strongest peanut-shape bulges. There is no straightforward explanation for this in classic bulge formation scenarios, but it is a natural consequence of bar-buckling/thickening mechanisms, where it is related to the bar viewing angle (seen respectively end-on and side-on).
Having argued that the steep inner region of the surface brightness profiles is generally contained within the thick part of the galaxies, it is also true that the intermediate and often flat region of the surface brightness profiles always extends beyond the thick component. Some of the best examples are found in the galaxies listed above, but again there are many (see, e.g., NGC 1886 and NGC 4469). This behaviour is hard to reconcile with classic bulge formation scenarios, but it arises naturally in bar-buckling/thickening ones. Indeed, while the (projected) surface brightness profile at intermediate radii remains shallow or flat within most of the barred region of a galaxy (i.e. over the entire deprojected bar length, no matter what the viewing angle is), only part of the bar is thick. So, while the fact that most thick components are shorter than the flat intermediate region of the surface brightness profile is simply a consequence that most bars are not seen exactly side-on, the fact that all thick components are shorter than the flat intermediate region reflects a fact much less widely appreciated, i.e. that only a fraction of the bar is actually thick. This point has not been stressed in the literature, but it is nicely illustrated and discussed in some depth in Athanassoula (2005). It is explained by the orbital structure of barred discs (e.g. Skokos et al., 2002a, b; Patsis et al., 2002) and is in fact visible in most published -body models (e.g. Combes et al., 1990; Athanassoula & Misiriotis, 2002; Athanassoula, 2005).
6.4 Three-dimensional structure of B/PS bulges
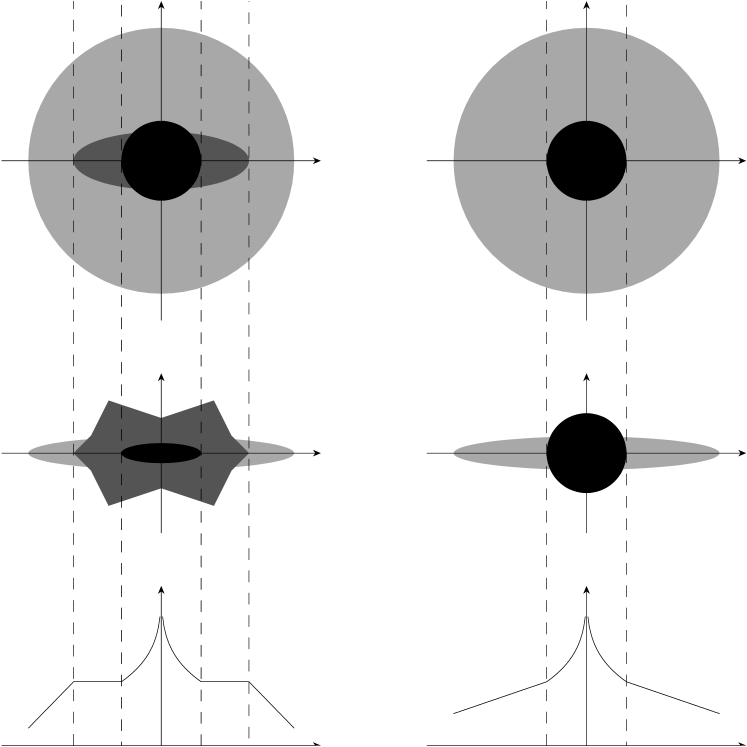
A comparison of the major-axis and vertically-summed surface brightness profiles reveals another interesting fact, i.e. that the steep inner region of the surface brightness profiles is systematically more pronounced and dominant in the major-axis profiles than in the summed ones (see also Lütticke et al., 2000b). This is a key indication of the 3D structure of galaxies with a B/PS bulge. It shows that most of the material found at high belongs to the flat intermediate region of the surface brightness profiles rather than to the inner steep component, and that the latter has a smaller characteristic height than the former (this will be shown more transparently in Paper II). Thus, the steep inner region of the surface brightness profiles truly appears to be a thin concentrated disc, while the shallow intermediate region appears to be thick (and, according to the aforementioned arguments, barred). Figure 5 presents a cartoon version of this model, contrasted to the classic one.
Athanassoula (2005) recently proposed a new nomenclature to differentiate different types of bulges based on their formation mechanism. In addition to classic bulges, which presumably form rapidly through either collapse or merging, she identifies B/PS bulges, which are simply (part of) thick bars, and disc-like bulges, formed by (bar-driven) gaseous inflow and subsequent star formation. As more than one type of bulge can coexist in a single object, the latter two types are well suited to a description of the observations presented here.
As noted above, Kormendy (1993) and Kormendy & Kennicutt (2004) review much of the evidence for the interpretation of some bulges as concentrated discs, which they include in a broader category of ‘pseudo’-bulges, generally formed secularly (i.e. slowly). This vision of disc-like bulges does not explicitely include the extended bulges discussed in this paper, nor the many bulges which are isophotally thick and kinematically hot. The thick bar model advocated in Athanassoula (2005) and here addressess all three points simultaneously. In this respect, we know that the radial component of the velocity dispersion of the Milky Way bulge is similar to that of its inner disc ( km s-1; e.g. Spaenhauer, Jones & Whitford 1992; Lewis & Freeman 1989), and that the velocity dispersion of the galactic bar/bulge is nearly isotropic. So although little is known about either, a difference between the vertical velocity dispersion of the inner disc and that of the bar/bulge must underlie their large structural differences. While it is unlikely that concentrated discs are hot vertically, (thick) bars appear to be (e.g. Gadotti & de Souza, 2005; Debattista et al., 2005).
One could argue that our model comprises a number of distinct building blocks, like the classic models, but those blocks are very different and tightly intertwined dynamically. First, the large-scale bar leads to the formation of a concentrated disc, as in Kormendy’s (1993) picture, but this disc is thin, largely decoupled from the large-scale bar, and only addresses the first of the bulge definitions (steep surface brightness profile). Second, the large-scale bar itself is thick over most but not all its length, and it addresses the second definition of bulges (isophotally thick structure). As for the third definition of bulges (kinematically hot), it is unclear which of the inner disc or large-scale bar dominates the large velocity dispersions observed by Chung & Bureau (2004) in the equatorial plane, but the models suggest that the culprit is slightly elongated (Bureau & Athanassoula, 2005). As mentioned above, face-on bars do appear to have large vertical velocity dispersions (e.g. Gadotti & de Souza, 2005).
The 3D structure proposed for B/PS bulges in Athanassoula (2005) and here is thus diametrically opposed to the classic one. Instead of a thick and steep inner (classic bulge) component within a thin exponential disc, we propose a thin and steep inner disc component (a disc-like bulge) within a thick and shallow bar (a B/PS bulge), followed by an outer exponential disc (see Fig. 5). Furthermore, while the two components of classic bulges are generally thought to have formed separately through vastly different mechanisms and to interact little with each other, the three ‘components’ of galaxies with B/PS bulges are largely made of the same material, which has evolved and been shaped by the single dominant influence of the bar, through the weak but relentless action of both radial and vertical resonances. We do not appear to need additional classic bulges to explain our observations, although it is difficult to rule them out completely at the very center of our galaxies (i.e. on a scale much smaller than the isophotally thick part).
We note that while this may seem to imply that no stellar population gradient should exist in barred galaxies, this is not true. The radial resonances, once established, will clearly affect the behaviour of the gaseous (dissipative) material, which in turns feeds star formation. It is thus expected that a certain segregration of the stellar populations (mainly due to influence of the radial resonances) will develop over time. While pure -body models do not capture this richness, others models including gas dynamics and star formation do (e.g. Friedli, Benz & Kennicutt 1994; Heller & Shlosman 1994; Friedli & Benz 1995; but see also Nakasato & Nomoto 2003). However, the current simplicity of those models and the ignorance of much of the physics involved (primarily regarding star formation) prevent a detailed comparison with current obsvervations, which are in any case limited (but see Martin & Roy, 1994; Zaritsky, Kennicutt & Huchra, 1994; Fisher, Franx & Illingworth, 1996). There is no doubt, however, that the next step for bar-driven bulge formation models is to include realistic star formation and stellar population information (chemodynamics; see, e.g., Samland, Hensler & Theis 1997; Spurzem et al. 2004; Michel-Dansac & Wozniak 2004).
The fact that the maximal radial extent of the inner disc appears to be systematically equal to or slightly smaller than the radius where the bar is thickest (see Fig. 1) may reflect some form of ‘self-regulating’ dynamics, i.e. that the inner disc is limited by a radial resonance (perhaps the radial inner Lindblad resonance, ILR) coinciding with a vertical resonance (perhaps the vertical ILR), as advocated e.g. by Combes et al. (1990). This should be explored further.
6.5 Control sample
Due to its limited size compared to the number of galaxies with a B/PS bulge in our sample, the control sample was always meant more for qualitative checks than for statistically robust comparisons. However, it is now clear that some galaxies do not belong in it. For example, Lütticke et al. (2000a) classified the bulge of NGC 3957 as close to boxy-shaped, Bureau & Freeman (1999) and Chung & Bureau (2004) both found kinematic indications of weak bars in NGC 3957 and NGC 4703, and Chung & Bureau (2004) also found indication of non-axisymmetric motions in NGC 7123. The current -band imaging also shows centered X features in NGC 3957 and NGC 7123 and secondary maxima in NGC 3957 and NGC 4703. All three galaxies show at least regions in their surface brightness profile. The contrast between the B/PS bulge and control samples would thus be greater if NGC 3957 and NGC 4703 (and perhaps NGC 7123) were appropriately classified as B/PS.
Even if bars are peanut-shaped, a fraction of round bulges should still be expected to be bars, as the latter appear round when seen end-on. This fraction is however expected to be small, since already for an angle of – between the bar major-axis and the line-of-sight a boxy shape is observed (e.g. Combes et al., 1990; Lütticke et al., 2000b; Athanassoula, 2005). The large contamination of our control sample thus probably arises from the way it was selected. Indeed, no catalog of edge-on galaxies with a round bulge existed when it was constructed, so the control sample galaxies were selected from apparently misclassified objects in catalogs of galaxies with a B/PS bulge (Jarvis, 1986; de Souza & dos Anjos, 1987; Shaw, 1987) and from the Flat Galaxy Catalog of Karachentsev et al. (1993). Carrying a study along the lines of the current one and those of Bureau & Freeman (1999) and Chung & Bureau (2004), but for an enlarged and properly selected sample of round bulges (for example using the more recent catalog of Lütticke et al., 2000a), would thus be valuable. While this represents a significant amount of work, showing with more certainty that round bulges behave differently from B/PS bulges would greatly strengthen our conclusions.
7 SUMMARY AND CONCLUSIONS
We have presented n-band imaging observations of a sample of edge-on spiral galaxies, most of which harbour a boxy or peanut-shaped (B/PS) bulge. Those data are minimally affected by dust and best trace population II stars, where most of the luminous mass resides. Our multi-faceted analysis suggests that B/PS bulges are simply the thick part of bars viewed edge-on (see Figures 1 and 2).
Galaxies with a B/PS bulge tend to have a more complex morphology than galaxies with other bulge types, more often showing centered or off-centered X structures, secondary maxima along the major-axis, and spiral-like structures. Best revealed by unsharp-masking, those features are also observed in three-dimensional N-body simulations of barred discs (Athanassoula, 2005), and can be explained by the orbital structure of bars (see, e.g., Patsis et al., 2002), although they need not be uniquely related to them. Only minor-axis extrema may be preferentially related to other bulge types. Whether taken along the major-axis or summed vertically (to simulate a flat galaxy), the surface brightness profiles of galaxies with a B/PS bulge are also more complex, more often showing or more clearly separated regions, including a rather shallow or flat intermediate region (see Figure 4). Such Freeman Type II profiles are expected from barred galaxies (e.g. Bureau & Athanassoula, 2005), but they do not have a natural self-consistent explanation in classic bulge formation scenarios.
The radial breaks observed in the vertically-summed profiles of our objects provide further evidence of the transfer of angular momentum and radial redistribution of disc material mediated by the (presumed) bars (see, e.g., Athanassoula, 2002, 2003). Furthermore, the spatial correlations of the radial breaks with the ionized-gas and stellar kinematics (Bureau & Freeman, 1999; Chung & Bureau, 2004) are as expected for fast bars, currently favoured by observations. The differences between the major-axis and vertically-summed profiles provide evidence for abrupt variations of the scaleheight of the disc material. This is, again, as expected from the diverse orbital families and vertical resonances and instabilities present in barred discs, but contrary to conventional wisdom. A quantitative and robust analysis of those scaleheight variations and a comparison with -body simulations will appear in future papers of this series.
Three other facts stand out. First, the steep inner region of the surface brightness profiles is systematically equal to or shorter than the isophotally thick part of the galaxies. Second, the isophotally thick part is itself systematically contained within the flat intermediate region of the surface brightness profiles. Third, the steep inner region of the surface brightness profiles is much more prominent along the major-axis than in the vertically-summed profiles.
We are thus led to radically alter the classic ‘bulge + disc’ model, composed of a thick and steep spheroidal bulge largely decoupled from a thin (possibly barred) exponential disc. Analogously to Athanassoula (2005), we propose here that galaxies with a B/PS bulge are composed of a thin concentrated disc (a disc-like bulge), formed secularly by the bar and responsible for the steep inner region of the surface brightness profiles, contained within a (partially) thick bar (the B/PS bulge), responsible for the flat intermediate region of the surface brightness profiles and the complex morphological structures, itself contained within a thin outer exponential disc (see Figure 5). Those components are closely intertwined dynamically and are largely made of the same (disc) material, shaped over long timescales by the bar.
The challenge to any competing formation scenario for galaxies with a B/PS bulge, which represent at least per cent of the local galaxy population (Lütticke et al., 2000a), is thus to simultaneously and self-consistently explain, equally well or better, their numerous morphological, photometric, and kinematic properties, as well as the correlations between them.
Acknowledgments
The authors would like to thank P. Patsis and J. Kormendy for useful discussions, and M. Pohlen and D. Vergani for technical help. MB acknowledges support from NASA through Hubble Fellowship grant HST-HF-01136.01 awarded by Space Telescope Science Institute, which is operated by the Association of Universities for Research in Astronomy, Inc., for NASA, under contract NAS 5-26555, during much of this work. MB also acknowledges the hospitality of the Université de Montréal and Nagoya University while preparing the manuscript. This project took shape partly through discussions during a Guillermo Haro workshop. The participation of EA and AB to this workshop was facilitated by an ECOS/ANUIEF exchange grant. We thank the staff of Mount Stromlo and Siding Spring Observatories for their assistance during and after the observations. This project made use of the LEDA database: http://leda.univ-lyon1.fr/. The NASA/IPAC Extragalactic Database (NED) is operated by the Jet Propulsion Laboratory, California Institute of Technology, under contract with NASA. The Digitized Sky Surveys were produced at the Space Telescope Science Institute under U.S. Government grant NAG W-2166. The images of these surveys are based on photographic data obtained using the Oschin Schmidt Telescope on Palomar Mountain and the UK Schmidt Telescope. The plates were processed into the present compressed digital form with the permission of these institutions.
References
- Aguerri et al. (2001) Aguerri J. A. L., Balcells M., Peletier R. F., 2001, A&A, 367, 428
- Aguerri et al. (2003) Aguerri J. A. L., Debattista V. P., Corsini E. M., 2003, MNRAS, 338, 465
- Andredakis et al. (1995) Andredakis Y. C., Peletier R. F., Balcells M., 1995, MNRAS, 275, 874
- Aronica et al. (2003) Aronica G., Athanassoula E., Bureau M., Bosma A., Dettmar R.-J., Vergani D., Pohlen M., 2003, Ap&SS, 284, 753
- Aronica et al. (2004) Aronica G., Bureau M., Athanassoula E., Dettmar R.-J., 2004, in R.-J. Dettmar, U. Klein, P. Salucci, eds, Baryons in Dark Matter Halos. SISSA, Trieste, p. 61
- Athanassoula (1992a) Athanassoula E., 1992a, MNRAS, 259, 328
- Athanassoula (1992b) Athanassoula E., 1992b, MNRAS, 259, 345
- Athanassoula (1980) Athanassoula E., 1980, A&A, 88, 184
- Athanassoula (2002) Athanassoula E., 2002, ApJ, 569, L83
- Athanassoula (2003) Athanassoula E., 2003, MNRAS, 341, 1179
- Athanassoula (2005) Athanassoula E., 2005, MNRAS, 358, 1477
- Athanassoula et al. (1982) Athanassoula E., Bosma A., Crézé M., Schwarz M. P., 1982, A&A, 107, 101
- Paper II (2006) Athanassoula E., Aronica G., Bureau M., 2006, MNRAS, submitted (Paper II)
- Athanassoula & Bureau (1999) Athanassoula E., Bureau M., 1999, ApJ, 522, 699
- Athanassoula & Misiriotis (2002) Athanassoula E., Misiriotis A., 2002, MNRAS, 330, 35
- Balcells et al. (2003) Balcells M., Graham A. W., Domínguez-Palmero L., Peletier R. F., 2003, ApJ, 582, L79
- Bekki & Chiba (2001) Bekki K., Chiba M., 2001, ApJ, 558, 666
- Binney & Petrou (1985) Binney J., Petrou M., 1985, MNRAS, 214 449
- Bureau & Athanassoula (1999) Bureau M., Athanassoula E., 1999, ApJ, 522, 686
- Bureau & Athanassoula (2005) Bureau M., Athanassoula E., 2005, ApJ, 626, 159
- Bureau & Chung (2006) Bureau M., Chung A., 2006, MNRAS, 366, 182
- Bureau & Freeman (1997) Bureau M., Freeman K. C., 1997, PASA, 14, 146
- Bureau & Freeman (1999) Bureau M., Freeman K. C., 1999, AJ, 118, 2158
- Buta (1995) Buta R., 1995, ApJS, 96, 39
- Buta et al. (2005) Buta R., Vasylyev S., Salo H., Laurikainen E., 2005, AJ, 130, 506
- Byrd et al. (1994) Byrd G., Rautiainen P., Salo H., Buta R., Crocher D. A., 1994, AJ, 108, 476
- Capaccioli et al. (1988) Capaccioli M, Vietri M., Held E. V., 1988, MNRAS, 234,v335
- Carlberg (1984a) Carlberg R. G., 1984a, ApJ, 286, 403
- Carlberg (1984b) Carlberg R. G., 1984b, ApJ, 286, 416
- Carollo et al. (1999) Carollo C. M., Ferguson H. C., Wyse R. F. G., 1999, The Formation of Galactic Bulges. CUP, Cambridge
- Carter & Meadows (1995) Carter B. S., Meadows V. S., 1995, MNRAS, 276, 734
- Chung & Bureau (2004) Chung A., Bureau M., 2004, AJ, 127, 3192
- Chung et al. (2006) Chung A., Koribalski B., Bureau M., van Gorkom J. H., 2006, MNRAS, submitted
- Combes et al. (1990) Combes F., Debbasch F., Friedli D., Pfenniger D., 1990, A&A, 233, 82
- Combes & Sanders (1981) Combes F., Sanders R. H., 1981, A&A, 96, 164
- Davies et al. (1983) Davies R. L., Efstathiou G., Fall S., Illingworth G., Schechter, P. L., 1983, ApJ, 266, 41
- Debattista et al. (2005) Debattista V. P., Carollo C. M., Mayer L., Moore B., 2005, ApJ, 628, 678
- de Grijs & Peletier (1997) de Grijs R., Peletier R. F., 1997, A&A, 320, L21
- de Grijs & van der Kruit (1996) de Grijs R., van der Kruit P. C., 1996, A&AS, 117, 19
- de Jong (1996) de Jong R. S., 1996, A&AS, 118, 557
- de Souza & dos Anjos (1987) de Souza R. E., dos Anjos S., 1987, A&AS, 70, 465
- Eggen et al. (1962) Eggen O., Lynden-Bell D., Sandage A., 1962, ApJ, 136, 748
- Elmegreen & Elmegreen (1989) Elmegreen B. G., Elmegreen D. M., 1989, ApJ, 342, 677
- Erwin & Sparke (2002) Erwin P., Sparke L. S., 2002, AJ, 124, 65
- Fisher et al. (1996) Fisher D., Franx M., Illingworth G., 1996, ApJ, 459, 110
- Freeman (1970) Freeman K. C., 1970, ApJ, 160, 811
- Friedli & Benz (1993) Friedli D., Benz W., 1993, A&A, 268, 65
- Friedli & Benz (1995) Friedli D., Benz W., 1995, A&A, 301, 649
- Friedli et al. (1994) Friedli D., Benz W., Kennicutt R., 1994, ApJ, 430, L105
- Gadotti & de Souza (2005) Gadotti D. A., de Souza R. E., 2005, ApJ, 629, 797
- Gerssen et al. (2003) Gerssen J., Kuijken K., Merrifield M. R., 2003, MNRAS, 345, 261
- Heller & Shlosman (1994) Heller C. H., Shlosman I., 1994, ApJ, 424, 84
- Hernquist & Quinn (1988) Hernquist L., Quinn P. J., 1988, ApJ, 331, 682
- Hernquist & Quinn (1989) Hernquist L., Quinn P. J., 1989, ApJ, 342, 1
- Hjorth & Madsen (1995) Hjorth J., Madsen J., 1995, ApJ, 445, 55
- Jarvis (1986) Jarvis B. J., 1986, AJ, 91, 65
- Jarvis (1987) Jarvis B., 1987, AJ, 94, 30
- Karachentsev et al. (1993) Karachentsev I. D., Karachentseva V. E., Parnovsky S. L., 1993, Astron. Narchr., 314, 97
- Kauffmann (1996) Kauffmann G., 1996, MNRAS, 281, 487
- Kauffmann et al. (1996) Kauffmann G., Charlot S., White S. D. M., 1996, MNRAS, 283, L117
- Kent et al. (1991) Kent S. M., Dame T. M., Fazio G., 1991, ApJ, 378, 131
- Kormendy (1979) Kormendy J., 1979, ApJ, 227, 714
- Kormendy (1993) Kormendy J., 1993, in H. Dejonghe, H. J. Habing, eds, Galactic Bulges. Kluwer, Dordrecht, p. 209
- Kormendy & Kennicutt (2004) Kormendy J., Kennicutt R. C. Jr., 2004, ARA&A, 42, 603
- Kuijken & Merrifield (1995) Kuijken K., Merrifield M. R., 1995, ApJ, 443, L13
- Lewis & Freeman (1989) Lewis J. R., Freeman K. C., 1989, AJ, 97, 139
- Lütticke et al. (2000a) Lütticke R., Dettmar R.-J., Pohlen M., 2000a, A&AS, 145, 405
- Lütticke et al. (2000b) Lütticke R., Dettmar R.-J., Pohlen M., 2000b, A&A, 362, 435
- Martin & Roy (1994) Martin P., Roy J.-R., 1994, ApJ, 424, 599
- Martinez-Valpuesta et al. (2005) Martinez-Valpuesta I., Shlosman I., Heller C. H., 2005, ApJ, in press
- May et al. (1985) May A., van Albada T. S., Norman C. A., 1985, MNRAS, 214, 131
- McGregor et al. (1994) McGregor P., Hart J., Downing M., Hoadley D., Bloxham G., 1994, Exp. Astronomy, 3, 139
- Merrifiel & Kuijken (1999) Merrifield M. R., Kuijken K., 1999, A&A, 345, L47
- MacArthur et al. (2003) MacArthur L. A., Courteau S., Holtzman J. A., 2003, ApJ, 582, 689
- Michel-Dansac & Wozniak (2004) Michel-Dansac L., Wozniak H., 2004, A&A, 421, 863
- Mihos et al. (1995) Mihos J. C., Walker I. R., Hernquist L., de Oliveira, M. C., Bolte M., 1995, ApJ, 447, L87
- Nakasato & Nomoto (2003) Nakasato N., Nomoto K., 2003, ApJ, 588, 842
- Noguchi (1998) Noguchi M., 1998, Nature, 392, 253
- Noguchi (1999) Noguchi M., 1999, ApJ, 514, 77
- Norman et al. (1996) Norman C. A., Sellwood J. A., Hasan H., 1996, ApJ, 462, 114
- Patsis et al. (2002) Patsis P. A., Skokos Ch., Athanassoula E., 2002, MNRAS, 337, 578
- Patsis et al. (2003a) Patsis P. A., Skokos Ch., Athanassoula E., 2003a, MNRAS, 342, 69
- Patsis et al. (2003b) Patsis P. A., Skokos Ch., Athanassoula E., 2003b, MNRAS, 346, 1031
- Patsis & Xilouris (2006) Patsis P. A., Xilouris, E. M., 2006, MNRAS, 366, 1121
- Pfenniger (1984) Pfenniger D., 1984, A&A, 134, 373
- Pfenniger & Friedli (1991) Pfenniger D., Friedli D., 1991, A&A, 252, 75
- Pfenniger & Norman (1990) Pfenniger D., Norman C., 1990, ApJ, 363, 391
- Pohlen et al. (2000) Pohlen M., Dettmar R.-J., Lütticke R., Schwarzkopf U., 2000, A&AS, 144, 405
- Raha et al. (1991) Raha N., Sellwood J. A., James R. A., Kahn F. D., 1991, Nature, 352, 411
- Rowley (1988) Rowley G., 1988, ApJ, 331, 124
- Samland et al. (1997) Samland M., Hensler G., Theis Ch., 1997, ApJ, 476, 544
- Sandage (1961) Sandage A., 1961, The Hubble Atlas of Galaxies (Washington: Carnegie Institution of Washington)
- Sellwood & Wilkinson (1993) Sellwood J. A., Wilkinson A., 1993, Rep. Prog. Phys., 56, 173
- Schwarz (1981) Schwarz M. P., 1981, ApJ, 247, 77
- Schwarz (1984) Schwarz M. P., 1984, MNRAS, 209, 93
- Shaw (1987) Shaw M. A., 1987, MNRAS, 229, 691
- Shaw (1993) Shaw M., 1993, MNRAS, 261, 718
- Shaw & Gilmore (1989) Shaw M. A., Gilmore G., 1989, MNRAS, 237, 903
- Shaw & Gilmore (1990) Shaw M. A., Gilmore G., 1990, MNRAS, 242, 59
- Skokos et al. (2002a) Skokos Ch., Patsis P. A., Athanassoula E., 2002a, MNRAS, 333, 847
- Skokos et al. (2002b) Skokos Ch., Patsis P. A., Athanassoula E., 2002b, MNRAS, 333, 861
- Spaenhauer et al. (1992) Spaenhauer A., Jones B. F., Whitford A. E., 1992, AJ, 103, 297
- Spurzem et al. (2004) Spurzem R., Berczik P., Hensler G., Theis Ch., Amaro-Seoane P., Freitag M., Just A., 2004, PASA, 21, 188
- Steinmetz & Müller (1995) Steinmetz M., Müller E., 1995, MNRAS, 276, 549
- Thielheim & Wolff (1984) Thielheim K. O., Wolff H., 1984, ApJ, 276, 135
- van der Kruit & Searle (1981a) van der Kruit P. C., Searle L., 1981a, A&A, 95, 105
- van der Kruit & Searle (1981b) van der Kruit P. C., Searle L., 1981b, A&A, 95, 116
- van der Kruit & Searle (1982a) van der Kruit P. C., Searle L., 1982a, A&A, 110, 61
- van der Kruit & Searle (1982b) van der Kruit P. C., Searle L., 1982b, A&A, 110, 79
- Whitmore & Bell (1988) Whitmore B. C., Bell M., 1988, ApJ, 324, 741
- Wozniak et al. (1995) Wozniak H., Friedli D., Martinet L., Martin P., Bratschi P., 1995, A&AS, 111, 115
- Wyse et al. (1997) Wyse R. F. G., Gilmore G., Franx M., 1997, ARA&A, 35, 637
- Zaritsky et al. (1994) Zaritsky D., Kennicutt R. C. Jr., Huchra J. P., 1994, ApJ, 420, 87