Bianchi Type VIIh Models and the WMAP 3-year Data
Abstract
Context. A specific example of Bianchi Type VIIh models, i.e. those including universal rotation (vorticity) and differential expansion (shear), has been shown in Jaffe et al. (2005) to correlate unexpectedly with the WMAP first-year data.
Aims. We re-assess the signature of this model in the WMAP 3-year data.
Methods. The cross-correlation methods are described in Jaffe et al. (2006a). We use the WMAP 3-year data release, including maps for individual years, and perform additional comparisons to assess the influence of both noise and residual foregrounds and eliminate potential non-cosmological sources for the correlation.
Results. We confirm that the signal is detected in both the combined 3-year data and the individual yearly sky maps at a level consistent with our original analysis. The significance of the correlation is not affected by either noise or foreground residuals.
Conclusions. The results of our previous study are unchanged.
Key Words.:
cosmic microwave background — cosmology: observations1 Introduction
In Jaffe et al. (2005, 2006a), we reported on the unexpected detection of a correlation between the cosmic microwave background (CMB) sky measured by the WMAP first-year data release and a Bianchi Type VIIh template. This result is particularly provocative in that such a signal may provide an explanation for several independently discovered anomalies: the low quadrupole amplitude (de Oliveira-Costa et al., 2004) relative to the best-fit cosmological model, the curious alignment of several large angular scale multipoles along the so-called “axis of evil” (Land & Magueijo, 2005), a significant power asymmetry between two hemispheres on the sky (Hansen et al., 2004; Eriksen et al., 2004b) and a large temperature decrement towards a specific part of the southern sky as revealed by a wavelet analysis (Cruz et al., 2005; Vielva et al., 2004). The subtraction of the Bianchi component leaves a statistically isotropic sky.
In this note, we examine the newly released three-year data described in Hinshaw et al. (2006) and show that the signal is detected both in the combined 3-year data and in each individual yearly map, despite differences in the data processing pipelines, calibration and corrections for foreground contamination.
2 Methods
The methods used are described in detail in Jaffe et al. (2006a). In brief, we use a minimum- method to estimate the cross-correlation amplitude between the WMAP data and the deterministic Bianchi template derived by Barrow et al. (1985) and extended in Jaffe et al. (2006b) to include arbitrary dark energy models.
Full sky analysis is only possible using the highly processed internal linear combination (ILC) map, created by combining the data at different frequencies using weights that minimize the variance while preserving the cosmic signal. Such a combination is expected to clean the data of galactic emission. However, as pointed out by Eriksen et al. (2004a), the method does leave significant foreground residuals which particularly affect the galactic plane region. Hinshaw et al. (2006) point out that this is a consequence of the method minimising the variance by anti-correlating the CMB and foregrounds. In the 3-year release, an additional “de-biasing” is therefore applied that attempts to correct for this. With these data, we use the efficient total convolver algorithm (Wandelt & Górski, 2001) in harmonic space to find the best orientation of the Bianchi template relative to the data. We then use the sky maps from ten individual differencing assemblies (DAs) spanning five frequencies (K, Ka, Q, V, W) to confirm this result and assess the extent to which the full sky fit is affected by foreground residuals.
For individual frequency bands (derived by co-adding the corresponding DAs together) and combinations of bands, we fix the template at its best-fit location and perform simultaneous fits in pixel space of the Bianchi template and three templates to model the galactic foreground contribution. For thermal dust emission, we use either the 100m sky map derived by Schlegel et al. (1998, hereafter SFD) or a template at an effective frequency of 94 GHz (the WMAP W-band) derived from SFD using model 8 of Finkbeiner et al. (1999, hereafter FDS) that includes an additional correction for the dust temperature. Free-free emission is traced by maps of Hα. We consider two templates that differ in the way that they combine the available Hα survey data – Dickinson et al. (2003, hereafter DDD) or Finkbeiner (2003). For Galactic synchrotron emission we again consider two alternative templates: the 408 MHz survey of Haslam et al. (1982), and, following the WMAP analysis, the K-Ka difference map. The advantage of the latter is that it will more realistically account for the synchtron emission at the frequencies of interest, capturing some variation in the synchrotron spectral behaviour that a simple extrapolation of the 408 MHz data cannot. Moreover, it will also trace any additional foreground component at low frequencies that is not represented by the dust or Hα templates. This includes at least some fraction of the co-called “anomalous dust” emission – due to its correlation with the dust template – although the physical origin of this component still remains unclear (see Davies et al. 2006 for a relevant discussion). The fits are confined to the region outside the conservative Kp0 mask that eliminates bright emission from the Galactic plane and several hundred point sources. This is necessary since the former exhibits complex spatially varying spectral behaviour that the templates are not sufficiently accurate to quantify. We estimate the effect of high-latitude foreground residuals not well traced by these templates by fitting the Bianchi models to the foreground maps derived in Hinshaw et al. (2006) using a maximum-entropy (MEM) method. These include pixel-by-pixel variations in the foreground emission, but their noise properties are usual considered too complex to include in a cosmological analysis. However, this is not an issue for this work.
In order to characterize the effect of noise and systematic artifacts that are not well described by the WMAP noise model, we utilize year-to-year difference maps.
Finally, we use the LILC simulation pipeline of Eriksen et al. (2004a) to characterize the null hypothesis, namely the distribution of best-fit chance alignments arising between the Bianchi template and simulated skies containing no such contribution. A significance measure for a given template is then determined from the number of chance alignments with higher amplitude than that measured using the data.
For computational efficiency, all maps are smoothed to a 5.5 FWHM beam and downgraded to HEALPix111http://healpix.jpl.nasa.gov/ N resolution. All pixel-space fits include simultaneous fits of the monopole and dipole components, since these may contain additional non-cosmological contributions.
3 Results
The results of the model-space search using the ILC map over the full sky are presented in Fig. 1. As in Jaffe et al. (2006a), there is a region of high significance in the parameter space for right-handed models around seen in the right-hand column of Fig. 1. In the previous work, there was also a possible detection of a left-handed model at , which we examined in detail as well and concluded was due to foreground contamination in the galactic plane region. The left-hand column of Fig. 1 shows that this model is not a significant fit to the 3-year data. This change is likely due to the differences introduced by the de-biasing applied to the ILC in the 3-year release. This analysis repeats the search for the best-fit orientation of the template relative to the data and finds the same position as the previous best-fit to within one bin of 2.8 size at this resolution. Using the full-sky ILC maps, the best-fit model amplitude drops a few percent from to , which corresponds to a change in significance from to .
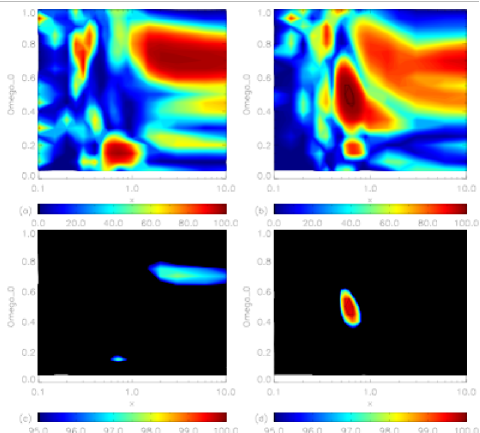
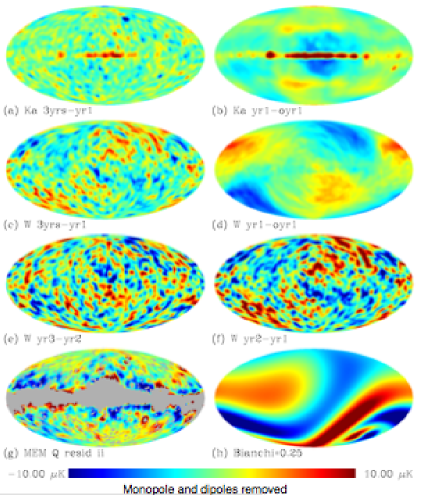
Fig. 2 presents several difference maps that indicate the amplitude and morphology of noise, calibration, and map-making effects which might influence the analysis. Fig. 2 (a) shows the Ka-band difference between the 3-year and 1-year map, where the time variability in a few point sources (shown here highly smoothed) is the dominant component. Fig. 2 (b) depicts the differences in the 1st year Ka-band sky maps arising from changes in the map-making and calibration methods between the current and original data releases. The observed structure arises from changes in the gain calibration solutions, and is particularly notable in the smoothed differences around point-sources along the galactic plane. See Jarosik et al. (2006) for a discussion of these differences. Figs. 2 (c) and (d) are the same for the W-band, although the point sources are no longer a significant contaminant. Figs. 2 (e) and (f) show two examples of the noise differences in the W-band between pairs of individual years. Fig. 2 (g) gives the residuals from fitting the foreground templates to the MEM Q-band foregrounds (see below). Lastly, Fig. 2 (h) shows the Bianchi template at one quarter of its best-fit amplitude for comparison. The Bianchi anisotropy amplitude is clearly much higher than any of these effects.
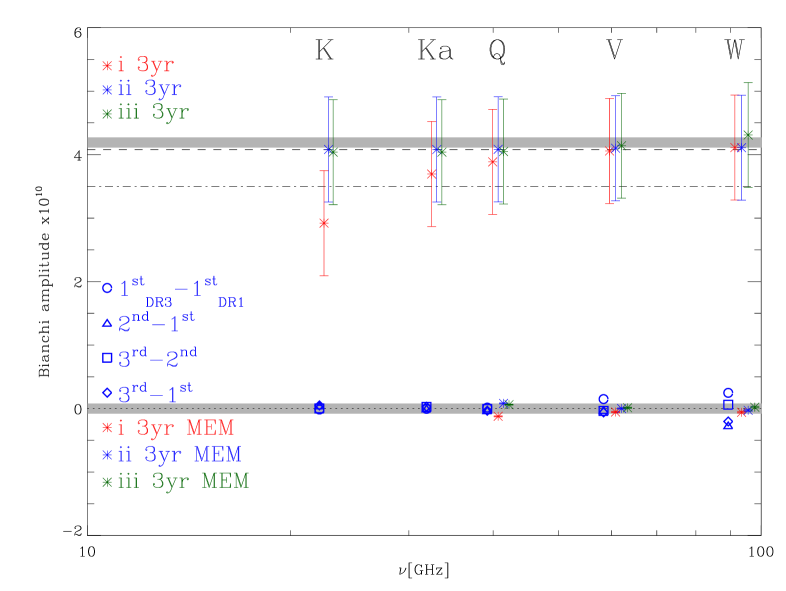
In Fig. 3, we plot the fits to year-to-year difference maps for each DA. The scatter clearly increases at high frequency, as expected due to the increased noise. W4 in particular shows significantly higher scatter than the other W-band assemblies, which is unsurprising considering that it has the highest level of noise (see Jarosik et al. 2003). We have also performed fits to maps constructed from the MEM foreground solutions to test for the effect of residuals not traced by the foreground templates. We find that the maximum Bianchi amplitude as fitted to these maps is less than 3% of the ILC fit amplitude, highest for the Q-band fits as expected for foregrounds that increasingly dominate at lower frequencies. The fits are plotted in Fig. 4, and the grey bands reflect the uncertainty in the fit results due to the noise and foreground residuals. The error bars are the statistical uncertainties almost entirely due to the isotropic CMB contribution.
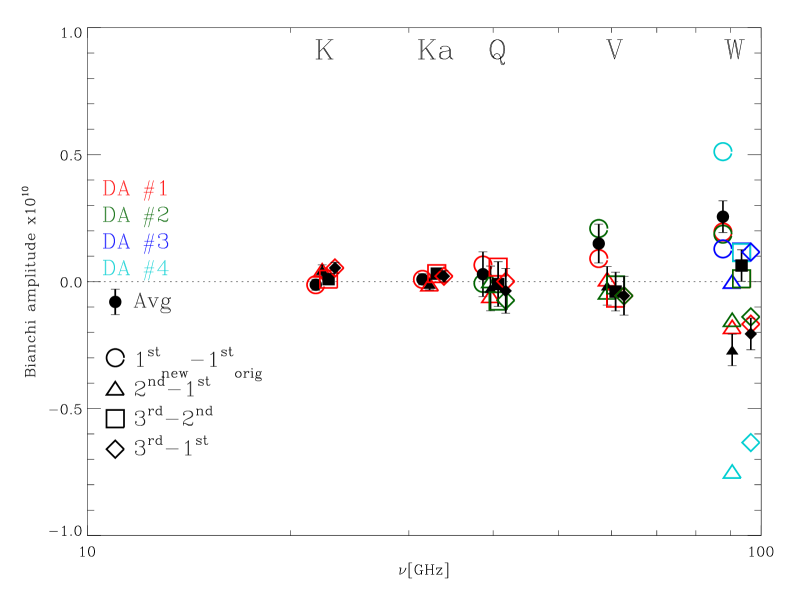
Table 1 shows that the results of the Bianchi fitting to the WMAP data are very stable and largely robust to foreground correction method and template selection. Although the fits to individual frequency bands are slightly lower than the ILC fit amplitude, they remain near or above the significance level. The most consistent results are derived when the K-Ka map is used as a synchrotron tracer, presumably because it can also account for whatever low-frequency foreground emission is not traced by the dust and free-free templates. By comparison, using the template combination of FDS dust, Finkbeiner Hα, and Haslam for synchrotron (as in our original analysis), there remains some low-frequency residual which anti-correlates with the CMB and therefore lowers the fit amplitudes. Using the DDD instead of the Finkbeiner Hα template and the SFD instead of the FDS thermal dust template again yields very consistent results. There is a small difference at W-band where the SFD template perhaps does not account for the thermal dust emission as well as the FDS template does.
The difference maps, which have no cosmic signal, give fit amplitudes of only 3% or less of the signal, consistent with the estimate given by the MEM fits. The 3-year fit values are also plotted in Fig. 4 with fits to noise and foreground maps additionally shown for comparison. The difference between the 3-year fits and the individual years is too small to see on this plot. The grey band around the fit value obtained with the ILC shows that, though they are slightly lower, the cut-sky fits do not vary in excess of what is expected due to such small foreground residuals and noise. Even with these effects, the fits are consistently at the 99% significance level compared with simulations (shown by the dashed line).
| Map | Amplitudes | ||||||||||||||
| -year | -year | -year | 3-year | 3-year % | |||||||||||
| WILC | |||||||||||||||
| i | ii | iii | i | ii | iii | i | ii | iii | i | ii | iii | i | ii | iii | |
| K | 2.92 | 4.08 | 4.03 | 2.96 | 4.12 | 4.08 | 2.95 | 4.10 | 4.08 | 2.92 | 4.08 | 4.04 | 41.6 | 98.9 | 98.8 |
| KA | 3.68 | 4.08 | 4.03 | 3.70 | 4.09 | 4.05 | 3.70 | 4.08 | 4.04 | 3.69 | 4.08 | 4.04 | 93.9 | 99.0 | 98.8 |
| Q | 3.87 | 4.07 | 4.03 | 3.88 | 4.07 | 4.04 | 3.91 | 4.10 | 4.07 | 3.89 | 4.08 | 4.05 | 97.3 | 99.1 | 98.9 |
| V | 4.09 | 4.13 | 4.17 | 4.06 | 4.10 | 4.14 | 4.03 | 4.07 | 4.11 | 4.06 | 4.10 | 4.14 | 98.9 | 99.2 | 99.3 |
| W | 4.15 | 4.15 | 4.35 | 4.06 | 4.05 | 4.26 | 4.13 | 4.13 | 4.33 | 4.11 | 4.11 | 4.31 | 99.1 | 99.1 | 99.8 |
| QVW | 3.95 | 4.10 | 4.10 | 3.94 | 4.08 | 4.09 | 3.95 | 4.09 | 4.10 | 3.95 | 4.09 | 4.09 | 98.0 | 99.1 | 99.1 |
| VW | 4.10 | 4.14 | 4.20 | 4.06 | 4.09 | 4.17 | 4.05 | 4.08 | 4.15 | 4.07 | 4.10 | 4.17 | 98.9 | 99.2 | 99.3 |
| Q-V | -0.06 | 0.08 | 0.05 | -0.07 | 0.07 | 0.04 | -0.05 | 0.10 | 0.07 | -0.06 | 0.08 | 0.05 | - | - | - |
| V-W | -0.13 | -0.09 | -0.16 | 0.11 | 0.15 | 0.08 | 0.03 | 0.06 | -0.01 | 0.00 | 0.04 | -0.03 | - | - | - |
| Q-W | -0.20 | -0.01 | -0.11 | 0.04 | 0.22 | 0.12 | -0.02 | 0.16 | 0.06 | -0.06 | 0.12 | 0.02 | - | - | - |
4 Conclusions
In Jaffe et al. (2005, 2006a), we showed that removing a Bianchi component from the WMAP initial data release can account for several large angular scale anomalies and yield a corrected sky that is statistically isotropic. Although we do not repeat all of these analyses here, we simply note that the change in the fit amplitude is too small to alter the previous conclusions. We have additionally shown in this work that the correlation cannot be attributed either to instrument noise, foreground residuals, or any known systematic corrected in the three-year WMAP data release.
In Jaffe et al. (2006b), we found that the cosmological parameters required to reproduce the Bianchi morphology are not compatible with the “cosmic concordance” of other datasets, including the small-scale CMB structure itself, ruling out these models as a realistic physical explanation for the anomalies. Nevertheless, a recent analysis with a statistically rigorous method in Bridges et al. (2006) has demonstrated, in agreement with our results, that the data do appear to require the Bianchi template. They give the “Bayesian evidence” in favor of a cosmology including vorticity and shear compared to one without as roughly , which is considered “significant”.
We conclude, therefore, that in the absence of an unknown systematic effect which could explain both the anomalies and the correlation, the WMAP data require an addition to the standard cosmological model that resembles the Bianchi morphology.
Acknowledgements.
We acknowledge use of the HEALPix software (Górski et al., 2005) and of the Legacy Archive for Microwave Background Data Analysis (LAMBDA). Support for LAMBDA is provided by the NASA Office of Space Science.References
- Barrow et al. (1985) Barrow, J. D., Juszkiewicz, R., & Sonoda, D. H. 1985, MNRAS, 213, 917
- Bridges et al. (2006) Bridges, M., McEwen, J. D., Lasenby, A. N., & Hobson, M. P. 2006, (astro-ph/0605325)
- Cruz et al. (2005) Cruz, M., Martínez-González, E., Vielva, P., & Cayón, L. 2005, MNRAS, 356, 29
- Davies et al. (2006) Davies, R. D., Dickinson, C., Banday, A. J., et al. 2006, submitted to MNRAS
- de Oliveira-Costa et al. (2004) de Oliveira-Costa, A., Tegmark, M., Zaldarriaga, M., & Hamilton, A. 2004, Phys. Rev. D, 69, 063516
- Eriksen et al. (2004a) Eriksen, H. K., Banday, A. J., Górski, K. M., & Lilje, P. B. 2004a, ApJ, 612, 633
- Eriksen et al. (2004b) Eriksen, H. K., Hansen, F. K., Banday, A. J., Górski, K. M., & Lilje, P. B. 2004b, ApJ, 605, 14
- Finkbeiner (2003) Finkbeiner, D. P. 2003, ApJS, 146, 407
- Górski et al. (2005) Górski, K. M., Hivon, E., Banday, A. J., et al. 2005, ApJ, 622, 759
- Hansen et al. (2004) Hansen, F. K., Banday, A. J., & Górski, K. M. 2004, MNRAS, 354, 641
- Haslam et al. (1982) Haslam, C. G. T., Stoffel, H., Salter, C. J., & Wilson, W. E. 1982, A&AS, 47, 1
- Hinshaw et al. (2006) Hinshaw, G., Nolta, M. R., Bennett, C. L., et al. 2006, ArXiv Astrophysics e-prints
- Jaffe et al. (2005) Jaffe, T. R., Banday, A. J., Eriksen, H. K., Górski, K. M., & Hansen, F. K. 2005, ApJ, 629, L1
- Jaffe et al. (2006a) Jaffe, T. R., Banday, A. J., Eriksen, H. K., Górski, K. M., & Hansen, F. K. 2006a, ApJ, in press
- Jaffe et al. (2006b) Jaffe, T. R., Hervik, S., Banday, A. J., & Górski, K. M. 2006b, ApJ, in press
- Jarosik et al. (2003) Jarosik, N., Barnes, C., Bennett, C. L., et al. 2003, ApJS, 148, 29
- Jarosik et al. (2006) Jarosik, N., Barnes, C., Greason, M. R., et al. 2006, (astro-ph/0603452)
- Land & Magueijo (2005) Land, K. & Magueijo, J. 2005, Physical Review Letters, 95, 071301
- Vielva et al. (2004) Vielva, P., Martínez-González, E., Barreiro, R. B., Sanz, J. L., & Cayón, L. 2004, ApJ, 609, 22
- Wandelt & Górski (2001) Wandelt, B. D. & Górski, K. M. 2001, Phys. Rev. D, 63, 123002