On the Iron content of NGC 1978 in the LMC: a metal rich, chemically homogeneous cluster111Based on observations collected at the Very Large Telescope of the European Southern Observatory (ESO), Cerro Paranal, Chile, under programme 072.D-0342 and 074.D-0369.
Abstract
We present a detailed abundance analysis of giant stars in NGC 1978, a massive, intermediate-age stellar cluster in the Large Magellanic Cloud, characterized by a high ellipticity and suspected to have a metallicity spread. We analyzed 11 giants, all cluster members, by using high resolution spectra acquired with the UVES/FLAMES spectrograph at the ESO-Very Large Telescope. We find an iron content of [Fe/H]=-0.38 dex with very low dex dispersion, and a mean heliocentric radial velocity km/s and a velocity dispersion km/s, thus excluding the presence of a significant metallicity, as well as velocity, spread within the cluster.
1 Introduction
The Large Magellanic Cloud (LMC) is the nearest galaxy of the Local Group with a very populous system of Globular Clusters (GCs) that cover a wide range of metallicity and age. At least three main populations can be distinguished, namely an old population, coeval with the Galactic GC system, an intermediate population (1-3 Gyr) and a young one (Gyr).
Despite its importance, there is still a lack of systematic and homogeneous works aimed
at determining the accurate chemical abundances and abundance patterns of the LMC
GC system.
Starting from the first compilation of metallicity by Sagar & Pandey (1989),
the most systematic analysis remains the work by Olszewski et al. (1991), who
estimate the metallicity of 70 LMC clusters using the Ca II triplet.
Other metallicity determinations
are based on the Lick spectral indices (de Freitas Pacheco et al., 1998),
integrated infrared (IR) spectroscopy (Oliva & Origlia, 1998) or derived
from Strömgren
(Dirsch et al., 2000; Larsen et al., 2000)
and Washington (Bica et al., 1998) photometry.
Detailed chemical abundances of LMC GCs from medium-high resolution spectroscopy are still scarce.
Hill et al. (2000) (hereafter H00) measured Fe, O, Al, Ca and Ti abundances of
a few giants in four GCs (namely NGC 1866, NGC 1978, ESO 121 and NGC 2257),
by using high resolution UVES spectra.
Korn et al. (2000) and Korn et al. (2002) measured a few B stars in 4 young LMC clusters and
inferred chemical abundances of
Fe, C, N, O and other -elements (see also Richtler et al., 1989).
Smith et al. (2002) measured 4 giants in NGC 1898 and NGC 2203
and obtained accurate abundances of Fe, C, N, O, Na, Sc, Ti.
Results about the chemical
composition of 4 old LMC GCs (namely
NGC 1989, NGC 2005, NGC 2019 and Hodge 11) are presented by
Johnson et al. (2006),
based on high-resolution spectra taken with MIKE at the Magellan telescope.
In this letter we present the first results of an undergoing project aimed at screening the
chemical composition of a complete sample of LMC GCs and their surrounding field
populations, by using UVES/FLAMES.
The major goal of our work is to derive a new homogeneous metallicity scale
based on high resolution spectroscopy together with
a detailed description of the abundance patterns of key metals as ,
iron-group and neutron-capture elements.
The first target observed in our survey is NGC 1978.
This intermediate-age (3.5 Gyr, Girardi et al., 1995)
cluster is very massive
(, Westerlund, 1997)
and located in a high density stellar region,
about 3.5∘ north of the bar field.
It also shows a peculiar,
very high ellipticity (, Geisler & Hodge, 1980; Fischer et al., 1992).
The multicolor BVRI photometry by Alcaino et al. (1999) has shown
a broad Red Giant Branch (RGB), consistent with a metallicity spread
[Fe/H]0.2 dex. On the basis of this evidence, the authors suggested
the possible existence of
two different sub-populations as the result of a merging.
This scenario was furtherly supported by
H00 who analyzed the high resolution spectra of two
giant stars located in the south-east region of the cluster.
They found [Fe/H]=–1.1 and -0.82 dex,
with a significant star-to-star difference ([Fe/H]0.3 dex).
However, the same stars were previously observed by Olszewski et al. (1991),
who found [Fe/H]=-0.46 and -0.38, i.e. a much higher (by a factor of 3)
metallicity and a much smaller ([Fe/H]0.08 dex) star-to-star difference.
In order to better understand the formation and evolution of NGC 1978, a detailed high resolution spectroscopic study of a significant sample of cluster stars is needed. Here we present the detailed abundance of Iron for 11 giants in NGC 1978.
2 Observations & Spectral Analysis
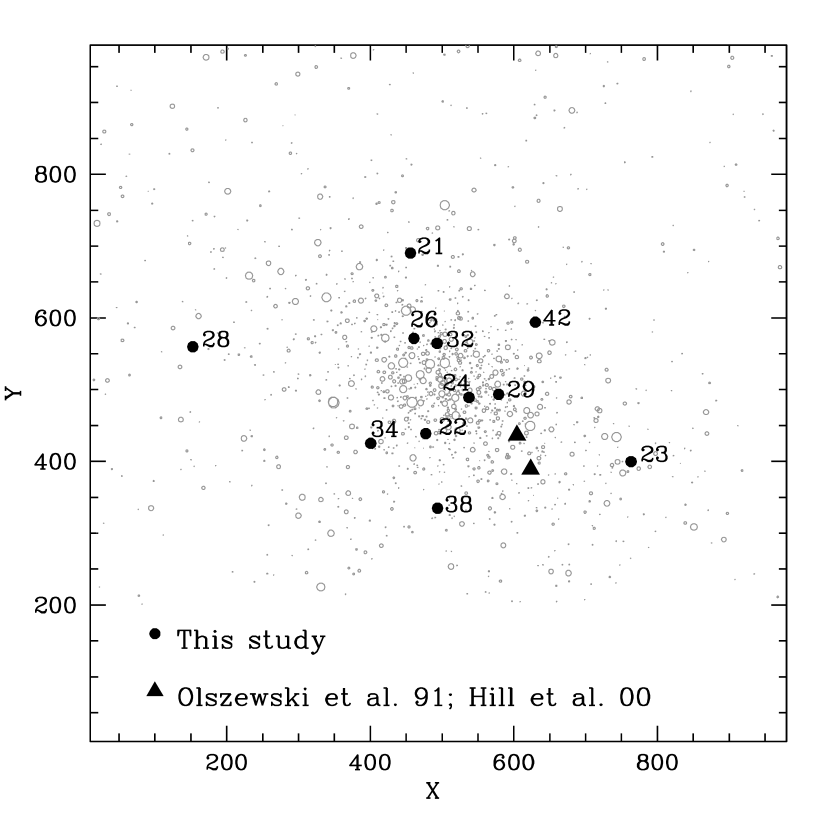
In order to establish whether a metallicity spread is present throughout NGC 1978, 11 RGB stars were observed in two different runs on October 2003 (ESO Program 072.D-0342(A)) and February 2005 (as a back-up programme within the ESO Program 074.D-0369(A)). We used the multi-object spectrograph UVES/FLAMES (Pasquini et al., 2002), mounted at the Kueyen 8 m-telescope (UT2) of the ESO Very Large Telescope (VLT). The UVES set-up (RED ARM, centered at 5800 ) provides a wavelength coverage of 4800-6800 and a resolution R. The spectra have been acquired in series of 4-6 exposures of 45min each, flat-field corrected and average-combined together for a total exposure time of 3-5 hrs. The final spectra have typical 40. The selection of the target stars is based on our high quality near-IR photometry of the cluster by using SOFI mounted at the ESO-NTT (Ferraro et al., 2004a; Mucciarelli et al., 2006). Fig. 1 shows the position of the 11 giants in the IR K,(J-K) Color Magnitude Diagram (CMD). The stars are also well distributed within the cluster area, as shown in Fig. 2.
Fig. 3 shows an example of the final spectra used for the spectral analysis. From the measured radial velocity (see Table 1) we find that all the 11 stars are cluster members, with a mean heliocentric velocity =+293.10.9 km/s, and a velocity dispersion =3.1 km/s, in excellent agreement with the 292.4 km/s, previously determined by Olszewski et al. (1991).
The analysis of the chemical abundances was performed using the ROSA package (Gratton, 1988). The line equivalent widths (EWs) of the observed spectra have been measured by Gaussian fitting the line profiles, adopting a relationship between EW and FWHM (see e.g. Bragaglia et al., 2001); an iterative clipping average over a fraction of the highest spectral points around each line has been applied to derive a local continuum. The details of the line list and the corresponding atomic parameters are given in Gratton et al. (2003). The stellar temperatures () have been estimated using the IR (J-K) color and the transformations by Alonso et al. (1999, 2001) and Montegriffo et al. (1998). Since the difference between the two temperature scales in the cool regime is always K, we adopted the average of the two values. Gravity has been estimated accordingly to the location of the stars in the CMD and using a theoretical isochrone of 3 Gyr and Z=0.008 from Cariulo et al. (2004), by assuming a stellar mass of 1.37 , a distance modulus of =18.5 (van den Bergh, 1998), a reddening of E(B-V)=0.1 (Persson et al., 1983) and the interstellar extinction law defined by Rieke & Lebofsky (1985). For the bolometric corrections we used those computed by Montegriffo et al. (1998). Note that a slightly different choice of the isochrone metallicity has a negligible impact on the inferred stellar gravity: indeed, by varying the former by a factor of 2, the mass changes by 0.03 which translates into a gravity variation of 0.01 dex. Conversely different assumption for the cluster age can have some impact, we find that a 1 Gyr age variation implies a 0.05 dex gravity variation. Accordingly to Magain (1984) prescriptions, the microturbulence velocity (see Table 1) is obtained by removing the residual trend of the derived FeI abundances with the predicted line strengths X (defined as ), using a large number (typically 70-80) of FeI lines for each star. ATLAS model atmospheres with convective overshooting by Kurucz (1993) are used to perform the abundance analysis.
Table 1 shows the adopted atmospheric parameters and
the values of [Fe/H]I
111We adopt the usual spectroscopic notation: [A]=log-log for any
abundance quantity A; log(A) is the abundance by number of the element A in the standard scale
where log(H)=12. and [Fe/H]II for all the program stars. The and
number of lines
used to derive the abundance
are also listed.
We adopt reference solar log n(FeI)=7.54 and n(FeII)=7.49 for neutral and ionized Fe,
respectively (see Gratton et al., 2003). Given the low temperature of the observed stars and in order to
avoid spurious effects due to line blending, only a few safe lines were used to derive the FeII
abundance. In particular, for three stars (namely, NGC1978-21, NGC1978-34, NGC1978-23) no good
lines are available.
Plots reported in Fig. 4 represent a test to the validity of our analysis.
In particular, the absence of any trend of (where is the
excitation potential) with respect to (mid panel of Figure 4) supports the reliability
of our temperature scale222We estimate that the typical derived from excitation
equilibrium should be lower by K with respect to the photometric
estimates. This systematic turns out to be comparable with internal errors in ..
Similarly, the absence of trend in upper panel is a good proof of the correctness of our
microturbulent velocities. We underline this point because H00 estimated (for similar stars in this
cluster) a larger value (tipically km/s). This difference is clearly due to the
different metodology used to calculate this parameter: H00 used the observed EWs and not, as we
do, the expected line strengths.
3 Results and discussion
Our spectroscopic analysis based on 11 cluster member stars provides an average iron abundance from neutral FeI lines of [Fe/H]I=–0.380.02 dex and [Fe/H]II=–0.260.02 dex from singly ionized lines. The overall metallicity dispersion is =0.07 dex. The overall error budget in [Fe/H] has been computed accordingly to the uncertanties in the adopted atmospheric parameters and in the measured EWs. Uncertainties in temperatures (typically 60 K) are estimated by taking in account the errors of the infrared colors (typically mag) and reddening ( mag). The uncertainty in gravity ( 0.08 dex) is obtained by quadratically summing uncertainties in temperature, in distance modulus and in bolometric correction. 1 random error ( 0.11 km/s) in microturbolent velocity has been estimated from the slope of the abundance/line strenght relation. The internal errors in [A/H] are typically less than 0.10 dex. Finally, the contribution of the EW measurement uncertainties to the abundance error budget was estimated by dividing the average rms scatter of FeI lines (assumed to represent the error of each individual line) by the square root of the number of lines. Considering all these errors sources we obtain a total uncertanty of 0.07 dex for [Fe/H]I and 0.17 dex for [Fe/H]II, fully consistent with the (low) cluster metallicity dispersion. This confirms the high homogeneity level in iron content of this cluster333A further test about the validity of our analysis was performed. We divided our sample in two sub-groups: the first included stars with and the second with ; only the coolest star (NGC 1978-23) is excluded. The spectra of stars in each group have been summed and high S/N combined spectra were obtained. We repeat the abundance analysis described above, using the average atmospheric parameters for each group. The resulting [Fe/H] from these combined spectra is in excellent agreement with the the iron content derived from individual stellar spectra, the difference being dex..
Our average metallicity is in good agreement with the previous estimate by Olszewski et al. (1991), who obtained [Fe/H]=–0.420.04, while both these estimates disagree with the significant lower abundance ([Fe/H]=–0.960.15) found by H00. Unfortunately we did not re-observed the two stars measured by H00, hence no direct comparison can be done. However, the relatively large number of giants measured in this work and the accurate tests we perform on the abundance analysis suggested that our result is quite solid. It is also worth noticing that high metallicity estimate for this intermediate-age cluster is in agreement with the recent finding (see e.g. Cole et al., 2000; Smith et al., 2002; Cole et al., 2005) that the metallicity distribution of intermediate-age LMC field stars shows a remarkable peak in the abundance distribution at [Fe/H] dex.
Though the discussion of the overall age-metallicity relation in the LMC is beyond the purpose of this paper, the result obtained here deserves a few considerations. It is interesting to note that NGC1978 is in the age range where different star formation (SF) models provide significantly different predictions in the age-metallicity relation. For example, the predictions of the two models discussed by Pagel & Tautvaisiene (1998) (see their Figure 4), show significant differences for clusters in the 2-10 Gyr age range. The two models are also discussed by H00 and compared with some observations (see their Figure 4a). Here we just note that the current age estimate for NGC1978 (3.5 Gyr, Girardi et al., 1995), and our metallicity determination, place the cluster in a position within the age-metallicity diagram more consistent with a smooth SF rather than with a bursting model. Of course no firm conclusion can be reached on the basis of only one cluster, however we strongly emphasize how only the combination of accurate metallicities and age determinations could significantly improve our knowledge in the star formation history of the LMC. Hence an accurate determination of the NGC1978 age based on highly accurate CMD is urgent to properly locate the cluster in the age-metallicity diagram.
NGC 1978 is one of the most massive stellar cluster in the LMC and it has been suspected
to harbor a chemically inhomogeneous stellar population (see Sect. 1).
Note that both the most massive stellar systems in the halos of our Galaxy
( Cen, , Merritt, Meylan & Mayor, 1997)
and M31
(G1, , Meylan et al., 2001)
show evidence of
a metallicity spread and a complex star formation history
(Ferraro et al., 2004b; Sollima al., 2005).
Curiously, both these massive stellar systems show a relatively large ellipticity
(0.2), similar to NGC 1978. These properties
have been interpreted as possible signatures of a merging event444Note that
several clusters in the MC appear to be binary (or show cluster-to-cluster
interaction).. Hence our findings deserve a few additional comments in the
context of
the cluster formation.
The fact that our targets are well distributed within the entire
cluster area (see Fig. 2) and that they show an high level of homogeneity
in their Iron abundance
allows us to safely
conclude that NGC 1978 does not show any signature
of metallicity spread.
Also, the IR CMDs presented by Mucciarelli et al. (2006) do not confirm
the presence of a significant spread along the RGB (contrary to the claim of Alcaino et al. (1999)).
Of course,
our finding makes the merging hyphothesis poorly convincing
since it would require either that the two sub-units had similar metallicity
or that the two gas clouds with different metallicities efficiently mixed
at better than dex before star formation started.
Both these occurrences are quite unlikely, hence we can safely conclude that
there is not signature pointing at a
merging event in the formation history of this cluster.
Moreover, previous dynamical studies of this cluster (Fischer et al., 1992)
already found no evidence for merging.
Finally,
it is also worth noticing that ellipticity
is a common feature of many LMC and Galactic
clusters (see e.g. Goodwin, 1997) with no evidence of a metallicity spread.
A few explanations for a large ellipticity, other than merging, can be
advocated, the two most likely being either cluster rapid
rotation and/or strong tidal interactions with the parent galaxy.
References
- Alcaino et al. (1999) Alcaino, G., Liller, W., Alvarado, F., Kravtsov, V., Ipatov, A., Samus, N., & Smirnov, O., 1999, A&AS, 135, 103
- Alonso et al. (1999) Alonso, A., Arribas, S., & Martinez-Roger, C., 1999, A&AS, 140, 261
- Alonso et al. (2001) Alonso, A., Arribas, S., & Martinez-Roger, C., 2001, A&A, 376, 1039
- Bica et al. (1998) Bica, E., Geisler, D., Dottori, H. Claria, J. J., Piatti, A. E., & Santos, J. F. C., Jr. 1998, AJ, 116, 723
- Bragaglia et al. (2001) Bragaglia, A. et al., 2001, AJ, 121, 327
- Cariulo et al. (2004) Cariulo, P., Degl’Innocenti, S., & Castellani, V., 2004, A&A, 421, 1121
- Cole et al. (2000) Cole, A. A., Smecker-Hane, T. A., & Gallagher, J. S., 2000, AJ,120, 1829
- Cole et al. (2005) Cole, A. A., Tolstoy, E., Gallagher, J. S., & Smecker-Hane, T. A., 2005, AJ,129, 1482
- de Freitas Pacheco et al. (1998) de Freitas Pacheco, J. A., Barbuy, B., & Idiart, T., 1998, A&A, 332, 24
- Dirsch et al. (2000) Dirsch, B., Richtler, T., Gieren, W. P., & Hilker, M., 2000,A&A, 360, 160
- Ferraro et al. (2004a) Ferraro, F. R., Origlia, L., Testa, V. & Maraston, C., 2004a, ApJ, 608, 772
- Ferraro et al. (2004b) Ferraro, F. R., Sollima, A., Pancino, E., Bellazzini, M., Straniero, O., Origlia, L., Cool, A. M. 2004b, ApJ, 603, L81
- Fischer et al. (1992) Fischer, P., Welch, D. L., & Mateo, M., 1992, AJ, 104, 3
- Geisler & Hodge (1980) Geisler, D.& Hodge, P., 1980, ApJ, 242, 73
- Girardi et al. (1995) Girardi, L., Chiosi, C., Bertelli, G., & Bressan, A., 1995, A&A, 298, 87
- Goodwin (1997) Goodwin, S. P. 1997, MNRAS, 286, L39
- Gratton (1988) Gratton, R. G., 1988, Rome Obs. Preprint, 29
- Gratton et al. (2003) Gratton, R. G., Carretta, E., Claudi, R., Lucatello, S., & Barbieri, M., 2003, A&A, 404, 187
- Hill et al. (2000) Hill, V., Francois, P., Spite, M., Primas, F., & Spite, F., 2000, A&AS, 364, 19
- Johnson et al. (2006) Johnson, J. A., Ivans, I. I.& Stetson, P. B., 2006, ApJ, 640, 801
- Korn et al. (2000) Korn, A. J., Becker, S. R., Gummersbach, C. A., & Wolf, B. 2000, A&A, 353, 655
- Korn et al. (2002) Korn, A. J., Keller, S. C., Kaufer, A., Langer, N., Przybilla, N., Stahl, O., & Wolf, B. 2002, A&A, 385, 143
- Kurucz (1993) Kurucz, R. L., 1993, CD-ROM 13, Smithsonian Astrophysical Observatory, Cambridge
- Larsen et al. (2000) Larsen, S. S., Clausen, J. V., & Storm, J., 2000, A&A, 364, 466
- Magain (1984) Magain, P. 1984, A&A, 134, 189
- Merritt, Meylan & Mayor (1997) Merritt, D., Meylan, G., Mayor M., AJ, 114, 1074
- Meylan et al. (2001) Meylan, G., Sarajedini, A., Jablonka, P., Djorgovski, S. G., Bridges, T., Rich, R. M. 2001, AJ, 122, 830
- Montegriffo et al. (1998) Montegriffo, P., Ferraro, F. R., Fusi Pecci, F., & Origlia, L., 1998, MNRAS, 297, 872
- Mucciarelli et al. (2006) Mucciarelli, A., Origlia, L., Ferraro, F. R., Testa, V., & Maraston, C., 2006, astro-ph/0604139, ApJ, in press
- Olszewski et al. (1991) Olszewski, E. W., Schommer, R. A., Suntzeff, N. B. & Harris, H. C., 1991, AJ, 101, 515
- Oliva & Origlia (1998) Oliva, E., & Origlia, L. 1998, A&A, 332, 46
- Pagel & Tautvaisiene (1998) Pagel, B. E. J., & Tautvaisiene, G., 1998, MNRAS, 299, 535
- Pasquini et al. (2002) Pasquini, L. et al., Messenger, 110, 1
- Persson et al. (1983) Persson, S. E., Aaronson, M., Cohen, J. G., Frogel, J. A., & Matthews, K.,1983
- Richtler et al. (1989) Richtler, T., Spite, M., & Spite, F. 1989, A&A, 225, 351
- Rieke & Lebofsky (1985) Rieke, G. H., & Lebofsky, M. J. 1985, ApJ, 288, 618
- Sagar & Pandey (1989) Sagar, R., & Pandey, A. K. 1989, A&AS, 79, 407
- Smith et al. (2002) Smith. V. V., et al., 2002, A&A, 124, 1254
- Sollima al. (2005) Sollima, A., Pancino, E., Ferraro, F. R., Bellazzini, M., Straniero, O., Pasquini, L. 2005, ApJ, 634, 332
- van den Bergh (1998) van den Bergh, S., 1998,PASP, 110, 1377
- Westerlund (1997) Westerlund, B. E. 1997, The Magellanic Clouds, Cambridge Astrophysics Series, 29, 72
| Id | [A/H] | [Fe/H]I | rms | [Fe/H]II | rms | ||||||
|---|---|---|---|---|---|---|---|---|---|---|---|
| (km/s) | (K) | (dex) | (dex) | (km/s) | |||||||
| 1978-21 | 291.5 | 3790 | 0.64 | -0.43 | 1.54 | 74 | -0.43 | 0.16 | — | — | — |
| 1978-22 | 290.6 | 3700 | 0.55 | -0.37 | 1.50 | 78 | -0.39 | 0.17 | 7 | -0.27 | 0.19 |
| 1978-23 | 292.3 | 3630 | 0.57 | -0.24 | 1.35 | 70 | -0.25 | 0.21 | — | — | — |
| 1978-24 | 288.7 | 3750 | 0.62 | -0.30 | 1.40 | 59 | -0.30 | 0.17 | 1 | -0.17 | — |
| 1978-26 | 292.1 | 3820 | 0.71 | -0.43 | 1.53 | 83 | -0.42 | 0.15 | 1 | -0.28 | — |
| 1978-28 | 290.5 | 3740 | 0.69 | -0.33 | 1.28 | 85 | -0.33 | 0.18 | 2 | -0.17 | 0.01 |
| 1978-29 | 298.4 | 3750 | 0.71 | -0.44 | 1.58 | 89 | -0.44 | 0.21 | 4 | -0.30 | 0.06 |
| 1978-32 | 291.5 | 3700 | 0.73 | -0.40 | 1.39 | 84 | -0.41 | 0.19 | 2 | -0.30 | 0.18 |
| 1978-34 | 297.1 | 3900 | 0.83 | -0.32 | 1.49 | 84 | -0.32 | 0.20 | — | — | — |
| 1978-38 | 296.3 | 3840 | 0.81 | -0.43 | 1.59 | 72 | -0.44 | 0.14 | 2 | -0.37 | 0.11 |
| 1978-42 | 295.5 | 3880 | 0.86 | -0.43 | 1.55 | 92 | -0.43 | 0.18 | 2 | -0.26 | 0.17 |