Oxygen Chemistry in the Circumstellar Envelope of the Carbon-Rich Star IRC+10216
Abstract
In this paper we study the oxygen chemistry in the C-rich circumstellar shells of IRC+10216. The recent discoveries of oxygen bearing species (water, hydroxyl radical and formaldehyde) toward this source challenge our current understanding of the chemistry in C-rich circumstellar envelopes. The presence of icy comets surrounding the star or catalysis on iron grain surfaces have been invoked to explain the presence of such unexpected species. This detailed study aims at evaluating the chances of producing O–bearing species in the C-rich circumstellar envelope only by gas phase chemical reactions. For the inner hot envelope, it is shown that although most of the oxygen is locked in CO near the photosphere (as expected for a C/O ratio greater than 1), some stellar radii far away species such as H2O and CO2 have large abundances under the assumption of thermochemical equilibrium. It is also shown how non-LTE chemistry makes very difficult the COH2O, CO2 transformation predicted in LTE. Concerning the chemistry in the outer and colder envelope, we show that formaldehyde can be formed through gas phase reactions. However, in order to form water vapor it is necessary to include a radiative association between atomic oxygen and molecular hydrogen with a quite high rate constant. The chemical models explain the presence of HCO+ and predict the existence of SO and H2CS (which has been detected in a 3 mm line survey to be published). We have modeled the line profiles of H2CO, H2O, HCO+, SO and H2CS using a non-local radiative transfer model and the abundance profiles predicted by our chemical model. The results have been compared to the observations and discussed.
Subject headings:
astrochemistry — circumstellar matter — molecular processes — stars: AGB and post-AGB — stars: individual(IRC+10216)1. Introduction
IRC+10216 is a low mass AGB star losing mass at a rate of 2-410-5 M⊙ yr-1 in the form of a molecular and dusty wind that produces an extended circumstellar envelope (CSE). The processes of dredge-up that occurs during this evolutionary late stage alter the elemental composition in the stellar surface (that is roughly solar, C/O1, during the main sequence phase) resulting, in the case of IRC+10216, in a C/O ratio greater than 1, in what is known as a carbon star.
The physical conditions in the vicinity of the photosphere of an AGB star (typical temperatures of 2500 K and densities of 1014 cm-3) make the material to be mainly molecular, with a composition determined by local thermodynamic equilibrium (LTE). It is now well established since the pioneering work of Tsuji (1973) that the C/O ratio completely determines the kind of chemistry taking place. The high stability of CO makes this molecule to have a large abundance locking almost all of the limiting reactant and allowing for the reactant in excess to form either carbon bearing molecules when C/O1, and the opposite, i.e., oxygen bearing molecules, when C/O1. This has been extensively confirmed by observations. A look to the list of molecules detected in IRC+10216 confirms that they are mostly carbon bearing species (see table 1 in Cernicharo et al. 2000 and §3). The only oxygen bearing molecule in C-rich AGB stars with a significant abundance, apart from CO, is SiO (Morris et al., 1975).
However, some other O–bearing molecules such as H2O (Melnick et al., 2001; Hasegawa et al., 2006), OH (Ford et al., 2003), and H2CO (Ford et al., 2004) have recently been detected in IRC+10216. The existence of such molecules has been interpreted as the result of evaporation of cometary ices from a Kuiper belt analog in IRC+10216 (Ford & Neufeld, 2001). The luminosity increase of the star, intrinsic to the red giant phase, would have caused the ice sublimation and subsequent release of water vapor to the gas phase in the circumstellar shells. OH would be produced when water is photodissociated by the interstellar UV field in the unshielded outer envelope and H2CO would be the photodissociation product of an unknown parent molecule produced by sublimation of the ice mantles of these comets.
An alternative explanation has been proposed by Willacy (2004) in which H2O would be produced through Fischer-Tropsch catalysis on the surface of iron grains, that would be present in the expanding envelope due to condensation from the gas phase of some fraction of the available iron. Fischer-Tropsch catalysis breaks the CO bond and produces H2O and hydrocarbons such as CH4.
O–bearing species have also been detected in the C-rich protoplanetary nebula CRL618 (Herpin & Cernicharo, 2000). However, the production of these species has been interpreted by Cernicharo (2004) as the result of a rich photochemistry in a region of high density (107 cm-3) and temperature (200-300 K) where large complex carbon-rich molecules are also produced (Cernicharo et al., 2001).
The aim of this paper is to investigate whether oxygen bearing molecules could be produced in the carbon-rich expanding gas of AGB stars by non-LTE mechanisms. LTE calculations provide a good estimation of molecular abundances in the vicinity of the photosphere but as the gas expands the temperature and density decrease significantly and the chemical timescale increases, making chemical kinetics dominant in determining the molecular abundances. We describe the model of the circumstellar envelope in §2. The reaction network is discussed in §3. The results of the chemical model are presented in §4 together with comparisons of radiative transfer calculations with available observations. The conclusions are given in §5.
2. The Circumstellar envelope
We assume spherical symmetry for the circumstellar envelope. In order to calculate the molecular abundances at different radii in the CSE, we follow the history of a volume element of gas with a given chemical composition travelling from the photosphere (=) to the end of the envelope (1018 cm). We build a system of differential equations which integration yields the temporal evolution of the density of each gas species. The time has to be interpreted as radial position provided the gas travels outwards at a given velocity. Different processes are considered during this travel depending on the position in the CSE. Kinetic temperature (which determines the reaction rate constants) and total gas density radial profiles are needed to solve the system of equations. The values adopted for the different parameters used to model the CSE are given in table 2.2.
For model purposes the CSE is considered to consist of three different regions: the innermost region, the inner envelope, and the intermediate and outer envelope.
2.1. The innermost region
This zone corresponds to the region between the photosphere and (see Fig. 1a) . The adopted physical conditions are:
– The temperature is considered to vary as a power law of the radius
| (1) |
where is the temperature at the photosphere and is the star radius.
– The density profile is given by hydrostatic equilibrium. Considering the above temperature law, the gas density can be expressed as follows in terms of the value at ,
| (2) |
where is the Boltzmann constant, is the gravitational constant, the mass of the star, is the mass of a hydrogen atom and the mean molecular weight of gas.
The high densities and temperatures in this region allow to assume that molecular abundances are given by a LTE calculation.

2.2. The inner envelope
The gas travels from to (see Fig. 1a), where stands for condensation radius. At this distance, grain formation is supposed to occur. Radiation pressure on grains, together with momentum coupling of gas and grains, make the gas accelerate up to a terminal expansion velocity which remains constant beyond . The mechanism responsible for the transport of the gas from to is somewhat controversial. Hydrodynamical models (Bowen, 1988) have shown that pulsational driven shocks can gradually move the gas up to . Willacy & Cherchneff (1998) have applied this approach for modelling the chemistry in the inner envelope. An alternative mechanism could be that the gas close to the photosphere pulsates around an equilibrium position with an associated radial velocity very similar to the escape velocity. This could lead to a scenario in which shells of gas that are in levitation can eventually escape from the surroundings of the photosphere and some of them could reach .
– The temperature profile in this region is given by equation 1.
– For the density profile we follow the treatment of a shocked extended region of a C-rich CSE of Cherchneff et al. (1992)
| (3) |
where is defined in Cherchneff et al. (1992) and is explained in the next paragraph.
The reference value is not evident neither from observations nor from models. Previous models of the inner envelope of IRC+10216 (Cherchneff et al., 1992; Willacy & Cherchneff, 1998) have used high values of based on hydrodynamical models for periodically shocked Mira-like stars, which have density profiles as an output. However, with such high values, the extrapolation to larger radii produces densities for the outer envelope much higher than those obtained from the law of conservation of mass, in which the absolute density is well determined by the mass loss rate and the expansion velocity (see equations 5 and 6 in §2.3). To reconcile the outer envelope density law with the high values in the inner regions we introduce the arbitrary factor in equation 3. We consider three different density laws for the inner envelope, shown in Fig 1a, whose parameters and are given in table 2.2: MI (I for intermediate density); MH (H for high density), also considered for comparing our results with the previous model of Willacy & Cherchneff (1998) although it overestimates the density for large radii; and finally ML (L for low density). We point out that the chemical time scale strongly depends on the density and also the H/H2 ratio is completely different in a low or high density situation (see Figs. 1b, 1c and 1d). We will comment this in §4.1.
Another issue is how the gas travels from to . As
discussed above, different mechanisms could be operating. The
simplest assumption to model the chemistry is to consider that the
gas travels at constant velocity in this inner envelope. When
using this approach we will assume a velocity of 1 km/s.
– SiO condensation onto SiC grains. Considering non-LTE
effects, we investigated whether deposition of Si species (that
are specially refractory) on SiC grains could affect the oxygen
chemistry because SiO is the second more abundant O–bearing
molecule. The scheme for grain formation in IRC+10216 could be as
follows. The major type of grains are carbonaceous, most probably
amorphous carbon (A.C.) as indicated by fitting the IR spectrum
(Bagnulo et al., 1995). These grains would originate in condensation
processes involving C2H2 (the most abundant C–bearing
molecule after CO) that would take place at 1000 K (4
R∗). A minor type of grains would be SiC, as indicated by the
11.3 m feature in the IR spectrum (Lorenz-Martins & Lefèvre, 1993), that would
condense at 1500 K (2 R∗). This condensation
sequence is due to an inverse greenhouse effect in both types of
grains (see McCabe 1982 for a theoretical approach and
Frenklach et al. 1989 for experimental evidence). Although a more
correct approach would be a chemical mechanism leading to the
formation of grains from gaseous molecules, for our purposes we
describe the condensation of SiC grains (A.C. grains are not
considered because we are just interested in deposition of Si
species on SiC grains) as a two-step process: (1)
nucleation from SiC gas molecules in the context of
homogeneous nucleation theory, which is basically described by the
nucleation rate (number of condensation nuclei formed per
unit time and unit volume); and (2) growth of grains by
accretion of gas phase molecules, that is described by the grain
radius . The calculation of
these two magnitudes is detailed in Appendix A.

| Abundances relative to H2 | |||||||||
| for parent species entering | |||||||||
| IRC+10216 parameters | Neutral molecules considered | into the outer envelope | |||||||
| 1 | /cm | 6.5 1013 | CH | H2 | N2 | SiH | H2 | ||
| 2 | /M⊙ | 2 | CH2 | O2 | NH | SiH2 | 18 | H | 4.5 10-3 |
| 2 | /R∗ | 1.2 | CH3 | OH | NH2 | SiH3 | 10 | He | 2.0 10-1 |
| 1 | / | 5 | CH4 | H2O | NH3 | SiH4 | 7 | CO | 6.0 10-4 |
| 1 | /K | 2320 | C2 | HO2 | CN | Si2 | 19 | C2H2 | 8.0 10-5 |
| 3 | 0.6 | C2H | H2O2 | HCN | SiC | 19 | HCN | 4.9 10-5 | |
| 2 | /cm-3 | 3.7 1014 | C2H2 | CO | NS | SiCH | 10 | N2 | 8.0 10-5 |
| /cm-3 | 1.2 1012 | C2H3 | CO2 | SH | SiCH2 | 13 | C2H4 | 2.0 10-8 | |
| 1 | C2H4 | HCO | H2S | SiC2 | 11 | CH4 | 3.5 10-6 | ||
| 1.8565 | C2H5 | H2CO | CS | Si2C | 11 | NH3 | 1.7 10-7 | ||
| 4 | /days | 650 | C2H6 | CH3O | HCS | SiN | 11 | SiH4 | 2.2 10-7 |
| 3 | 0.89 | C3 | CH2OH | H2CS | SiNH | 14 | H2S | 6.0 10-10 | |
| 3 | (rrc)/amu | 1.7 | C3H | CH3OH | S2 | SiO | 15 | CS | 1.2 10-7 |
| 5 | /(km/s) | 14.5 | C3H2 | HCCO | CS2 | SiO2 | 16 | SiS | 4.3 10-6 |
| 6 | /(M⊙ yr-1) | 3 10-5 | C4 | NO | SO | SiS | 17 | SiC2 | 5.0 10-8 |
| 7 | distance/pc | 150 | C4H | NCO | SO2 | 11 | SiO | 8.0 10-7 | |
| 8 | 12.7 | C4H2 | OCS | ||||||
References. — 1 Ridgway & Keady 1988; 2 Willacy & Cherchneff 1998; 3 Cherchneff et al. 1992; 4 Witteborn et al. 1980; 5 Cernicharo et al. 2000; 6 Glassgold 1996; 7 Crosas & Menten 1997; 8 Doty & Leung 1998; 9 Rouleau & Martin 1991; 10 calculated according to LTE, solar elemental abundances and a C/O ratio of 2; 11 Keady & Ridgway 1993; 12 Wiedemann et al. 1991; 13 Goldhaber et al. 1987; 14 Abundance derived from the 11,0-10,1 line of ortho-H2S observed in Cernicharo et al. 2000 in the optically thin and LTE limit assuming Trot = 20 K and considering that H2S is present for r50 R∗; 15 Henkel et al. 1985; 16 Boyle et al. 1994; 17 upper limit by Gensheimer et al. 1995; 18 upper limit by Bowers & Knapp 1987; 19 Fonfría et al. 2006.
– Shocks. An alternative to the mechanism of the gas travelling at constant velocity in the inner envelope is to consider the effect of gas driven by shocks. Molecular abundances are considerably affected by the steep changes in temperature and density associated to the shocks. We follow the approach of Willacy & Cherchneff (1998) but in a more simplistic way. The history of a volume element of gas to reach from after a certain number of shocks is represented in Figs. 2a, 2b and 2c, and is described below . With one shock and subsequent relaxation, the gas moves from a position to () following a harmonic trajectory. The gas in with temperature and density suffers a shock and we assume that the immediately post-shocked gas increases its temperature by a factor 2 and its density by a factor 10 (typical values obtained by Willacy & Cherchneff 1998 from hydrodynamical considerations). Then the gas relaxes its temperature and density exponentially until reaching the new radius (with temperature and density ) in a time interval equal to the period of pulsation of the star . In this way the gas progressively moves outwards until reaching , beyond which an expansion at constant velocity takes place.
2.3. The intermediate and outer envelope
It extends from . The gas expands adiabatically at constant velocity . The molecules in the very outer envelope are no longer shielded by the dust of the CSE against the interstellar UV field, and are then photodissociated. Cosmic rays also play a role ionizing some species.
– The temperature profile is taken from the fit of Mamon et al. (1988) to the results of Kwan & Linke (1982) for the outer envelope of IRC+10216
| (4) |
where is expressed in cm and takes values of 0.72 for 91016 and 0.54 for 91016.
– The density profile is given by the law of conservation of mass:
| (5) |
which, with the values given in table 2.2 and assuming that hydrogen is mostly molecular (2 amu), results in
| (6) |
– The photodissociation rate for a molecule at a radius depends on the UV field at that radius:
| (7) |
where is the UV field at in photons cm-2 s-1 nm-1, is the photodissociation cross section and the integral extends from 91.2 nm (Lyman cutoff) to a threshold value that depends on each molecule. The calculation of each involves the knowledge of the cross section and the solution of the UV radiative transfer for calculating at each radius , which will depend in a first approximation on the amount of dust that surrounds the point . In practice, photodissociation rates are usually expressed in the literature (Le Teuff et al., 2000) for plane-parallel geometry as a function of the visual extinction (in magnitudes) measured along the direction normal to the infinite plane
| (8) |
with specific parameters and for each molecule. For our purposes we have adopted this simple approach just correcting for the geometrical difference from plane-parallel to spherical. The procedure used for such correction as well as the resulting radial profile are detailed in appendix B.
3. The Chemistry
We consider solar elemental abundances (oxygen from Allende Prieto et al. 2001 and the rest from Cox 2000) and assume a C/O ratio of 2. The chemistry in IRC+10216 is dominated by carbon bearing molecules. For carbon chain radicals CnH see Tucker et al. (1974); Thaddeus et al. (1985); Guélin et al. (1978); Cernicharo et al. (1986); Guélin et al. (1987a, 1997); Cernicharo & Guélin (1996). For carbon chain radicals CnN see Wilson et al. (1971); Guélin & Thaddeus (1977); Guélin et al. (1998). For cyanopolyynes HC2n+1N see Morris et al. (1971, 1976); Winnewisser & Walmsley (1978); Bell et al. (1982). For sulfur–carbon chain molecules CnS see Wilson et al. (1971); Cernicharo et al. (1987); Bell et al. (1993). And for silicon bearing molecules SiCn see Cernicharo et al. (1989); Thaddeus et al. (1984); Apponi et al. (1999); Ohishi et al. (1989). However, since we are just interested in oxygen chemistry, in our model we don’t include very long carbon chains but only the 65 neutral molecules given in table 2.2.
As initial abundances for the inner envelope we take those given by LTE at , while for the outer shells we adopt initial abundances for some parent molecules taken from the literature or from a LTE calculation when no data are available (see table 2.2). This procedure is motivated by the processes occurring in the intermediate envelope (specially on grain surfaces) that presumably alter the molecular abundances (hydrides such as CH4, NH3, SiH4 and H2S are supposed to form via such processes).
| Reaction | A | n | C | |
| Important reactions in the INNER envelope | ||||
| R1 | H + H + H2 H2 + H2 | 8.610-33 | -0.60 | 0 |
| R2 | H + H + H H2 + H | 8.810-33 | 0.00 | 0 |
| R3 | H + H + He H2 + He | 6.110-33 | -0.13 | -39 |
| R4 | H2 + H2 H + H + H2 | 8.410-09 | -0.24 | 52043 |
| R5 | H2 + H H + H + H | 8.610-09 | 0.36 | 52043 |
| R6 | H2 + He H + H + He | 5.910-09 | 0.23 | 52003 |
| R7 | Si + CO SiO + C | 1.310-09 | 0.00 | 34513 |
| R8 | SiO + C Si + CO | 1.010-09 | -0.23 | 1291 |
| R9 | C + H2 CH + H | 3.110-10 | 0.16 | 11894 |
| R10 | OH + Si SiO + H | 1.010-10 | 0.00 | 0 |
| R11 | OH + H2 H2O + H | 2.210-12 | 1.43 | 1751 |
| R12 | SiO + CO CO2 + Si | 4.210-13 | 0.67 | 32225 |
| R13 | CO2 + H2 H2O + CO | 3.210-7 | 1.53 | 56906 |
| R14 | OH + CO CO2 + H | 1.210-13 | 0.95 | -73 aak(T80K)=k(T=80K) |
| R15 | O + H2 OH + H | 3.510-13 | 2.60 | 3241 |
| R16 | CO2 + Si SiO + CO | 2.710-11 | 0.00 | 282 |
| Important reactions in the OUTER envelope | ||||
| R17 | O + NH2 OH + NH | 1.210-11 | 0.00 | 0 |
| R18 | O + CH3 H2CO + H | 1.410-10 | 0.00 | 0 |
| R19 | OH + S SO + H | 6.610-11 | 0.00 | 0 |
| R20 | O + SH SO + H | 1.210-10 | 0.00 | -74 cck(T298K)=k(T=298K) |
| R21 | O + NH NO + H | 1.210-10 | 0.00 | 0 |
| R22 | CN + OH NCO + H | 1.410-10 | 0.00 | 0 |
| R23 | S + CH3 H2CS + H | 1.410-10 | 0.00 | 0 |
| R24 | O + OH O2 + H | 1.810-11 | 0.00 | -175 bbk(T167K)=k(T=167K) |
| R25 | O + CH2 HCO + H | 5.010-11 | 0.00 | 0 |
| R26 | 13C+ + 12CO 12C+ + 13CO | 3.410-10 | -0.50 | 1.3 |
| R27 | SiO + C+ Si+ + CO | 5.410-10 | 0.00 | 0 |
| R28 | H + H2 H + H | 2.110-9 | 0.00 | 0 |
| R29 | H + CO HCO+ + H2 | 1.710-9 | 0.00 | 0 |
| R30 | HCO+ + HCN CO + HCNH+ | 3.110-9 | 0.00 | 0 |
| R31 | HCO+ + C2H2 CO + C2H | 1.410-9 | 0.00 | 0 |
| R32 | SiS + C+ SiS+ + C | 2.310-9 | 0.00 | 0 |
| R33 | SiS+ + H SH + Si+ | 1.910-9 | 0.00 | 0 |
| R34 | SiS + S+ SiS+ + S | 3.210-9 | 0.00 | 0 |
| R35 | SiO+ + CO CO2 + Si+ | 7.910-10 | 0.00 | 0 |
| R36 | O + H OH + h | 9.910-19 | -0.38 | 0 |
| R37 | S + CO OCS + h | 1.610-17 | -1.50 | 0 |
| R38 | HCO+ + e- CO + H | 1.110-7 | -1.00 | 0 |
| R39 | H3CS+ + e- H2CS + H | 3.010-7 | -0.50 | 0 |
| R40 | H2CO+ + e- HCO + H | 1.010-7 | -0.50 | 0 |
| R41 | SiO + h Si + O | 1.010-10 | 0.00 | 2.3 |
| R42 | H2O + h OH + H | 5.910-10 | 0.00 | 1.7 |
| R43 | CH4 + h CH3 + H | 2.210-10 | 0.00 | 2.2 |
| R44 | H2 + CR H + e- | 1.210-17 | 0.00 | 0 |
| Reactions not considered in previous chemical models ddSee text for a discussion on these rate constants. | ||||
| R45 | O + H2 H2O + h | 1.010-18 | 0.00 | 0 |
| R46 | HCO+ + H2 H3CO+ + h | 5.010-15 | 0.00 | 0 |
Note. — Rate constants for termolecular and bimolecular reactions are given by k=A(T/300)nexp(-C/T), for photodissociations (h) are given by k=Aexp(-C Av) while for reactions with cosmic rays (CR) are given by k=A. Units are for termolecular reactions, for bimolecular reactions and for photodissociations and reactions with cosmic rays.
| N | Reaction | A | n | C | T1 | T2 | Trange | Ref |
|---|---|---|---|---|---|---|---|---|
| 1 | H + H + H2 H2 + H2 | 8.640E-33 | -0.60 | 0.00 | 50. | 5000. | ALL–T | NIST |
| 2 | H + H + He H2 + He | 6.070E-33 | -0.13 | -39.00 | 77. | 2000. | ALL–T | NIST |
| 3 | H + H + H H2 + H | 8.820E-33 | 0.00 | 0.00 | 50. | 5000. | ALL–T | NIST |
| 4 | CH + He C + H + He | 3.160E-10 | 0.00 | 33704.00 | 2500. | 3800. | LOW–T | NIST |
| 5 | CH + H2 C + H + H2 | 8.830E-10 | 0.00 | 33704.00 | 2500. | 3800. | LOW–T | NIST |
Note. — The full version of table 3 is available in the electronic edition of the Astrophysical Journal.
Different types of reactions dominate the chemistry depending on the region of the CSE considered. The temperatures in the inner envelope are not high enough to make ions abundant but allow for reactions with activations energies of up to a few tens of thousands of K to occur. Therefore, important processes are termolecular reactions, its reverse (thermal dissociation) and bimolecular reactions between neutrals. The outer envelope chemistry is dominated by photodissociations, radical-molecule reactions without activation energy and radiative associations. Although all the species detected in IRC+10216, except HCO+, are neutral, ionic chemistry is necessary to explain the formation of some species. Therefore, when modelling the chemistry in the outer envelope we add 80 ionic species (mainly the positive ions and protonated species of the neutral molecules of table 2.2) and include the subsequent reactions in which they are involved. The rate constants have been taken from different sources: databases such as NIST Chemical Kinetics Database111The NIST Chemical Kinetics Database is available on the World Wide Web at http://kinetics.nist.gov/index.php., UMIST Database 1999 (Le Teuff et al., 2000) and osu.2003 Database (Smith et al., 2004); estimations for reactions involving S– and Si–bearing species from Willacy & Cherchneff (1998); combustion mechanisms such as GRI–Mech (Smith et al., 1999) or the one of A. Konnov (Konnov, 2000); and from a revision of the last published data of rate constants for the type of reactions mentioned above. When no data are available for the whole temperature range studied here (10-4000 K) we have either extrapolated the expression or fixed the rate constant to its value at the nearest temperature for which it is known. When rate constants for reverse reactions were unknown or uncertain, detailed balance has been applied for calculating them from thermochemical properties of the species involved. Photodissociation rates have been taken from the quoted databases when available, or assumed to be equal to those of similar molecules otherwise to ensure that all molecules are dissociated at some radius within the envelope. CO and H2 are known to be affected by self-shielding against interstellar UV photons due to their large abundance. CO photodisssociation rate as a function of radial position is taken from Doty & Leung (1998), who studied the CO case specifically for IRC+10216. For H2 we use the same result correcting for the different unattenuated photodissociation rate.
4. Results and discussion
4.1. Oxygen chemistry in the inner envelope
In this section we (i) first compare the results of chemical kinetics (assuming an expansion at constant velocity of 1 km s-1) with those of chemical equilibrium, (ii) secondly we discuss the effects that SiO depletion from the gas phase could have on oxygen chemistry and (iii) finally we consider the chemistry with shocks.
(i) The densities considered in the inner envelope affect, among other parameters, the H/H2 ratio. Figs. 1b, 1c and 1d show the H2 and H abundances for models MH, MI and ML. The high densities of model MH make the chemical time scale to be lower than the dynamical time scale associated to an expansion at 1 km/s; therefore, reactions R1 to R6
are rapid enough to produce LTE abundances for H and H2. The steep decay in density of model MI makes that at 2 R∗ reactions R1 to R6 become too slow, so that the H abundance is frozen at a value of 510-2. Both models MH and MI allow hydrogen to enter the intermediate shells and outer envelope mostly as H2. Model MI has a low photospheric density and therefore hydrogen exists in atomic form rather than molecular. For larger radii the decrease in temperature makes molecular the most stable form. However, chemical kinetics does not allow for a HH2 transformation and hydrogen enters the outer envelope in atomic form. It is seen how both the density at the photosphere and the density radial profile affect the H/H2 ratio. There are observational constraints about this ratio that suggest that hydrogen is mainly molecular in the CSE (based on an upper limit for the H2 mass in the CSE and on an estimation of the H mass from observations of the 21 cm line, see discussion in Glassgold 1996). This suggests a high density scenario, such as the one of models MH or MI, for the inner envelope.
In what concerns oxygen chemistry, according to chemical equilibrium, for the densities and temperatures prevailing in the inner envelope, almost all the oxygen available in a C-rich gas is locked in CO, with SiO being 2-5 orders of magnitude less abundant. Any other O–bearing molecule has an LTE abundance always below 10-10. But some stellar radii away from the photosphere, where the temperature has decreased below 700 K, the chemical system experiences a significant change and molecules such as H2O and CO2 become very abundant in LTE (see dotted lines in Figs. 3a, 3b and 3c ). This is related to the fact that the most stable form for both carbon and oxygen is the CO molecule in a high temperature regime, whereas for a low temperature regime carbon is preferably locked in CH4 and oxygen in H2O (Tsuji, 2000), as is easily seen from the analysis of the equilibrium constant of this reaction:
| (9) |
which can be fitted by the expression
| (10) |
for a temperature interval of 200-2000 K ( with units of (molecules/cm3)-2). The formation of CH4 and H2O from CO and H2 is exothermic and involves less particles, so according to Le Chatelier’s principle the CH4/H2O mixture dominates over the CO/H2 mixture at low temperatures and high densities. In our case, as temperature decreases so does density. Thus, a total COH2O transformation is only produced for T400 K (r 18 R∗) in model MH (see Fig. 3a) and for larger radii in models MI and ML. Despite a total COH2O transformation takes place beyond 20 R∗, the three models show a considerably increase in the LTE abundance of H2O beyond 10 R∗.
In order to have LTE abundances in the inner envelope, the chemical time scale has to be shorter than the dynamical time scale associated to the expansion for the gas being able to readapt its molecular abundances to the actual physical conditions (temperature and density) as it expands. The situation in the inner envelope of IRC+10216 is such that in the vicinity of the photosphere, but as temperature and density fall with radial distance, chemical reactions become slower and for a certain radio (that depends on the chemical species) . There, molecular abundances ”freeze” and the LTE scenario disappears.
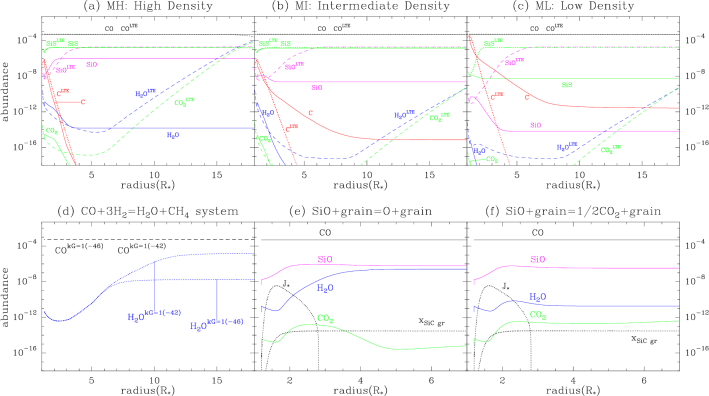
The LTE abundance of CO remains constant from the photosphere to 20 R∗. Thus, whether chemical kinetics is rapid (LTE is reproduced) or slow (”freezing” effect) the CO abundance won’t be modified. The situation is different for SiO (see Figs. 3a, 3b and 3c). Its LTE abundance at is 10-8 while at 3-5 R∗ it increases to 10-5. For this abundance enhancement to occur as the gas expands, SiO has to take the oxygen from CO via reaction R7
which has a low rate and the above considerations about and apply. Only high densities and/or low expansion velocities will make SiO reach this abundance of 10-5. For the three density models considered and the expansion velocity of 1 km/s assumed, only the MH model makes SiO reach an abundance near its LTE value, whereas MI and ML lead to a non-LTE situation in which SiO abundance remains low. The abundance of atomic C has a great impact on SiO. In models MI and ML it remains well above its LTE value while in MH it follows the decreasing LTE profile being destroyed by reaction R9
The H ”freezing” effect of models MI and ML makes the reverse of reaction R9 to proceed at a higher rate that in a LTE situation making C overabundant which, through reaction R8
destroys SiO making it underabundant with respect to a LTE situation. Again a high density scenario is required for explaining the SiO observational abundance of 810-7 (estimated by Keady & Ridgway 1993 through IR ro-vibrational lines) that could be due either to this ”freezing” effect or to depletion on SiC grains after reaching its LTE abundance of 10-5. Neither of the models run made any other O–bearing molecule to have a significant abundance. In this high temperature regime H2O is related to SiO by two routes: (1) competition for OH via reactions R10 and R11
and (2) through CO2, directly via reactions R12+R13
or involving OH which is converted into CO2 via reaction R14
The following scheme shows these relations:
where the connection between the species is produced by the reactions shown above and also by their reverse processes, so we have a reversible system. Nevertheless, these mechanisms are not efficient in producing H2O from SiO. For H2O to take the oxygen from CO the chances are scarce because when the LTE abundance of H2O increases, the temperatures (700 K) make that the possible chemical routes for a COH2O conversion will be too slow due to the large activation energy for breaking the CO bond. At this point, we would like to know if we miss some important reactions, rapid enough for allowing this COH2O transformation in the conditions of the inner envelope of IRC+10216. We consider an scenario given by model MH (high density in order to have a short ) and the chemical reaction given by equation 9. This reaction can be decomposed in several elementary reactions, for example
In any mechanism composed of elementary reactions, the rate of the
global reaction () will be given by the rate of the slowest
elementary reaction (). In this case the slowest elementary
step will be the break of the CO bond, since it has the largest
activation barrier. The number of H2O molecules produced or the
number of CO molecules destroyed in the global reaction, per unit
time and unit volume, is equal to the number of CO molecules
destroyed in the slowest elementary reaction, per unit time and
unit volume. We assign a rate constant for the global
reaction , calculate the reverse rate constant via detailed
balance, and run the model for a CO,H2,CH4,H2O system in
which only the global reaction and its reverse operate. Then
we vary until some significant fraction of CO is transformed
into H2O and CH4. Models for equal to 10-42 and
10-46 cm9 s-1 are shown in
Fig. 3d. It is seen that above a threshold
value of 10-44 cm9 s-1 for , the
COH2O transformation is significant. The rate of
destruction of CO molecules given by reaction is
( is the CO abundance
relative to H2 and is the density of H2) while the rate
of destruction of CO molecules by reaction is
. Since both rates have to be
equal, we arrive to =. Taking 10-44
for and a density of 1010 cm-3 (roughly the value
in the region 10-20 R∗ where the discussed process should take
place) results in =10-24 cm3 s-1. Therefore, we
need a bimolecular reaction similar to reaction with a rate
constant greater than 10-24 cm3 for temperatures
lower than 700 K. There is no data in the literature about a
rate constant for a reaction such as . Nevertheless, we can
estimate an upper limit for if we assume a maximum
temperature independent value of 10-9 cm3 s-1 for the
reverse reaction and apply detailed balance. This results in
activation energies of 80,000 K for , which for
temperatures below 700 K imply rate constants well below
10-24 cm3 s-1. So we don’t expect a chemical route
that is able to convert CO into H2O in the inner envelope
within the gas phase and during an adiabatic expansion.
(ii) Such a COH2O process seems too slow, but there is another O–bearing molecule which locks some important amount of oxygen, i.e. SiO, which is expected to condense onto SiC grains. How could H2O abundance be affected by SiO condensation during the expansion?. When we consider such a process in our model, H2O abundance remains low. The reason is that, as explained above, H2O is related to SiO in such a way that H2O becomes abundant when SiO does, but not when SiO depletes. Then, we consider in model MH (where SiO is formed with a significant abundance) a speculative process that can be summarized as follows: a SiO molecule condenses onto a SiC grain and the Si atom incorporates into the grain lattice while the O atom is released to the gas phase
We assume that 90% of the SiO formed in the gas phase is deposited onto SiC grains and that all that oxygen, formerly contained in SiO, is released to the gas phase as atomic oxygen (see Fig. 3e). It is seen that molecules like H2O and CO2 increase their abundances. H2O takes efficiently the oxygen when it is in atomic form via reactions R15+R11
although some important fraction of the atomic oxygen returns to SiO from OH via reaction R10
and through CO2 via reactions R14+R16
It is known in materials science that oxidation of solid SiC through a flow of O2 at temperatures of 1000 K produces solid SiO2 and also CO and CO2 molecules that diffuse trough the lattice and are released to the gas phase (see Wang et al. 2001 and references therein). Therefore, some fraction of the oxygen entering solid SiC grains begin to build the SiO2 lattice while the rest is released as CO and CO2. In the region of the CSE where SiC grain formation occurs, the temperatures are similar to those described above but the conditions are somewhat different since it is an oxygen-deficient environment. Nevertheless, if SiO depletes on SiC grains, some fraction of the oxygen can be processed in the grain and released as CO and CO2. We have run our model assuming that the oxygen of the SiO depleted on SiC grains is released to the gas phase as CO2 instead of atomic oxygen. Both H2O and SiO compete for the oxygen contained in the CO2 molecules through reactions R13 and R16 respectively
but the high activation energy of R13
prevents water from reaching a high abundance.

(iii) Now we will consider the effect that shocks have on oxygen chemistry. In Fig. 4 we plot the evolution of some abundances as the gas moves along the temperature and density profiles given by model MH (see Fig. 2), in order to compare with Willacy & Cherchneff (1998) who used high density values. We also plot the LTE abundances expected for the temperature and density profiles used, so we can see how the abundances predicted by chemical kinetics deviate from the LTE ones. Within the time interval associated to one shock plus relaxation, the immediately post-shocked gas has dissociated a certain fraction of CO releasing atomic oxygen which has a large abundance during the first stages. This atomic oxygen is progressively returned to CO during the relaxation time, but also to OH which has an appreciable abundance during these first stages. Reaction R11 (OH+H2H2O+H), which forms water from OH, operates, but at these high temperatures the reverse reaction immediately destroys the H2O formed, returning oxygen into OH and some time later into CO. Indeed, shocks are a very good mechanism for dissociating CO and releasing atomic oxygen. This COO process occurs preferably during the first shocks due to the high temperatures, which also make the kinetics of the OH2O process fast but, since water is not thermodynamically abundant at high temperatures in a C-rich gas (it is at low temperatures), other reactions are faster and return the atomic oxygen to CO.
SiO is very affected by the high non-equilibrium chemistry driven by shocks and ends this phase with a very low abundance, mainly due to reaction R8, which was not included by Willacy & Cherchneff (1998). Note that either considering 5 or 15 shocks to reach from , the abundances do not appreciably change. It is shown that this mechanism decreases rather than enhances oxygen chemistry.
Concerning the H/H2 ratio, shocks favor a large value since
H2 is dissociated in the post-shocked gas (due to the high
temperatures reached) and depending on the density it can
regenerate during the relaxation time via the three body reactions
R1, R2 and R3 (with high densities, see
Fig. 2d) or freeze its abundance at some
moment during the relaxation (with low densities, see
Figs. 2e and 2f). Again,
with a shocks mechanism, a high
density scenario is required to have hydrogen in molecular form.
In summary, O–bearing species are not produced efficiently by gas phase chemistry in the inner envelope, neither considering an expansion at constant velocity nor assuming shocks. Nevertheless, the high water abundance obtained under the LTE assumption suggests that grains may be playing an important role in the recycling of oxygen from CO to H2O.
4.2. Oxygen chemistry in the outer envelope
The chemistry in the outer envelope is mainly driven by the photodissociation of molecules by the interstellar UV field followed by rapid neutral-neutral reactions. This mechanism forms species such as polyynes and cyanopolyynes from photodissociation of parent species such as C2H2 and HCN (Millar & Herbst, 1994). Concerning oxygen, the photodissociation of CO occurs at the very outer edge of the envelope due to self-shielding (much further away than the photodissociation of C2H2 and HCN) so atomic oxygen is abundant only at large radii in the CSE, where the density has decreased considerably and reactions are very slow. This fact makes oxygen chemistry to be much poor than carbon chemistry, since oxygen keeps locked into CO along most of the envelope. The inclusion of the isotopologue 13CO, 45 times less abundant than parent CO (Cernicharo et al., 2000), which does not self-shield due to its lower abundance, can enhance O abundance at shorter radii. This allows for the formation of some O–bearing species with moderate abundances through rapid neutral–neutral reactions and radiative associations.
Ionic chemistry is triggered by cosmic rays ionization. Cosmic rays can penetrate deeper than UV photons in the CSE since they are not affected by opacity. Ions can react very rapidly via ion-molecule reactions but the chemistry they can induce is limited by the low abundance of ions in the CSE except at the very outer edge (where for example all the carbon is converted into C+). In our model, ionic chemistry does not noticeably affect the abundances of the O–bearing species formed except for SO, whose abundance is greatly enhanced, and for HCO+, produced with a low abundance but enough for being detected due its large dipole moment (4.07 D). Another important effect of ionic chemistry is the fractionation of CO through the exchange reaction R26
which is known to be exothermic by 35 K. Below this temperature the reverse reaction does not operate and 12CO is effectively transformed into 13CO. The net effect is a delay in the destruction of 13CO: its abundance remains nearly constant due to a steady state in which it is formed by the mentioned exchange reaction while it is destroyed by UV photodissociation.
The abundances predicted in the outer envelope for CO, 13CO, O, SiO and HCO+ (usual O–bearing species in a C-rich star) are shown in the left part of Fig. 5 . The second column of panels show the abundances predicted for H2O, OH and H2CO (the three ”unexpected” oxygen species), while the rest of panels to the right show the abundances for some other O–bearing species. H2CS abundance distribution is also shown together with those of C2H and CN, peaking at 15” and 20” respectively (see appendix B). We now describe individually the reactions that lead to their abundances, which are expressed relative to total number of hydrogen nuclei rather than relative to H2:
– SiO is formed in the inner envelope and its abundance remains nearly constant throughout the outer envelope until it is dissociated by UV photons (R41). Ionic chemistry destroys SiO at a shorter radius by reacting with C+ via R27
However, we point out that SiO could enter the outer envelope with a much lower abundance due to condensation on grain surfaces.
– HCO+ is produced by the same sequence of reactions that forms it in dark clouds.
First, H2 is ionized by cosmic rays (R44), then H reacts with H2 producing H (R28), which in turn reacts rapidly with CO through a proton transfer reaction (R29). The origin of HCO+ is different with respect to the rest of oxygen bearing species commented in this section because its formation does not require the photodissociation of CO but the presence of H, the formation of which is related to cosmic rays. HCO+ is abundant at shorter radii than the rest of O–bearing species with a peak abundance of 4.510-10 at 31016 cm, and a corresponding column density of 1.11012 cm-2. The abundance profile sharply falls after its peak mainly due to dissociative recombination R38 (electron density becomes important beyond 51016 cm) and to a less extent, due to proton transfer with HCN and C2H2 (reactions R30 and R31 respectively).

– H2O formation in C-rich environments, where atomic oxygen is available from the photodissociation of CO, is possible through the route of reaction R15 followed by reaction R11.
This is the mechanism that forms water in the C-rich protoplanetary nebula CRL618 (see Cernicharo 2004), where temperatures in the inner slowly expanding envelope are 300 K. However, in the outer envelope of IRC+10216 such high temperatures are not expected and this route does not work, since both reactions R15 and R11 have activation energies that result in negligible rates. In our model, water forms through the radiative association between atomic oxygen and molecular hydrogen (R45).
To our knowledge, neither experimental nor theoretical studies have made an estimation of this rate. We have assumed a temperature independent rate constant of 10-18 cm3 s-1, typical of radiative associations between neutral species. Reaction R45 implies breaking the H2 bond so that atomic oxygen can insert in, which will result on some activation energy. However, similar reactions, e.g. H2+C (Le Teuff et al., 2000) and H2+CH (Brownsword et al., 1997) take values 10-17-10-18 cm3 s-1. Water is produced over an extended region from 41016 to 61017 cm with a peak abundance of 10-10 and a column density of 41011 cm-2. These values are far below the abundance estimated from the observations of SWAS (2-1210-7, Melnick et al. 2001) or ODIN (1.210-6, Hasegawa et al. 2006) by at least three orders of magnitude. We will discuss in §4.3 if water originated in this way can or cannot explain the observations.
– OH is produced from the photodissociation of water (R42) and from atomic oxygen through both the bimolecular reaction R17
and the radiative association between O and H (R36). As the gas expands, reaction R36 becomes slower due to the decrease in density although it is compensated by the increase in atomic oxygen abundance. The result is an increase of OH abundance only at the very outer envelope, shown in Fig. 5 as a peak at 61017 cm. In fact, the O–bearing molecules formed by radiative associations show an extended distribution (reactants such as atoms increase their abundances while expanding) whereas those formed by bimolecular reactions show a peak distribution (reactions only proceed in a shell where reactants are abundant before they are photodissociated). OH could also be produced in reactions of O with several abundant hydrocarbons (e.g. CnH2, CnH, HC2n+1N) through H abstraction. However, the reactions of atomic oxygen with closed-shell species such as C2H2, C4H2 and HCN have activation barriers whereas in reactions with radicals the H abstraction channel seems to proceed slowly. For example, the reaction O+CHC+OH has been studied by Murrell & Rodriguez (1986) who estimated a negligible reaction rate at low temperatures while the reaction of O with C2H produces mainly CO and CH. OH is predicted with a very extended distribution from 41016 to 1018 cm with a peak abundance of 710-10 at the very outer edge and a column density of 21011 cm-2. Ford et al. (2003) have derived an OH abundance of 410-8 assuming that all OH is produced from the photodissociation of H2O, which is formed through comet evaporation in the inner envelope. The spatial distribution they obtain ranges from 31016 cm to 71016 cm. If OH follows the more extended radial distribution calculated by us, then the beam filling factors and physical conditions of the emitting gas are very different from those assumed by Ford et al. (2003) and we could expect a considerable decrease of the OH estimated abundance.
– H2CO is produced through reaction R18
the source of CH3 being the photodissociation of CH4 (R43) while atomic oxygen is provided by CO and 13CO photodissociation. The rate for R18 is well known for a temperature range of 259-2500 K in which it does not show a temperature dependence, suggesting a similar value at low temperatures. The peak abundance is 1.410-9, reached at 41016 cm. The abundance derived by Ford et al. (2004) from millimeter observations of pure rotational transitions is a factor 5 higher than the one we get with the model. We discuss in §4.3 the compatibility of the abundance predicted by our model with the lines observed.
– SO can be formed from OH+S (R19) and from O+SH (R20).
For R19 we take the rate constant measured at 298 K. The rate of reaction R20 has been measured at 298 K and at high temperatures (1100-2000 K) and does not show temperature dependence, so that we assume the same value at low temperatures. In our model the abundance of OH is low in most of the CSE. On the other hand, SH abundance is relatively high due to a sequence of ion-molecule reactions that begin with the charge transfer of C+ to SiS (R32). The SiS+ formed this way reacts with H via reaction R33 and produces SH.
The peak abundance predicted for SO is 1.110-9 with a column density of 4.71011 cm-2. However, we point out that SO abundance is greatly influenced by H abundance, for which we have taken an upper limit given by Bowers & Knapp (1987). A process of H2 formation on grains surfaces, not considered in this model, could reduce the abundance of atomic H, thus decreasing the amount of SO in the outer envelope.
– OCS forms by radiative association of S and CO (R37). The predicted peak abundance is 610-12 with a quite low column density of 7.4109 cm-2.
– NO is formed by the bimolecular reaction R21 involving atomic oxygen and NH, which in turn comes from photodissociation of NH3.
The rate for this reaction is a temperature independent estimation for the 250-3000 K range and is assumed to apply also at low temperatures. The predicted abundance is 210-10 with a column density of 21011 cm-2, although its low dipole moment (0.159 D) makes difficult its detection.
– NCO forms by reaction R22 the rate of which is based on an experimental measurement at low pressure and 292 K and the assumption that formation of NCO is the main channel.
Its predicted abundance is 10-11. The relatively low dipole moment (0.6 D), the large partition function and the low predicted abundance will make very difficult its detection.
– H2CS abundance is also shown in Fig. 5. Although it is not an O–bearing species, it is formed through the sulfur analogous reaction that forms H2CO (R23).
The rate of this reaction has not been measured and therefore it is assumed equal to the oxygen analogous case. Atomic sulfur is necessary, instead of oxygen, and it is provided by the photodissociation of SiS and CS. Ionic chemistry slightly enhances H2CS abundance since atomic S is released at short radii through ion-molecule reactions such as R34
and because more chemical routes for thioformaldehyde formation appear, e.g. from H3CS+ through dissociative recombination (R39).
The peak abundance is 10-9 with a distribution similar to that of formaldehyde. The predicted abundance profile produces line shapes in reasonable agreement with observations (see below).
– CO2 is formed through reaction R35, which involves SiO+ that is formed with an abundance of 10-11 from several ion-molecule reactions.
We point out that CO2 could be also a product of evaporation of cometary ices and will have a large abundance in the cometary scenario. However, an ISO spectrum of IRC+10216 in the mid-infrared with a very large signal-to-noise ratio (Cernicharo et al., 1999) only shows C2H2 and HCN lines in the 13-16 m range and no evidence for CO2.
– O2 formation is strongly related to the presence of OH from which is formed through reaction R24.
Its spatial distribution follows that of OH with an abundance 2 orders of magnitude smaller.
– HCO is produced with a quite low abundance (10-12) mainly from atomic oxygen by reaction R25.
Dissociative recombination of H2CO+ (R40) also contributes to HCO formation.
4.3. Comparison with observations
In order to compare with available observations we have performed Monte Carlo radiative transfer calculations for H2CO, H2O, HCO+, SO and H2CS with the code described in González-Alfonso & Cernicharo (1993). The CSE has been simulated by a spherically distributed expanding gas with the radial profiles for density, temperature and abundance of each species taken from the chemical model. Line profiles and intensities for several transitions are then generated after convolution of the radiative transfer results with the main beam of the selected telescope.

– H2CO. Ford et al. (2004) have observed four pure rotational lines of ortho-H2CO: (140.840 GHz), (150.498 GHz), (211.211 GHz) and (225.698 GHz) with antenna temperatures of 30 mK, 20 mK, 20 mK and 20 mK respectively; one line of para-H2CO: (218.222 GHz) with 20 mK; and failed to detect the low excitation transition of para-H2CO (72.838 GHz) at a sensitivity of 10 mK. They also conducted 17” offset observations for the line with an average line intensity reduced by a factor 3-4, which nevertheless indicates an extended H2CO distribution. We have used the abundance profile obtained from our chemical model to predict the expected line intensities in order to see if the formaldehyde formed through these chemical routes can account for the observed lines. The collisional coefficients, needed for solving the statistical equilibrium, are taken from Green (1991) (corrected for H2 as collider instead of He) and the normal ortho-to-para ratio of 3:1 has been assumed.
The resulting lines are less intense than the observed ones by a factor 4-10 depending on the line. Nevertheless, one has to keep in mind that the abundances resulting from such a simple chemical model are affected by uncertainties due to missing reactions, uncertain rates and also errors in physical parameters (kinetic temperature, mass loss rate, etc). Formaldehyde is formed from O and CH3 by reaction R18
so the abundances of the two reactants together with the rate of R18 directly affect the abundance that H2CO may reach. The rate constant for reaction R18 is known down to 259 K, but not for the much lower temperatures that are present in the outer envelope of IRC+10216. We could expect a higher rate constant at very low temperatures, a behavior experimentally observed in many other radical-molecule reactions without activation energy (see Smith et al. 2004 and references therein). Another important parameter is the branching ratio for CH3 production in methane photodissociation by the interstellar UV field, for which Le Teuff et al. (2000) give a 15%. For the solar UV field values up to 44% are commonly used (see the chemical model of Saturn’s atmosphere by Moses et al. 2000). Although the energy distribution of the interstellar and solar UV field are somewhat different, we could expect larger uncertainties in the former one. When we increase R18 rate constant by a factor of 3 and the CH3 branching ratio by a factor of 2, the resulting H2CO abundance (see solid line in right-down panel of Fig. 6 ) increases by a factor of 6 with respect to the former model (that of Fig. 5). A comparison of the spectral lines resulting from such abundance profile with the lines observed by Ford et al. (2004) give us several conclusions: (1) the line intensities agree quite well for the ortho-H2CO lines whereas for the para-H2CO the agreement is worse: the 72.838 GHz line is predicted a factor 3 more intense than the observed upper limit and the 218.222 GHz line is predicted a factor 2-3 less intense than the observation. Uncertainties in the collisional coefficients, ortho-to-para ratio or in the temperature and density profiles used could explain the discrepancies between model and observations. (2) The ratio of the integrated intensity between the 17” offset position to the centered one in the 150.498 GHz line is 0.87, in contrast with the value of 0.4 obtained from the observations. Sources for the disagreement can be errors in the pointing, the uncertainty in the distance to the star or the depart from spherical symmetry in H2CO emission. (3) One last aspect to point out is the different shapes of the observed and predicted 1.3 mm lines of ortho-H2CO (at 211.211 and 225.698 GHz). The predicted lines have pronounced double-peaked shapes with almost no emission at zero velocity, as corresponds to a shell with a certain size (diameter of 40” in the model) observed with a smaller telescope beam (11” for IRAM-30m at those frequencies). On the other hand the observed lines show substantial emission at zero velocity and a less pronounced double-peaked profile. Neither an error of up to 4” in the pointing observations nor a larger distance to the star of up to 200 pc (more will make IRC+10216 to be overluminous for its type according to Crosas & Menten 1997) will appreciably change the predicted line profiles.
Ford et al. (2004) interpret the presence of formaldehyde as a direct product from the photodissociation of an unknown parent molecule released in the inner envelope by cometary sublimation. Such interpretation is supported by the observation of extended emission of formaldehyde toward the comet P/Halley (Meier et al., 1993). Ford et al. (2004) constructed a simple model with the following parameters: initial abundance of the parent species relative to H2 of 810-8, unattenuated photodissociation rate of the parent species producing H2CO of =1.610-10 s-1 and unattenuated photodissocation rate of formaldehyde =7.8110-10 s-1, which reproduced the observed line intensity of the 150.498 GHz line and the ratio ()/() of 0.4 for this line. We have run a model with the same parameters to obtain the abundance distribution and the expected line profiles (light dotted lines in Fig. 6). It is seen that the abundance distribution is more extended than the previous one although the 1.3 mm line profiles of ortho-H2CO still show an emission at zero velocity too low compared with the observations. The abundance distribution of H2CO with a cometary origin is somewhat similar to the one we get with the chemical model, because in both cases formaldehyde is produced in the region where interstellar UV photons penetrate.
From the above considerations it follows that an increase of the formaldehyde abundance in the inner regions of the CSE is needed for producing some emission at zero velocity and matching the observations. Formation of H2CO in inner regions can be explained by hydrogenation of CO on grain surfaces followed by photodesorption (species such as CH4, NH3 and H2S are thought to be formed by similar processes). Since this possibility is very complex to model, we have investigated if some missing gas phase reactions can enhance formaldehyde abundance at short radii. At this point it is worth to note that HCO+ has an abundance distribution peaking closer to the star than the one of H2CO (see Fig 5) and that produces double-peaked spectral lines but with substantial emission at zero velocity (see Fig. 8 ). As discussed for HCO+ formation, ionic chemistry is initiated by cosmic rays at shorter distances than photochemistry does since the CSE is not opaque to cosmic rays. Formaldehyde can also be formed from H2CO+ (through charge transfer with several species) and H3CO+ (through dissociative recombination) but in our model these routes are not important since both H2CO+ and H3CO+ are not abundant enough. Looking at exothermicity we can examine possible missing reactions that can contribute to the formation of these two species (heats of formation have been taken from NIST Chemistry Webbook222The NIST Chemistry Webbook is available on the World Wide Web at http://webbook.nist.gov/chemistry/. and Le Teuff et al. 2000). One possibility is the reaction H+CO for which the only exothermic channels are the well known proton transfer giving HCO+ and the radiative association which produces H3CO+. Another possibility is the reaction HCO++H2 but all the investigated channels are highly endothermic due to the high stability of both reactants and only the radiative association producing H3CO+ is exothermic by 123 kJ/mol. We find that including the reaction HCO++H2 H3CO++h with a rate constant of 510-15 cm3 s-1 (R46), the formaldehyde abundance is enhanced at the inner regions producing rotational lines in agreement with the observations, i.e. with significant emission at zero velocity (strong dotted lines in Fig. 6). All the lines except the one at 218.222 GHz of para-H2CO (predicted a factor 2 less intense than observed) agree very well with the observations in intensity and profile. The required rate constant is typical of other ion-neutral radiative associations (Le Teuff et al., 2000).
Finally, is it worth to note that three of the four unidentified
lines in Ford et al. (2004) can be assigned as follows: U150 is the
71,7-61,6 transition of Si13CC at 150385.281 MHz
(Cernicharo et al., 1991, 2000); U218b is the =23-22 =45/2-43/2
transition of CC13CCH at 218103.281 MHz (Cernicharo et al., 2000); and
U218a is one component of the =45/2-43/2
transition in the =1 vibrational state of C4H at
218287.460 MHz
(Guélin et al., 1987b; Yamamoto et al., 1987; Cernicharo et al., 2000).
– H2O. The evidence for water presence in IRC+10216 comes from the detection of the ortho transition 11,0-10,1 at 556.936 GHz with the telescopes SWAS (20 mK, Melnick et al. 2001) and ODIN (50 mK, Hasegawa et al. 2006). In order to model the radiative transfer of water throughout the CSE we consider the lowest lying 8 rotational levels in the vibrational ground state level (,,)=(0,0,0), in the first excited bending mode (0,1,0) and in the first excited asymmetric stretching mode (0,0,1). The ortho-H2O–He collisional rates from Green (1993), corrected for H2 as collider, are adopted for all the transitions within the same vibrational level, whereas for ro-vibrational transitions collisions are not considered important.
Excitation to the =1 state occurs by absorption of 6 m photons whereas excitation to the =1 state corresponds to 3 m. Photons at these two wavelengths are abundant within the CSE due to the presence of the central star and dust, so these excited vibrational levels can be easily populated. Furthermore, since our chemical model predicts water to be abundant in the outer CSE, where densities range from 105 to 102 cm-3 (ncrit109 cm-3 for the 556.936 GHz transition), collisional excitation is not effective to populate the 11,0 state and the dominant excitation mechanism is radiative pumping to the =1 and =1 vibrational excited states followed by radiative decay to several rotational levels of the vibrational ground state, included the 11,0 state.

In our chemical model water is formed through the radiative association R45
with an assumed rate constant of 10-18 cm3 s-1. As noted in §4.2, the abundance reached with such a rate constant is not enough to explain the observed 556.936 GHz line. Since the rate constant for this reaction is not known and water abundance approximately scales with this rate, we have fitted R45 rate to get a 556.936 GHz line intensity in agreement with the observations. We find that it is necessary to increase the rate constant up to 10-15 cm3 s-1. The peak abundance obtained then is 10-7 as shown in Fig. 7 . With such an abundance profile, we have performed Monte Carlo radiative transfer calculations. We show in Fig. 7 the lines predicted for ODIN in different scenarios in which the fluxes at =3 and 6 m vary. On the left side the central star has been considered as a blackbody at = with and without dust throughout the CSE. We consider carbonaceous grains with sizes between 0.01 and 1 m and a gas-to-dust mass ratio of 500 (Knapp, 1985). It is seen that the presence of dust enhances the 557 GHZ line intensity since grains absorb the photons from the star (its maximum is at =2 m) and reemits at longer wavelengths, thus enhancing the flux at =6m and exciting the bending mode of H2O. In fact, the IR spectrum of IRC+10216 as observed by ISO (Cernicharo et al., 1999) peaks at 10 m due to the presence of dust and approximately corresponds to a blackbody of radius 20 R∗ with a temperature of 500 K. We can therefore simulate the IR flux that water in the outer envelope would receive by putting such a blackbody instead of the star. In Fig. 7 we see how the 556.936 GHz line intensity increases when the flux at 6 m is enhanced by considering a blackbody with increasing temperature. These radiative transfer models show the importance of the IR pumping of the excited vibrational levels of H2O for the intensities of pure rotational lines in the ground vibrational state.
In summary, assuming a rate constant of 10-15 or a few 10-16 cm3 s-1 for R45 we can reproduce the water line observed by ODIN. Now the question is how reasonable is such a high rate constant for a radiative association between neutrals. This reaction is spin-forbidden according to Wigner-Witmer rules since the potential energy surfaces (PES) of reactants and products in their ground electronic states, H2(1)+O(3P)H2O(1A)+h, are not connected adiabatically. For the reaction to proceed, an intersystem crossing between PES with different total electronic spin has to occur during the reaction. A spin-forbidden reaction is likely to have a small rate constant, however some other reactions in which reactants and products do not adiabatically correlate have been found to be very rapid. For example the bimolecular reaction: C(3P)+C2H2(1)C3(1)+H2(1) may have a rate constant of several 10-10 cm3 s-1 at very low temperatures (Clary et al., 2002) while the radiative association HS+(3)+H2(1)H3S+(1A)+h has a rate constant of 710-16 cm3 s-1 at 80 K (Herbst et al., 1989).
A high rate constant for reaction R45 would also have consequences for the chemistry in dark clouds. If kR45=10-15 cm3 s-1, and with a typical density of 104 cm-3, the chemical time scale to produce water from atomic oxygen would be as short as 3103 years. Chemical models without this radiative association predict H2O abundances somewhat higher than the observational upper limits imposed by SWAS (Roberts & Herbst, 2002). Nevertheless, depletion on grains at late times would reduce the water vapor abundance so that models could match the observations. In diffuse clouds, with lower visual extinctions (1) and densities (100 cm-3), reaction R45 would also produce water in time scales of 3105 years, with an abundance relative to H2 of 310-7 in steady state333The H2O abundance reaches the steady state when the formation and destruction rates become equal. If we assume that reactions R45 and R42 are the main formation and destruction routes, then (H2O)/(H2) = [ ]/[ 5.910-10 exp( )], where is the O abundance relative to H2 and is the UV field relative to the interstellar standard one (see appendix B). If we take =1, =1, =610-4, =10-15 cm3 s-1 and (H2)=/2=100/2 cm-3 (assuming hydrogen is mainly molecular), we get (H2O)/(H2) = 310-7.. This value is 1–2 orders of magnitude higher than the scarce observational estimations available (Spaans et al., 1998; Neufeld et al., 2002). Nevertheless, in diffuse clouds a significant fraction of hydrogen is not in molecular form, therefore the rate of water formation through reaction R45 would be lower than our estimation. Furthermore, since the observations of interstellar water ice bands do not discriminate between different types of clouds, dense or diffuse, present along the line of sight (e.g. Schutte et al. 1998; Moneti et al. 2001), it is highly uncertain whether the amount of water as solid ice is important or not.
There are other clues, apart from the 557 GHz line, that will help
in understanding the water origin in this late-type C-rich star:
(1) If water is formed in the outer envelope it will have a
spherical shell-like distribution while Fischer-Tropsch and
cometary hypotheses will produce a solid sphere-like distribution
since both require water to be formed much closer to the star.
Herschel Space Observatory will be able to distinguish between
these two possibilities since its beam size will be much narrower
than those of SWAS and ODIN. (2) The absence of pure rotational
and ro-vibrational lines of water in the ISO far-IR spectrum
analyzed by Cernicharo et al. (1996) discards the presence of a
significant amount of water in the inner envelope. (3) As noted by
Rodgers & Charnley (2002), the cometary origin implies the presence of HDO
with an abundance 0.06 % relative to H2O. HDO detection
would demonstrate that water is not formed from material ejected
by the star and the cometary hypothesis would be the only one
reasonable.

– HCO+. Its presence in IRC+10216 has been debated for years. Chemical models (Glassgold et al., 1986) predicted it with an abundance high enough to allow its detection with available millimeter or submillimeter telescopes. On the other hand, observations did not clearly probe its existence. The =1-0 line (with an intensity of =20 mK with the IRAM 30m telescope, see Fig. 8) often has been observed as a weak feature at the noise level (Lucas & Guélin, 1990). The =4-3 line was observed as a weak feature of 25 mK with the JCMT telescope by Avery et al. (1994). However, they failed to detect the =3-2 line at a noise level of 10 mK, which was predicted with 45 mK on the basis of a rotational temperature of 17 K obtained from the intensities of the =1-0 and =4-3 lines. These considerations led these authors to conclude that the feature at the =4-3 frequency was not arising from HCO+ and they calculated an upper limit for its column density of 1.41011 cm-2. Our Monte Carlo radiative transfer calculations show that the excitation temperatures of each line are significantly different, thus a prediction of the expected intensities of other lines with a unique should be taken with care. To calculate the line profiles of HCO+ we have decreased by a factor of 2 the abundance profile obtained with the chemical model in order to match the observed =1-0 line. HCO+ is formed through the sequence of reactions R44+R28+R29 and therefore its abundance depends basically on the rates of these reactions as well as on the destruction rates. The most uncertain of all of them is the ionization by cosmic rays of H2 (R44), which depends on the cosmic rays field in the surroundings of IRC+10216. The abundance of HCO+ approximately scales with R44 rate. Therefore, a decrease by a factor of 2 in the cosmic rays field would explain the decrease in abundance needed to match the =1-0 observed line.
The predictions for the first four pure rotational transitions are
shown in Fig. 8. It is seen that the excitation
conditions are such that the =3-2 line is expected with a
slightly higher intensity than the =4-3 line, both being
10 mK in for the JCMT telescope. This suggests that
the 25 mK feature observed by Avery et al. (1994) at the frequency of
=4-3 is indeed not arising from HCO+ because the =3-2 was
not detected above a 10 mK noise level. Future long
time-integrated observations of these two lines will definitively
establish the excitations conditions of HCO+ in IRC+10216.
– SO. The abundance reached by SO in the chemical model
is enough to produce some lines with intensities of a few mK.
Fig. 8 shows the =23-12 and
34-23 expected line intensities together with a feature at
99.300 GHz of a spectrum, obtained with the IRAM 30m telescope
(Cernicharo et al., 2006), which could correspond to the 23-12
transition. A higher signal-to-noise ratio for this spectrum is
needed to claim detection. Long time-integrated observations at
the frequencies of other SO transitions (e.g. the 34-23)
would decide about the existence of SO in IRC+10216 formed trough
the ion-molecule chemical sequence of R32+R33
followed by the neutral-neutral reaction R20.
– H2CS. The chemical model predicts that this molecule is produced with a moderate abundance, both through neutral chemistry (from S+CH3, R23) and through ionic chemistry (from H3CS+, R39). The abundance reached is within the same order of magnitude than for H2CO, but less intense rotational lines are expected due to its smaller dipole moment (1.649 D versus 2.331 D of formaldehyde). We have also assumed an ortho-to-para ratio of 3:1. Fig. 8 shows the expected line profiles of ortho and para H2CS, together with some features from a 3 mm spectrum taken with the IRAM 30m telescope (Cernicharo et al., 2006). The features have intensities somewhat higher than the predicted ones, but with the right order of magnitude.
5. Conclusions
LTE chemical models predict that O–bearing species such as water are very abundant in the inner envelope of IRC+10216. However, a more realistic non-LTE approach, based on chemical kinetics, indicates that the transformation of CO into H2O within the gas phase is not efficient in the inner layers, because of the high energies required to break the CO bond. On the other hand, the increase of SiO abundance with radius, predicted in LTE, is possible because the reaction Si+COSiO+C is competitive in a high density scenario for the inner envelope. An alternative mechanism for water production out of the gas phase could be related to grain surfaces, which can act as a catalyst reducing the activation energy for either a COH2O process (due to Fischer-Tropsch catalysis according to Willacy 2004) or a SiOH2O process (on SiC grains).
Concerning oxygen chemistry in the outer envelope, the release of atomic oxygen due to CO photodissociation allows for the formation of some O–bearing species. The abundance predicted for H2CO is a factor 5 lower than the observational estimation of Ford et al. (2004). Wether formaldehyde is formed by the reaction O+CH3H2CO+H or it is produced from photodissociation of an unknown parent species released from comets, as suggested by Ford et al. (2004), the expected shape of the 1.3 mm rotational lines disagrees with the observations. An alternative source of H2CO is suggested to be the radiative association HCO++H2H3CO++h. The possibility of forming water in the outer envelope depends on the rate constant of the radiative association between atomic oxygen and molecular hydrogen. Non-local radiative transfer models show that a rate constant as high as 10-15 cm3 s-1 is needed to reproduce the 556.936 GHz line profile observed by SWAS and ODIN telescopes. Quantum chemical calculations of the rate constants of the two radiative associations suggested in this paper, specially the H2+O reaction, could support or discard them as important reactions in astrochemistry.
Other oxygen bearing species such as SO could exist with abundances and excitation conditions which would produce rotational lines near the detection limit of IRAM-30m telescope. HCO+ is observed with an intensity roughly in agreement with that predicted from chemical and radiative transfer models. Thioformaldehyde formation is also predicted through a chemical route analogous to that of formaldehyde. This is supported by the agreement of the line profiles obtained from radiative transfer models with observations at 3 mm.
Although the evaporation of cometary ices could be the source of water in this late–stage carbon star, other phenomena such as catalysis on grains or the production in the outer envelope through the radiative association of H2+O could also explain the formation of this O–bearing species in the expanding carbon-rich envelope. Future observations with the Herschel Space Observatory will permit to distinguish the most plausible chemical processes leading to the formation of water vapor in a carbon-rich environment.
Appendix A Nucleation and Growth of SiC grains
Here we describe the formation of SiC grains in the inner envelope of IRC+10216 as a two-step process: (1) formation of condensation nuclei plus (2) growth of grains from these nuclei by accretion of gas phase species.
(1) The mathematical description of the nucleation process is mainly taken from Gail et al. (1984). We assume that the expanding gas has at all moments a population of clusters (SiC)N, composed of different number of SiC monomers, which in thermal equilibrium is given by
| (A1) |
where means numerical density, is the grain temperature and is the free energy of formation of a cluster of size from the monomers. The temperature of SiC grains is not equal to the kinetic temperature of the gas because the former is affected by an inverse greenhouse effect which makes to be less than (McCabe, 1982). To calculate we follow the treatment of this author. The magnitude can be expressed as
| (A2) |
where is the supersaturation ratio (ratio of the SiC vapor pressure to its saturation pressure) that is calculated following McCabe (1982), and the magnitude (described in Draine 1979) is related to the surface tension of solid SiC for large while for low is treated as a free parameter since it is unknown.
Once we have establish a population of clusters (SiC)N given by thermal equlibrium, nucleation theory says that there exist one critical size . Cluster with sizes will continue accreting growth species (here SiC molecules) resulting in grains of growing size, while clusters with sizes will revert to the monomers. Thus, there exists a bottleneck at in the size spectrum. The critical size is found by maximization of with respect to . The steady state rate for the transformation ’(SiC)nucleus’ is given by
| (A3) |
The subscript refers to the growth species: is the numerical density, the mass, the sticking coefficient, and the sum of all contributions has the meaning of a flux of particles. The subscript refers to critical clusters: is the surface area and is the radius of a monomer in the SiC lattice. is the Zeldovich factor (see Section 2 of Gail et al. 1984 for a detailed explanation).
Once is computed for the conditions prevailing at each radius, the temporal evolution of the nucleation rate is obtained from just considering a time lag (see Gail et al. 1984)
| (A4) |
(2) The growth of grains occur by addition of species that incorporate into the grain, resulting in a temporal evolution for the grain radius of
| (A5) |
where the sum extends to all gaseous species that produces growth of grains (here only SiC molecules are considered). The parameters and have the same meaning as in equation A3, is the radius of the species in the lattice and is the number of monomers of type forming part of a grain.
Appendix B Visual Extinction Radial Profile
The parameters and in equation 8 are usually given in the literature for plane-parallel geometry. Therefore, the evaluation of the photodissociation rate of a species through equation 8 is only valid for a species situated at point P in a plane-parallel layer (see Fig. 9 ), where the visual extinction measured along the direction perpendicular to the infinite plane is . But we want to know at the different points in spherical geometry. The strategy, then, is to find expressions for the UV field () at points and in plane-parallel and spherical geometries respectively. Equaling both expressions we will determine the associated A, that we will insert in equation 8.
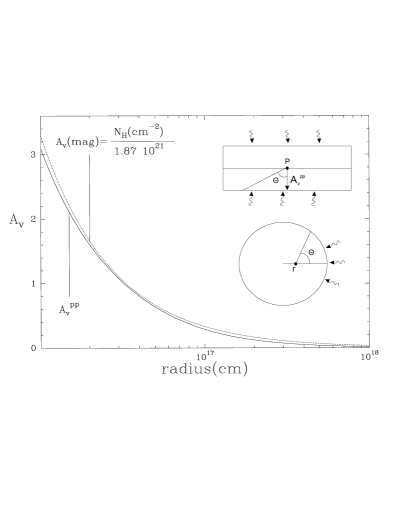
The UV field at point in a constant density plane-parallel layer is given by
| (B1) |
where is the wavelength integrated specific intensity of the interstellar standard UV field (Draine, 1978) (i.e. in photons cm-2 s-1 sr-1), is the angle of the considered direction with respect to the normal to the surface. The UV opacity has been expressed as a function of the visual extinction through the ratio of UV–to–visible opacities (/), where the subscript stands for the mean wavelength in .
The UV field at point within a sphere with a density law is
| (B2) |
where it is necessary a boundary condition, e.g. the UV optical depth at point along the radial direction.
We have assumed (=1016)=12.7 (Doty & Leung, 1998), although the opacity at UV wavelengths is highly uncertain for IRC+10216, and a () ratio of 3.1 as measured by Rouleau & Martin (1991) for amorphous carbon grains of 0.05 m, although different values up to 8 can be found in the literature depending on grain nature and size. The radial profile obtained is shown in Fig. 9 where it is compared to the standard relation found for the interstellar medium by Bohlin et al. (1978). The interstellar UV field has been decreased by a factor 2 with respect to the standard to make the abundance distributions of C2H and CN (photodissociation products of C2H2 and HCN respectively) to peak at 15” and 20” respectively in agreement with interferometric observations (Dayal & Bieging, 1995; Guélin et al., 1999). For our assumed distance of the star (150 pc) C2H peaks at 3.41016 cm and CN at 4.51016 cm (see Fig. 5). We point out that this procedure is affected by a degeneracy between at least two parameters: the star distance, which transforms radial distances to angular distances, and the UV field and/or the radial profile, which make molecules photodissociate at a shorter or larger radial distance. Despite the uncertainties in the knowledge of these quantities, and even if our assumption of a less intense UV field than the standard is not correct, the abundances of the different molecules will be predicted at the right angular positions.
References
- Allende Prieto et al. (2001) Allende Prieto, C., Lambert, D., L., & Asplund, M. 2001, ApJ, 556, L63
- Apponi et al. (1999) Apponi, A., J., McCarthy, M., C. et al. 1999, ApJ, 516, L103
- Avery et al. (1994) Avery, L., W., Bell, M., B., et al. 1994, ApJ, 426, 737
- Bagnulo et al. (1995) Bagnulo, S., Doyle, J., G., & Griffin, I., P. 1995, A&A, 301, 501
- Bell et al. (1982) Bell, M., B., Feldman, P., A., et al. 1982, Nature, 295, 389
- Bell et al. (1993) Bell, M., B., Avery, L., W., & Feldman, P., A. 1993, ApJ., 417, L37
- Bohlin et al. (1978) Bohlin, R., C., Savage, B., D., & Drake, J., F. 1978, ApJ, 224, 132
- Bowen (1988) Bowen, G. H. 1988, ApJ, 329, 299
- Bowers & Knapp (1987) Bowers, P., F., & Knapp, G., R. 1987, ApJ, 315, 305
- Boyle et al. (1994) Boyle, R., J., Keady, J., J., et al. 1994, ApJ, 420, 863
- Brownsword et al. (1997) Brownsword, R., A., Sims, I., R., et al. 1997, ApJ, 485, 195
- Cernicharo et al. (1986) Cernicharo, J., Kahane, C., et al. 1986, A&A, 164, L1
- Cernicharo et al. (1987) Cernicharo, J., Guélin, M., et al. 1987, A&A, 181, L9
- Cernicharo et al. (1989) Cernicharo, J., Gottlieb, C., A., et al. 1989, ApJ, 341, L25
- Cernicharo et al. (1991) Cernicharo, J., Guélin, M., et al. 1991, A&A, 246, 213
- Cernicharo et al. (1996) Cernicharo, J., Barlow, M., J., et al. 1996, A&A, 315, L201
- Cernicharo & Guélin (1996) Cernicharo, J., & Guélin, M. 1996, A&A, 309, L27
- Cernicharo et al. (1999) Cernicharo, J., Yamamura, I., et al. 1999, ApJ, 526, L41
- Cernicharo et al. (2000) Cernicharo, J., Guélin, M., & Kahane, C. 2000, A&AS, 142, 181
- Cernicharo et al. (2001) Cernicharo, J., Heras, A., M., et al. 2001, ApJ, 546, L123
- Cernicharo (2004) Cernicharo, J., 2004, ApJ, 608, L41
- Cernicharo et al. (2006) Cernicharo, J., Pardo, J., R., et al. 2006, in preparation
- Cherchneff et al. (1992) Cherchneff, I., Barker, J., R., & Tielens, A., G., G., M. 1992, ApJ, 401, 269
- Clary et al. (2002) Clary, D., C., Buonomo, E., et al. 2002, J. Phys. Chem. A, 23, 5541
- Cox (2000) Cox, A., N. 2000, Allen’s Astrophysical Quantities, 4th ed., New York: AIP
- Crosas & Menten (1997) Crosas, M., & Menten, K., M. 1997, ApJ, 483, 913
- Dayal & Bieging (1995) Dayal, A., & Bieging, J., H. 1995, ApJ, 439, 996
- Doty & Leung (1998) Doty, S. D., & Leung, C. M. 1998, ApJ, 502, 898
- Draine (1978) Draine, B., T. 1978, ApJS, 36, 595
- Draine (1979) Draine, B., T. 1979, Ap&SS, 65, 313
- Fonfría et al. (2006) Fonfría, J., P., Cernicharo, J., et al. 2005, in preparation
- Ford & Neufeld (2001) Ford, K., E., S., & Neufeld, D., A. 2001, ApJ, 557, L113
- Ford et al. (2003) Ford, K., E., S., Neufeld, D., A., et al. 2003, ApJ, 589, 430
- Ford et al. (2004) Ford, K., E., S., Neufeld, D., A., et al. 2004, ApJ, 614, 990
- Frenklach et al. (1989) Frenklach, M., Carmer, C. S., & Feigelson, E. D. 1989, Nature, 339, 196
- Gail et al. (1984) Gail, H.-P., Keller, R., & Sedlmayr, E. 1984, A&A, 133, 320
- Gensheimer et al. (1995) Gensheimer, P., D., Likkel, L., & Snyder, L., E. 1995, ApJ, 439, 445
- Glassgold et al. (1986) Glassgold, A., E., Lucas, R., & Omont, A. 1986, A&A, 157, 35
- Glassgold (1996) Glassgold, A., E. 1996, ARA&A, 34, 241
- Goldhaber et al. (1987) Goldhaber, D., M., Betz, A., L., & Ottusch, J., J. 1987, ApJ, 314, 356
- González-Alfonso & Cernicharo (1993) González-Alfonso, E., & Cernicharo, J. 1993, A&A, 279, 506
- Green (1991) Green, S. 1991, ApJS, 76, 979
- Green (1993) Green, S. 1993, ApJS, 85, 181
- Guélin & Thaddeus (1977) Guélin, M., & Thaddeus, P. 1977, ApJ, 212, L81
- Guélin et al. (1978) Guélin, M., Green, S., & Thaddeus, P. 1978, ApJ, 224, L27
- Guélin et al. (1987a) Guélin, M., Cernicharo, J., et al. 1987a, A&A, 175, L5
- Guélin et al. (1987b) Guélin, M., Cernicharo, J., et al. 1987b, A&A, 182, L37
- Guélin et al. (1997) Guélin, M., Cernicharo, J., et al. 1997, A&A, 317, L1
- Guélin et al. (1998) Guélin, M., Neininger, N., & Cernicharo, J. 1998, A&A, 335, L1
- Guélin et al. (1999) Guélin, M., Neininger, N., et al. 1999, in The Physics and Chemistry of the Interstellar Medium, ed. V. Ossenkopf (Herdecke: GCA), 326
- Hasegawa et al. (2006) Hasegawa, T., I., Kwok, S., et al. 2006, ApJ, 637, 791
- Henkel et al. (1985) Henkel, C., Matthews, H., E., et al. 1985, A&A, 147, 143
- Herbst et al. (1989) Herbst, E., DeFrees, D., J., & Koch, W. 1989, MNRAS, 237, 1057
- Herpin & Cernicharo (2000) Herpin, F., & Cernicharo, J., 2000, ApJ, 530, L129
- Keady & Ridgway (1993) Keady, J. J., & Ridgway, S., T. 1993, ApJ, 406, 199
- Knapp (1985) Knapp, G., R. 1985, ApJ, 293, 273
- Konnov (2000) Konnov, A., A. 2000, http://homepages.vub.ac.be/ akonnov/
- Kwan & Linke (1982) Kwan, J., & Linke, R., A. 1982, ApJ, 254, 587
- Le Teuff et al. (2000) Le Teuff, Y. H., Millar, T., J., & Marckwick, A., J. 2000, A&AS, 146, 157
- Lorenz-Martins & Lefèvre (1993) Lorenz-Martins, S., & Lefèvre, J. 1993, A&A, 280, 567
- Lucas & Guélin (1990) Lucas, R., & Guélin, M. 1990, in Submillimetre Astronomy, ed. G. D. Watt & A. S. Webster (Dordrecht: Kluwer), 97
- Mamon et al. (1988) Mamon, G. A., Glassgold, A. E., & Huggins, P., J. 1988, ApJ, 328, 797
- McCabe (1982) McCabe, E., M. 1982, MNRAS, 200, 71
- Meier et al. (1993) Meier, R., Eberhardt, et al. 1993, A&A, 277, 677
- Melnick et al. (2001) Melnick, G. J., Neufeld, D. A., et al. 2001, Nature, 412, 160
- Millar & Herbst (1994) Millar, T., J., & Herbst, E. 1994, A&A, 288, 561
- Moneti et al. (2001) Moneti, A., Cernicharo, J., & Pardo, J., R. 2001, ApJ, 549, L203
- Morris et al. (1971) Morris, M., Zuckerman, B., et al. 1971, ApJ, 170, L109
- Morris et al. (1975) Morris, M., Gilmore, W., et al. 1975, ApJ, 199, L47
- Morris et al. (1976) Morris, M., Turner, B., E., et al. 1976, ApJ, 205, 82
- Moses et al. (2000) Moses, J., I., Bézard, B., et al. 2000, Icarus, 143, 244
- Murrell & Rodriguez (1986) Murrell, J., N., & Rodriguez, J., A. 1986, J. Mol. Struct. Theochem, 139, 267
- Neufeld et al. (2002) Neufeld, D., A., Kaufman, M., J., et al. 2002, ApJ, 580, 278
- Ohishi et al. (1989) Ohishi, M., Kaifu, N., et al. 1989, ApJ, 345, L83
- Ridgway & Keady (1988) Ridgway, S., T., & Keady, J. J. 1988, ApJ, 326, 843
- Roberts & Herbst (2002) Roberts, H., & Herbst, E. 2002, A&A, 395, 233
- Rodgers & Charnley (2002) Rodgers, S., D., & Charnley, S., B. 2002, Planet. Space Sci., 50, 1215
- Rouleau & Martin (1991) Rouleau, F., & Martin, P., G. 1991, ApJ, 377, 526
- Schutte et al. (1998) Schutte, W., A., van der Hucht, K., A., et al. 1998, A&A, 337, 261
- Smith et al. (1999) Smith, G., P., Golden, D., M., et al., 1999, GRI-Mech Version 3.0, http://www.me.berkeley.edu/gri_mech/
- Smith et al. (2004) Smith, I., W., M., Herbst, E., & Chang, Q. 2004, MNRAS, 350, 323
- Spaans et al. (1998) Spaans, M., Neufeld, D., A., et al. 1998, ApJ, 503, 780
- Thaddeus et al. (1984) Thaddeus, P., Cummins, S., E., & Linke, R., A. 1984, ApJ, 283, L45
- Thaddeus et al. (1985) Thaddeus, P., Gottlieb, C., A., et al. 1985, ApJ, 294, L49
- Tsuji (1973) Tsuji, T. 1973, A&A, 23, 411
- Tsuji (2000) Tsuji, T. 2000, in The Carbon Star Phenomenon, ed. R. F. Wing (Dordrecht: Kluwer), 313
- Tucker et al. (1974) Tucker, K., D., Kutner, M., L., & Thaddeus, P. 1974, ApJ, 193, L115
- Wang et al. (2001) Wang, S., Di Ventra, M., et al. 2001, Phys Rev Lett, 86, 5946
- Wiedemann et al. (1991) Wiedemann, G., R., Hinkle, K., H., et al. 1991, ApJ, 382, 321
- Willacy & Cherchneff (1998) Willacy, K., & Cherchneff, I. 1998, A&A, 330, 676
- Willacy (2004) Willacy, K. 2004, ApJ, 600, L87
- Wilson et al. (1971) Wilson, R., W., Solomon, P., M., et al. 1971, ApJ, 169, L35
- Winnewisser & Walmsley (1978) Winnewisser, G., & Walmsley, C., M. 1978, A&A, 70, L37
- Witteborn et al. (1980) Witteborn, F., C., Strecker, D., W., et al. 1980, ApJ, 238, 577
- Yamamoto et al. (1987) Yamamoto, S., Saito, S., et al. 1987, ApJ, 323, L149