Kinematic structure in the young Orionis association
Abstract
We have used precise radial velocity measurements for a large number of candidate low-mass stars and brown dwarfs, to show that the young Ori “cluster” consists of two spatially superimposed components which are kinematically separated by 7 in radial velocity, and which have different mean ages. We examine the relationship of these two kinematic groups to other populations in the Orion OB1 association and briefly discuss the consequence of mixed age samples for ongoing investigations of the formation and evolution of low-mass objects in this much-observed region.
keywords:
stars: low-mass, brown dwarfs – stars: pre-main-sequence – open clusters and associations: individual: Orionis.1 Introduction
Since their discovery (Walter et al. 1997), the low-mass objects surrounding the young star Ori (a quintuple system with an O9.5V primary and four spatially resolved, early-type components) have become one of the most intensively studied populations of young stars and brown dwarfs. They are reasonably close, so the young, intrinsically luminous, low-mass objects are bright. Interpretation of results is further aided by a high galactic latitude and low extinction (Brown, de Geus & de Zeeuw 1994).
Examples of recent investigations include the search for very low-mass stars, brown dwarfs and even “free floating planets” and determination of the initial mass function at low masses (e.g. Zapatero Osorio et al. 2000, 2002a; Béjar et al. 2001; Sherry, Walter & Wolk 2004); using the association to constrain the timescales for disc dissipation and the cessation of accretion in low-mass objects (e.g. Barrado y Navascués et al. 2003; Oliveira et al. 2004); searching for analogues of classical T-Tauri stars among young substellar objects (e.g. Jayawardhana et al. 2003); studying the evolution of magnetic activity and angular momentum in low-mass stars and brown dwarfs (e.g. Franciosini, Pallavicini & Sanz-Forcada 2006); and, investigating variability and possible age spreads in young star forming regions (e.g. Caballero et al. 2004; Burningham et al. 2005a).
Most of these investigations rely on the assumption of either a distance or age for the low-mass objects in the association. Furthermore, an implicit assumption often made, is that the studied objects are coeval or at least have an age spread that is modest compared with the cluster age. Previous papers have either adopted the Hipparcos distance to Ori ( pc – Perryman et al. 1997) and deduced an age of Myr from low-mass model isochrones (e.g. Oliveira et al. 2004), or they have assumed that Ori is part of the larger Orion OB1b association that has a mean Hipparcos distance of pc (Brown, Walter & Blauuw 1998) and hence deduced an age of Myr (e.g. Sherry et al. 2004).
In this letter we present the initial results of a precise radial velocity survey of low-mass stars and brown dwarfs around Ori. We show that the “cluster” of low mass object around Ori actually consists of two, kinematically distinct, spatially superimposed populations, with different mean ages.
2 Observations and Analysis

Multi-object spectroscopy was performed at three epochs for four separate fields (see Fig. 2) around Ori during the period 10 November 2005 to 13 January 2006. A total of 148 targets were observed at each epoch using the FLAMES instrument mounted on the VLT-Kueyen (UT2) 8.2-m telescope. The Medusa fibre system fed the Giraffe spectrograph and a 316 lines mm-1 grating produced spectra with a resolving power of 16000, covering the wavelength range 8080–8630Å at 0.14Å per pixel. Targets with were selected from the versus colour-magnitude diagram (CMD) described by Kenyon et al. (2005), corresponding to masses of (for an age of 3 Myr and distance of 440 pc – Baraffe et al. 1998, see Fig. 4).
A single exposure of 2750 s was obtained at each epoch, yielding spectra with signal-to-noise ratios (SNR) of 5–100 per pixel. One or two bright F/G stars were simultaneously observed in each field using the FLAMES fibre feed to the UVES spectrograph. These gave very high SNR spectra at a resolving power of 47000, which covered the same wavelength range and allowed us to model telluric absorption.
Spectra were reduced and extracted using the FLAMES UVES and Giraffe pipeline software. Giraffe wavelength calibration was initially provided by thorium-argon lamp exposures and then improved by reference to telluric absorption lines in each extracted spectrum. Sky was subtracted by forming a clipped mean sky spectrum from the many fibers allocated to sky in each configuration. Telluric correction was provided by modelling telluric features in the simultaneous UVES spectra using a 6-layer atmospheric model (Nicholls 1988) and the HITRAN molecular database (Rothman et al. 2005). This synthetic telluric spectrum was convolved with a gaussian profile and divided into the lower resolution Giraffe spectra. This removed all visible traces of telluric contamination.
Heliocentric radial velocities (RVs) were found by cross-correlation with the template star HD 34055 (M6V) using the wavelength range 8061–8535Å, but masking out regions around sky emission lines. Internal uncertainties in the RVs are for most targets. The zero point was set by cross-correlating HD 34055 with similar UVES spectra of the M-dwarfs Gl 402, Gl 406 and Gl 876, which have precisely measured heliocentric RVs (see Bailer-Jones 2004). The heliocentric RV of HD 34055 was , with a range when using the three standards that leads to an external error estimate of .
Equivalent widths (EWs) for the gravity sensitive Na i (8183, 8195Å) features were found by integrating in a range around the line centres (corrected for the RV). For the following analysis steps we then excluded: objects with a significantly variable RV over the three epochs (the topic of binarity in the sample will be tackled in a subsequent paper); all objects with an EW[Na] Å (indicative of a giant spectral class – see below); and all objects with a constant RV outside the range . A histogram of the weighted mean RVs for the remaining 117 objects is shown in Fig. 1. The RV distribution is clearly bimodal and we refer to these two populations as kinematic groups 1 ( ) and 2 ( ) respectively.
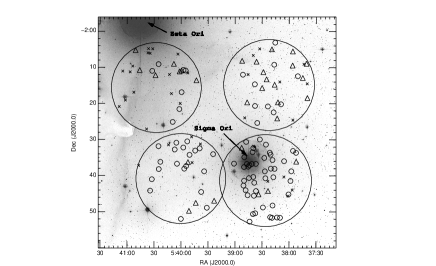


Figure 2 shows the spatial distribution of objects in the two kinematic groups. Representatives of both groups are found in all 4 Giraffe fields (and at all epochs), but the ratio of group 2 to group 1 objects becomes smaller towards the north (e.g. this ratio is 10/15 in the north-west Giraffe field compared with 46/4 in the south-west field). Note that the photometric selection criteria for each of these fields were identical. The larger total number of targets in the south-west field simply reflects the larger number of photometric candidates near Ori – a fact previously used to support the existence of the “ Ori cluster” (e.g. Sherry et al. 2004).
Figure 3 shows how EW[Na] behaves with colour for each group. This feature strengthens considerably with gravity in cool stars (e.g. Schiavon et al. 1997). At young ages, low-mass stars and brown dwarfs contract almost isothermally, resulting in a factor of increase in gravity between 1 and 100 Myr at a similar colour (Baraffe et al. 1998). Objects in kinematic groups 1 and 2 have a weaker EW[Na] than field M dwarfs of similar colour but stronger than giants where EW[Na] Å is found. Hence they have gravities intermediate between dwarfs and giants as expected for young low-mass objects. Figure 3 also shows that on average the objects in group 2 have lower gravities than those in group 1, although there is considerable overlap in the distributions. Formal EW uncertainties are less than 0.1Å for most of our targets and so cannot account for the overlap. Qualitatively, this indicates that group 1 is older (on average) than group 2, but the lack of any detailed EW-age calibration prevent us from making a quantitative estimate of the age difference or any age spread within each group.
Figure 4 shows the versus CMD for the two kinematic groups as well as for all the other spectroscopic targets to illustrate the target selection region. No obvious difference in distribution is seen. Of course all the targets were selected using the same photometric criteria, but Burningham et al. (2005b) have shown that few young stars exist outside of this range near Ori. Therefore this diagram demonstrates that it is impossible to separate the two kinematic populations on the basis of their colours and magnitudes.
3 Discussion
3.1 The link with Orion OB1
The RV distribution shown in Fig. 1 is clearly bimodal. Kinematic groups 1 and 2 have weighted mean RVs of and respectively (with an external error of ). The standard deviations about these mean velocities are 1.1 and 1.3 , suggesting coherent kinematic groups with internal dispersions similar to those found in young open clusters. Previous RV investigations of stars around Ori had insufficient precision ( ) to properly resolve these two components (e.g. Walter et al. 1997; Kenyon et al. 2005). From Figs. 2, 3 and 4 we deduce that: (i) the two kinematic components have a different spatial distribution; (ii) on average, group 1 is older than group 2 but by an uncertain amount and they may overlap; and (iii) the two groups occupy similar positions in the CMD.
The early-type stars of the Orion OB1 association were originally split into four subgroups by Blaauw (1964), primarily on the grounds of position. The two subgroups relevant to this study are the 1a and 1b subgroups – OB1a is an older dispersed population mainly to the north and north-west of the belt stars, while OB1b consists of the belt region including the belt stars and Ori. Brown et al. (1994, 1998) have reviewed the subgroup properties using new photometry and Hipparcos parallaxes for the O and B stars. They find the subgroups can also be separated on the basis of age and distance, obtaining ages of Myr and Myr and distances of pc and pc for OB1a and OB1b respectively. The two subgroups cannot be distinguished kinematically. Proper motions are very small in Orion OB1 because the association is moving almost radially away from the Sun. Average radial velocities of and are quoted for subgroups OB1a and OB1b by Morrell & Levato (1991) based on measurements of large numbers of early-type stars. Briceño et al. (2005) have searched for low-mass PMS stars in the Orion OB1a and OB1b regions using variability as an identifying characteristic and spectroscopy for confirmation. Using Blaauw’s spatial criteria to define the subgroups and assuming the distances quoted above, they compare their data with low-mass isochrones, finding ages of 7–10 Myr and 4–6 Myr for OB1a and OB1b respectively. The difference in age is supported by the frequency with which accretion discs are found in the two populations.
All of our targets are spatially within Blaauw’s OB1b region, but given that subgroup OB1a is in the foreground and widely dispersed, there seems little reason to suppose there are not significant numbers of older OB1a members in the line of sight towards OB1b (e.g. see Fig. 9 in Sherry et al. 2004). Hence, based on the similarity of their mean RVs, kinematic group 1 could be identified with either the OB1a or OB1b subgroups. Conversely, kinematic group 2 cannot be identified with any of the Orion OB1 subgroups and has a mean RV which is similar to the RV of Ori itself. Ori AB has according to Barbier-Brossat & Fignon (2000), who analyse all pre-1990 RV data. Morrell & Levato (1991) obtain for Ori E, but caution that it is probably variable. Given this kinematic evidence it is hard to see (other than by a simple positional criterion) how Ori could be securely classed as part of Orion OB1b and therefore it should not be assumed that either Ori or the group 2 objects around it have a distance and age in common with Orion OB1b.
Figure 4 shows two isochrones taken from the models of Baraffe et al. (1998) and converted into the observational plane using the empirical colour-effective temperature relationship and bolometric corrections described in Jeffries et al. (2004). These isochrones are approriate for our current knowledge of the age and distance of the Orion OB1a and OB1b subgroups. Our targets, along with Orion OB1a and OB1b, lie close to a locus (or more correctly a band) in the age-distance plane that results in young coeval populations appearing in roughly the same position in the colour-magnitude (and Hertzsprung-Russell) diagram.
The RV evidence, the strong spatial concentration of low-mass PMS stars and the low ratio of group 1 to group 2 objects immediately around Ori strongly support the identification of group 2 as the “ Ori cluster”. The Hipparcos parallax of Ori only constrains the distance to this cluster to be 270–520 pc, with a corresponding age from low-mass isochrones of between 15–2 Myr. However, if kinematic group 1 is older on average than group 2 (as suggested by Fig. 3) and, identified with Orion OB1a at Myr, then this would favour an age of a few Myr for group 2 and a distance similar to that of Orion OB1b ( pc). This would be consistent with a likely main-sequence lifetime of Myr for Ori A (O9.5V, K – Schaller et al. 1992). Alternatively, if group 1 is dominated by members of the more youthful Orion OB1b, then Ori and the group 2 objects that surround it would have to be even younger and further away.
There are two ways to further constrain this problem. One would be to improve the parallax measurement to Ori and the second would be to investigate the two kinematic groups with distance-independent age indicators. Of the latter there are two possibilities. Photospheric lithium is rapidly depleted in low-mass stars beginning at an age which is mass (and hence temperature dependent). Zapatero-Osorio et al. (2002b) found that all their Ori association targets across a wide mass range had Li consistent with no depletion, leading to an upper age limit of 8 Myr. Unfortunately their targets do not have precise RVs and few are contained within our survey, so we do not know to which kinematic group they belong. Instead we have cross-correlated members of kinematic groups 1 and 2 with the targets of Kenyon et al. (2005), finding 39 correlations (10 in group 1 and 29 in group 2). Li-rich stars are found at in both groups (warmer stars were not observed by Kenyon et al.), corresponding to an effective temperature of . Using the models of Baraffe et al. (1998), this places an upper limit of Myr to the age of both groups. A similar limit is found using other evolutionary models. Detailed Li spectroscopy of warmer members of groups 1 and 2 might be able to improve these constraints.
A second empirical method is to compare the fraction of objects with circumstellar material with those in other clusters and assume that disc dissipation occurs on a universal timescale. We have correlated objects in kinematic groups 1 and 2 with objects observed at by Oliveira et al. (2004, 2006). We find 29 correlations and that 1/4 members of group 1 and 10/25 members of group 2 have a significant excess (as defined in those papers). There are insufficient statistics to comment on the relative ages of the two groups, but a 40 per cent disc frequency for group 2 is consistent with an age of 3-4 Myr according to Haisch, Lada & Lada (2001).
In summary, our favoured, although not necessarily unique, interpretation is that kinematic group 1 should be identified with Orion OB1a at an age of Myr and at a distance of pc. The spread about a single isochrone could be due to the presence of some younger Orion OB1b members and perhaps a large spread of distances within the widely dispersed OB1a association. Group 2 would then have an age of about 3 Myr, be clustered around Ori and be at a similar distance to Orion OB1b ( pc). However, the “ Ori cluster” appears to be kinematically distinct from Orion OB1b.
3.2 Consequences
Studies of low-mass stars and brown dwarfs in the Ori region must account for the possibility of a population with mixed age and distance. These populations cannot be distinguished in the CMD and the only way to reliably attribute stars to one group or the other is via RV measurements with a precision better than a few . The populations do show some spatial segregation. It appears that samples restricted to within 10 arcminutes of Ori would suffer contamination from the older population at the level of only percent. However, in the quest for larger and more complete samples, many studies in the literature have travelled beyond this boundary, into regions (e.g. arcminutes to the north of Ori) with roughly equal numbers from both populations. How much of a problem would older interlopers be? There is insufficient space in this letter to explore in detail the effects of our discovery on all the previous studies of the Ori region but we make some general points below.
The effects on mass determination depend on which technique is used. A simple mass-magnitude relationship obtained from models (e.g. Baraffe et al. 1998) is not greatly affected by assignment of a star to one kinematic group or the other – the differences in age and distance almost compensate. Masses for an age of 3 Myr and distance of 440 pc are larger than those deduced for an age of 10 Myr and distance of 330 pc by about 6 per cent at , by 30 per cent at and are almost the same at . However, bigger discrepancies would arise if masses were estimated from colours or spectral types because the evolutionary tracks are not vertical when using these parameters as abcissae in the Hertzsprung-Russell diagram. At a given colour (in the versus CMD for example) one might deduce that a star had by assuming an age of 3 Myr, but it would actually be if the age were 10 Myr (Baraffe et al. 1998). This discrepancy reduces towards lower masses as the evolutionary tracks become more vertical in the CMD, becoming a factor of 1.2 at and below . There are also significant structural changes for low-mass stars on these timescales which would be important if using a Ori sample to study the evolution of angular momentum and rotation rates. Under the assumptions of negligible angular momentum loss between 3 and 10 Myr and homologous contraction, objects thought to be at 3 Myr but which were actually at an age of 10 Myr, would have spun up by a factor of 2.2 at and 2.9 at . The interlopers could therefore have a significantly different rotation distribution, perhaps appearing as a tail of short period, fast rotators.
If the disc lifetime distribution is independent of environment then interlopers from an older population would have significantly fewer (accretion) discs and result in a downwardly biased estimate of the disc frequency in the Ori cluster. As discussed in the previous section there are insufficient data to test this in detail yet. The disc frequency we determined for members of kinematic group 2 is higher than, but still consistent with, the per cent frequency determined for a larger sample of objects around Ori which contains at least some objects from group 1.
Finally, studies of the age spread and spatial distribution within the cluster must be aware of, and try to eliminate, the effects caused by including two populations with probable differences in age and distance. For example, the radial profile of the cluster deduced by Sherry et al. (2004) includes photometrically selected cluster members more than 30 arcminutes to the north of Ori, which are quite likely to belong to kinematic group 1. Excluding these would reduce the number of stars and brown dwarfs in the Ori cluster and decrease the deduced cluster core radius.
4 Conclusions
The cluster of young objects situated towards Ori consists of two kinematic components separated by in RV. The first component (and larger in our sample) is concentrated around Ori and shares a common RV with it. The second component increases in concentration towards the north and has a RV similar to the Orion OB1a and OB1b sub-associations. On the basis of gravity-sensitive spectral features, the second component appears to be older on average than the first, although considerable overlap is possible. The two components cannot be separated in a colour-magnitude diagram, a degeneracy that implies that the older second component is closer. Our favoured interpretation is that the first component is the “ Ori cluster”, but that it should not necessarily be identified (in distance or age) with any part of the Orion OB1 association. The second component consists of low-mass objects from either the Orion OB1a or OB1b sub-associations or more probably, a mixture of the two. The presence of multiple populations with different ages complicates the study of low-mass objects in this region.
5 Acknowledgements
Based on observations collected with the VLT/UT2 Kueyen telescope (Paranal Observatory, ESO, Chile) using the FLAMES/GIRAFFE spectrograph (Observing run 076.C-0145).
References
- [\citeauthoryearBailer-JonesBailer-Jones2004] Bailer-Jones C. A. L., 2004, A&A, 419, 385
- [\citeauthoryearBaraffe, Chabrier, Allard & HauschildtBaraffe et al.1998] Baraffe I., Chabrier G., Allard F., Hauschildt P. H., 1998, A&A, 337, 403
- [\citeauthoryearBarbier-Brossat & FignonBarbier-Brossat & Fignon2000] Barbier-Brossat M., Fignon P., 2000, A&AS, 142, 217
- [\citeauthoryearBarrado y Navascués, Béjar, Mundt, Martín, Rebolo, Zapatero Osorio & Bailer-JonesBarrado y Navascués et al.2003] Barrado y Navascués D., Béjar V. J. S., Mundt R., Martín E. L., Rebolo R., Zapatero Osorio M. R., Bailer-Jones C. A. L., 2003, A&A, 404, 171
- [\citeauthoryearBéjar, Martín, Zapatero-Osorio, Rebolo, y Navascués, Bailer-Jones, Mundt, Baraffe, Chabrier & AllardBéjar et al.2001] Béjar V., Martín E. L., Zapatero-Osorio M. R., Rebolo R., y Navascués B., Bailer-Jones C. A. L., Mundt R., Baraffe I., Chabrier G., Allard F., 2001, ApJ, 556, 830
- [\citeauthoryearBlaauwBlaauw1964] Blaauw A., 1964, ARA&A, 2, 213
- [\citeauthoryearBriceño, Calvet, Hernández, Vivas, Hartmann, Downes & BerlindBriceño et al.2005] Briceño C., Calvet N., Hernández J., Vivas A. K., Hartmann L., Downes J. J., Berlind P., 2005, AJ, 129, 907
- [\citeauthoryearBrown, de Geus & de ZeeuwBrown et al.1994] Brown A. G. A., de Geus E. J., de Zeeuw P. T., 1994, A&A, 289, 101
- [\citeauthoryearBrown, Walter & BlaauwBrown et al.1998] Brown A. G. A., Walter F. M., Blaauw A., 1998, in McCaughrean M. J., Burkert A., eds, The Orion Complex Revisited ASP Conference Series, astro-ph/9802054
- [\citeauthoryearBurningham, Naylor, Littlefair & JeffriesBurningham et al.2005a] Burningham B., Naylor T., Littlefair S. P., Jeffries R. D., 2005a, MNRAS, 363, 1389
- [\citeauthoryearBurningham, Naylor, Littlefair & JeffriesBurningham et al.2005b] Burningham B., Naylor T., Littlefair S. P., Jeffries R. D., 2005b, MNRAS, 356, 1583
- [\citeauthoryearCaballero, Béjar, Rebolo & Zapatero OsorioCaballero et al.2004] Caballero J. A., Béjar V. J. S., Rebolo R., Zapatero Osorio M. R., 2004, A&A, 424, 857
- [\citeauthoryearFranciosini, Pallavicini & Sanz-ForcadaFranciosini et al.2006] Franciosini E., Pallavicini R., Sanz-Forcada J., 2006, A&A, 446, 501
- [\citeauthoryearHaisch, Lada & LadaHaisch et al.2001] Haisch K. E. J., Lada E. A., Lada C. J., 2001, ApJ, 553, L153
- [\citeauthoryearJayawardhana, Ardila, Stelzer & HaischJayawardhana et al.2003] Jayawardhana R., Ardila D. R., Stelzer B., Haisch K. E. J., 2003, AJ, 126, 1515
- [\citeauthoryearJeffries, Naylor, Devey & TottenJeffries et al.2004] Jeffries R. D., Naylor T., Devey C. R., Totten E. J., 2004, MNRAS, 351, 1401
- [\citeauthoryearKenyon, Jeffries, Naylor, Oliveira & MaxtedKenyon et al.2005] Kenyon M. J., Jeffries R. D., Naylor T., Oliveira J. M., Maxted P. F. L., 2005, MNRAS, 356, 89
- [\citeauthoryearMontes & MartínMontes & Martín1998] Montes D., Martín E. L., 1998, A&AS, 128, 485
- [\citeauthoryearMorrell & LevatoMorrell & Levato1991] Morrell N., Levato H., 1991, ApJS, 75, 965
- [\citeauthoryearNichollsNicholls1988] Nicholls R. W., 1988, Journal of Quantitative Spectrscopy and Radiative Transfer, 40, 275
- [\citeauthoryearOliveira, Jeffries & van LoonOliveira et al.2004] Oliveira J. M., Jeffries R. D., van Loon J. T., 2004, MNRAS, 347, 1327
- [\citeauthoryearOliveira, Jeffries, van Loon & RushtonOliveira et al.2006] Oliveira J. M., Jeffries R. D., van Loon J. T., Rushton M. T., 2006, MNRAS in press
- [\citeauthoryearPerryman, A, A, A, A, A, A, A, A, A, A, A, A, A, A, A & APerryman et al.1997] Perryman M. A. C. et al., 1997, A&A, 323, L49
- [\citeauthoryearRothmanRothman2005] Rothman L. S. e. a., 2005, Journal of Quantitative Spectrscopy and Radiative Transfer, 96, 139
- [\citeauthoryearSchaller, Schaerer, Meynet & MaederSchaller et al.1992] Schaller G., Schaerer D., Meynet G., Maeder A., 1992, A&AS, 96, 269
- [\citeauthoryearSchiavon, Barbuy, Rossi & MiloneSchiavon et al.1997] Schiavon R. P., Barbuy B., Rossi S. C. F., Milone A., 1997, ApJ, 479, 902
- [\citeauthoryearSherry, Walter & WolkSherry et al.2004] Sherry W. H., Walter F. M., Wolk S. J., 2004, AJ, 128, 2316
- [\citeauthoryearWalter, Wolk, Freyberg & SchmittWalter et al.1997] Walter F. M., Wolk S. J., Freyberg M., Schmitt J. H. M. M., 1997, Mem. della Soc. Astron. Ital., 68, 1081
- [\citeauthoryearXuXu1991] Xu Z., 1991, A&A, 248, 367
- [\citeauthoryearZapatero Osorio, Béjar, Martín, Rebolo, Barrado y Navascués, Bailer-Jones & MundtZapatero Osorio et al.2000] Zapatero Osorio M. R., Béjar V. J. S., Martín E. L., Rebolo R., Barrado y Navascués D., Bailer-Jones C. A. L., Mundt R., 2000, Science, 290, 103
- [\citeauthoryearZapatero Osorio, Béjar, Martín, Rebolo, Barrado y Navascués, Mundt, Eisloffel & CaballeroZapatero Osorio et al.2002] Zapatero Osorio M. R., Béjar V. J. S., Martín E. L., Rebolo R., Barrado y Navascués D., Mundt R., Eisloffel J., Caballero J. A., 2002a, ApJ, 578, 536
- [\citeauthoryearZapatero Osorio, Béjar, Pavlenko, Rebolo, Allende Prieto, Martín & García LópezZapatero Osorio et al.2002] Zapatero Osorio M. R., Béjar V. J. S., Pavlenko Y., Rebolo R., Allende Prieto C., Martín E. L., García López R. J., 2002b, A&A, 384, 937