11email: mkadler@milkyway.gsfc.nasa.gov, ros@mpifr-bonn.mpg.de 22institutetext: Exploration of the Universe Division, NASA Goddard Space Flight Center, Greenbelt Road, Greenbelt, MD 20771, USA 33institutetext: Astronomy Department, University of Michigan, Ann Arbor, MI 48109-1042, USA
33email: [phughes,mfa,haller]@umich.edu
A Quasi-Periodic Modulation of the Radio Light Curve of the Blazar PKS B0048$-$097
In this letter we present the results of a wavelet analysis of the radio light curve of the BL Lac Object PKS B0048097 from the University of Michigan Radio Astronomy Observatory monitoring program at 8 GHz during twenty-five years, from 1979 to 2004. The results show a remarkable periodicity of 450–470 days in the early 1980s that changed to a 585 day periodicity in the late 1980s to early 1990s. A less pronounced 400 day periodicity is found after . Very-long-baseline interferometry imaging at 15 GHz shows dramatic structural changes in the usually unresolved source between two epochs, 1995.57 and 2002.38. The pronounced northward directed jet seen in the 2002 image differs by more than 90∘ in direction from the source structure found in earlier epochs. These findings make PKS B0048097 a primary target for multi-wavelength observations and intensive radio monitoring to decipher the blazar-variability phenomenon.
Key Words.:
BL Lacertae objects: individual (PKS B0048097) – galaxies: active – galaxies: jets1 Introduction
Combined multi-frequency (radio to X-ray/-ray) observations of active galactic nuclei (AGN) can yield important insights into the physics of relativistic outflows associated with super-massive black holes. In particular the emission of blazars (BL Lac objects and OVV quasars, see Ulrich, Maraschi & Urry Ulr97 (1997) for a description on the nature of blazars) is believed to be dominated over the whole electromagnetic spectrum by the most compact regions of relativistic jets. Blazars exhibiting quasi-periodic behaviour in principle allow the inter-relation between the compact radio jet and the broadband spectral energy distribution to be deciphered via quasi-simultaneous multi-frequency observations, especially if the time scales are small enough to consider variability data over multiple cycles, but such objects are rare.
Hughes, Aller, & Aller (Hug98 (1998)) find a persistent modulation of the total flux and polarisation of the BL Lac object OJ 287. The dominating period of 1.12 yr in the 1980s was later displaced by a strong 1.66 yr periodicity during the 1990s. The relationship between these two variations was interpreted by Hughes, Aller, & Aller (Hug98 (1998)) in terms of a “shock-in-jet” model while the complex periodic optical variability of OJ 287 (period between major outbursts yr), has been interpreted, e.g., in terms of a “precessing-jet” model by Abraham (Abr00 (2000)). Stirling et al. (Sti03 (2003)) suggest an oscillating “nozzle” structure of the inner jet of BL Lac with a period of years, based on radio millimetre flux-density monitoring and VLBI observations between 1998 and 2001 (see also Mutel & Denn Mut05 (2005)). Villata et al. (Vil04 (2004)) analyse the optical and radio long-term variability of BL Lac and find a gradually lengthening yr periodicity. The optical and radio long-term variability of the BL Lac object AO 0235+16 has been investigated by Raiteri et al. (Rai01 (2001)) revealing a possible 5–6 year periodicity based on long-term monitoring data, in the radio regime particularly on data of the UMRAO111University of Michigan Radio Astronomy Observatory; see http://www.astro.lsa.umich.edu/obs/radiotel/umrao.html database. Ostorero, Villata & Raiteri (Ost04 (2004)) applied the helical jet model of Villata & Raiteri (Vil99 (1999)) to the case of AO 0235+16, interpreting the data in terms of Doppler factor variations due to changes of the viewing angle because of the helix rotation. In all these cases, attempts have been made to understand the periodic behaviour as a result of orbital motion of two black holes in a binary system, helical jet structures, shocks, and instabilities of the disk or jet-plasma flow.
In this letter, we report on the detection of a particularly strong, and persistent quasi-periodic long-term modulation of the compact-jet emission of the BL Lac object PKS B0048097. The comparatively short time scale of 350 days to 600 days and the large amplitude of the variability make PKS B0048097 a particularly well-suited source for future multi-frequency campaigns on the broadband spectral emission of blazar sources and tests of blazar-periodicity models.
In Sect. 2, we present the observational data and their analysis. We discuss the results of a cross-wavelet analysis of twenty five years of the University of Michigan Radio Astronomy Observatory (UMRAO) monitoring of PKS B0048097 and discuss its parsec-scale structure during two epochs observed as part of the Very Long Baseline Array (VLBA) 2 cm Survey. Finally, we summarize our results and their implications for future blazar studies, in Sect. 3.
2 Background, Observations and Analysis
PKS B0048097 is a BL Lac object with unknown redshift. A lower limit of is postulated by Falomo (Fal96 (1996)) from HST data. The flux density of PKS B0048097 has been measured since 1979 at 4.8 GHz, 8.0 GHz, and 14.5 GHz using the University of Michigan 26 m paraboloid. The source is observed once every three months at all three frequencies as part of the UMRAO BL Lac Observing Program (Aller et al. All99 (1999); Aller, Aller & Hughes All03 (2003)). Its light curve is best sampled at 8.0 GHz (see Fig. 1) exhibiting pronounced maxima during several well defined time periods.
2.1 Wavelet Analysis
We used a continuous wavelet analysis, which quantifies the behaviour of a signal on different temporal scales, to investigate the available UMRAO data for periodicities. As a function of time, the signal is convolved with a localised wave-packet, that is translated along the series, for a number of ‘dilations’ of the wave-packet (Hughes et al. Hug98 (1998)). This technique has the great advantage of preserving temporal locality: a gap in the time series will be evident along the corresponding line in transform space, and events that are distinct in the signal will have distinct counterparts in transform space. A Morlet wavelet is particularly suited to the analysis of time series, as it is complex, so the real part of the transform exhibits an oscillatory behaviour corresponding to periodicity in the time series, while the modulus provides a measure of the power in different components of the signal.
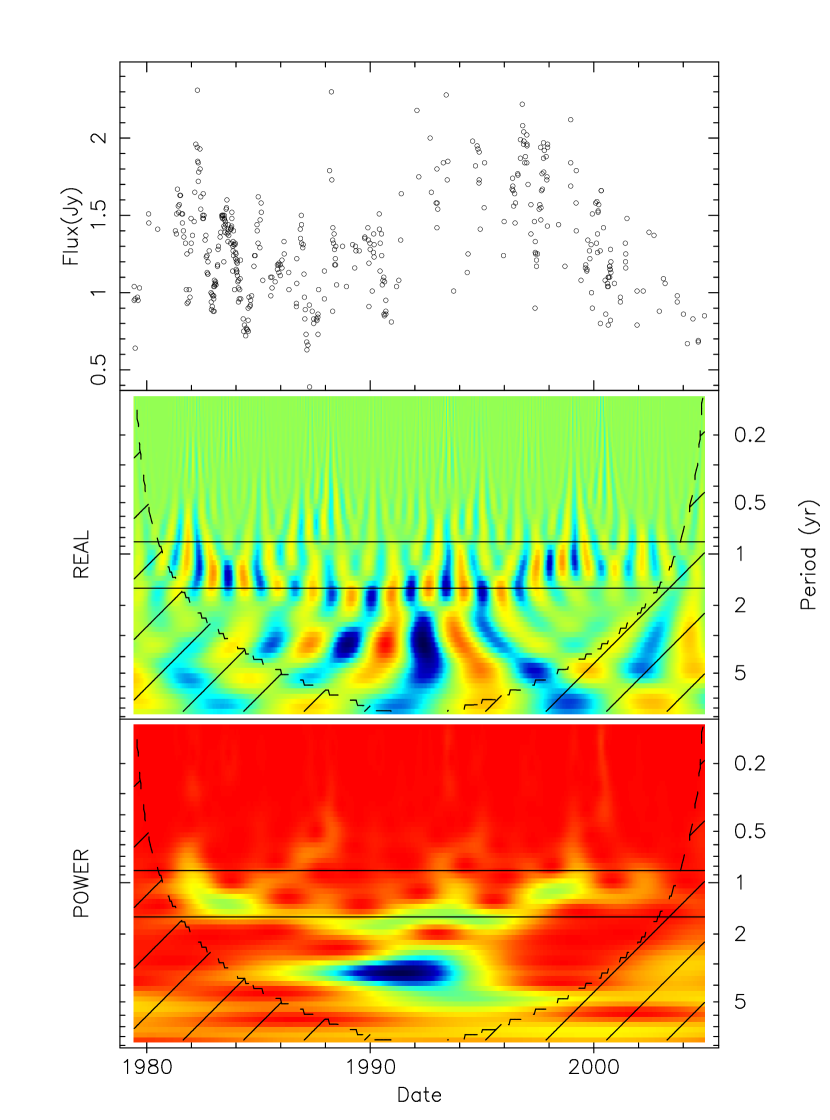
Such an analysis has been applied to the time series for PKS B0048097, and, as seen in Fig. 1, a distinct pattern is seen in both the real part of the source wavelet transform, and its modulus, corresponding to a quasi-periodic component containing a modest fraction of the overall power, and masked in a Fourier power spectrum, because of drifts in time scale across the data window. In the cross wavelet transform technique, described, e.g., by Kelly et al. (Kel03 (2003)), the continuous transform of the signal is convolved with a set of template periodic signals. This analysis has been used to quantify the result (apparent on visual inspection of the top panel at Fig. 1), establishing a time scale of 385–470 days with a confidence of % that this component does not arise by chance from random patterns associated with a lag-1 autoregressive process.
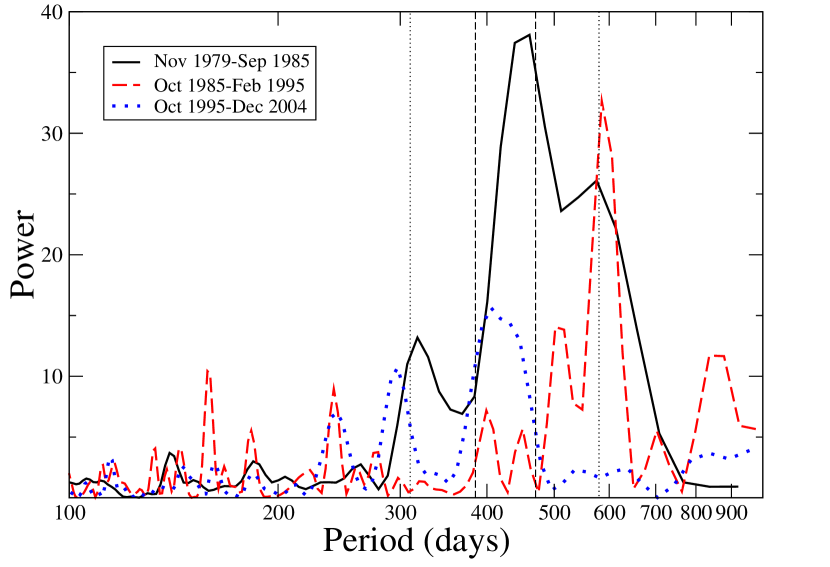
The varying time scale of the disclosed periodicity has been further investigated using a Lomb-Scargle periodogram analysis (Lomb Lom76 (1976), Scargle Sca82 (1982)). In a L-S periodogram, the classical discrete Fourier periodogram is redefined in such a manner to as to make it invariant to a shift of the origin of time. The L-S periodogram analysis has been performed using the period software package222The period software package is provided by the Starlink Project which was run by CCLRC on behalf of PPARC. See http://star-www.rl.ac.uk. The L-S analysis between November 1979 and September 1985 shows maximal power at – days and a secondary signal at days (see Fig. 2). Between October 1985 and February 1995, only one narrow peak at days is present. After October 1995, the highest power is found at a time scale of days, that is considerably less pronounced than the periodicities at the earlier time ranges. The significance of the individual peaks in Fig. 2 is difficult to quantify because of the not a-priori known frequency dependence of the underlying noise process333Only the assumption of a white noise process would allow a simple significance threshold parallel to the frequency axis to be placed. Admitting a red noise process would require us to consider a range of possible power laws for the process, which would lead to a range of significance areas (not parallel to the frequency axis). Note, that the formal L-S false-alarm-probability lies below 1 % (with 95 % confidence) for all major peaks in Fig. 2. We base our detection on the highly-significant signal in the global power spectrum. Figure 2 illustrates that over the full years of UMRAO 8 GHz radio light curve monitoring of PKS B0048097 the maximal power found by the L-S analysis is located within the significance ranges found by the cross-wavelet analysis, but that its time scale and power vary with time.
2.2 Structural Variability
On parsec scales, Shen et al. (She97 (1997)) and Gabuzda, Pushkarev & Cawthorne (Gab99 (1999)) both report a core-jet morphology of PKS B0048097, however the reported jets differ by 40 degrees in position angle (P.A.). While Shen et al. (She97 (1997)) report a P.A. of (south-westward) in epoch 1992.9 from 5 GHz VLBI observations, Gabuzda et al. (Gab99 (1999)) find a jet at P.A. (south-eastward) in epoch 1992.2 also from 5 GHz data. In both cases the -coverage was not optimum. In the VLBA 2 cm Survey observations before 2002, PKS B0048097 showed no clear resolved structure. Figure 3 shows the milliarcsecond structure of PKS B0048097 in epochs 1995.57 and 2002.38 (compare Table 1). In 1995.57, a weak westward directed jet is found, partially resolved only by the longest east-west baselines. The -data obtained in 2002.38 show clear evidence for a resolved north-south structure along P.A. with the jet pointing in a direction more than 90∘ different from what was reported by Shen et al. She97 (1997) and Gabuzda et al. (Gab99 (1999)). Considering these discrepancies between different works, PKS B0048097 might represent a case of extreme jet-ejection-angle variation. This would be of particular interest in conjunction with a putative periodicity of the radio light curve as revealed from the UMRAO data above. In the scenario of a precessing jet, PKS B0048097 might represent a highly attractive target to study the broadband jet emission of a BL Lac object at different angles to the line of sight.
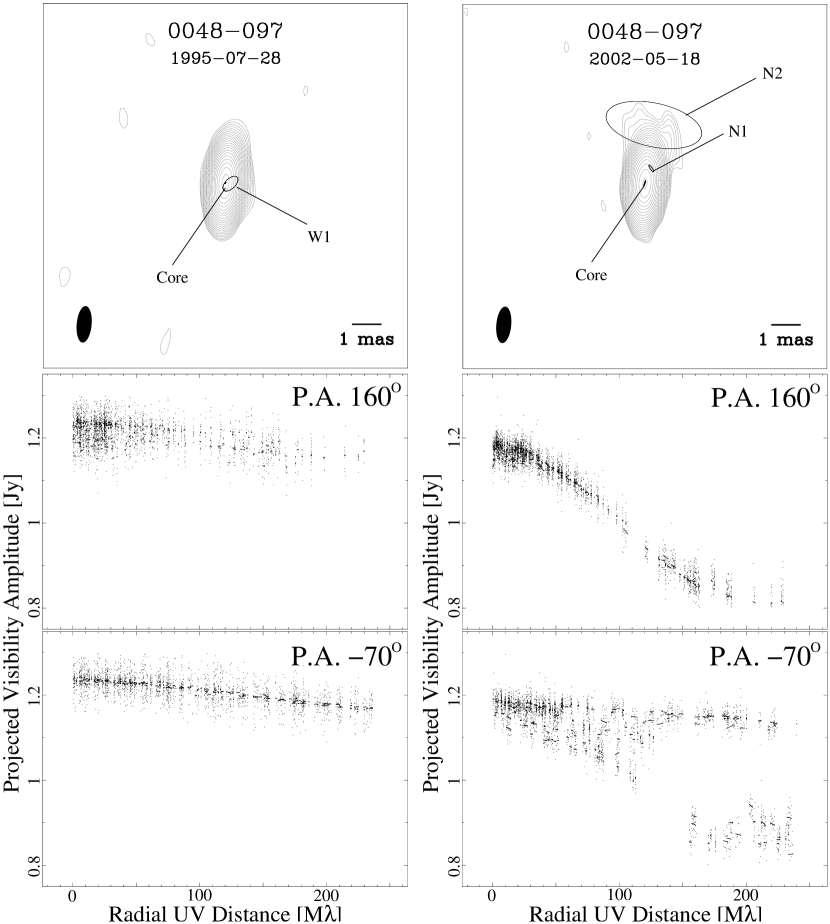
On the basis of the available data, it is not possible to derive the time scales of the structural variability. VLBA 2 cm Survey observations of PKS B0048097 have been conducted during two additional epochs between 1995 and 2002 but the data quality in both cases does not allow us to compare the milliarcsecond structure directly to the two images presented here, due to shorter integration times and sub-optimal -coverage. After 2002, the source has been observed several times as part of the VLBA 2 cm Survey continuation project, MOJAVE. An analysis of these observations, which provide full polarimetric information, is currently being performed. A first MOJAVE image of PKS B0048097 in 2003 showing a northward-directed jet similar to the 2002 source structure can be found in Lister & Homan (Lis05 (2005)).
| Image parametersa | Model fit parametersb | ||||||
| Epoch | Beamc | d | rmse | Comp.f | g | P.A.h | i |
| [(masmas),∘] | [Jy/beam] | [mJy/beam] | [mas] | [∘] | [Jy/beam] | ||
| 1995-07-28 | ; | Core | — | ||||
| W1 | |||||||
| 2002-05-18 | ; | Core | — | ||||
| N1 | |||||||
| N2 | |||||||
a The lowest contour is 1 mJy/beam in both images, contours increase by factors of ; b Formal uncertainties in the model fits are too small and therefore are not printed in the table; c Size and orientation of the restoring beam; d Peak flux density per beam area; e Noise level; f Individual Gaussian model-fit component; g Distance from core component; h Position angle of model-fit component; i Flux density of model-fit component per beam area.
3 Summary and Implications
The BL Lac object PKS B0048097 exhibits strong structural variability on sub-milliarcsecond scales and pronounced radio, optical (see, e.g., Pica et al. Pic88 (1988)) and X-ray flux variability. We have demonstrated that the radio light curve of PKS B0048097 has a strong modulation with a period of days to days at 8 GHz. Additional insight may be gained from future polarimetric studies which have not been considered in this letter. From all wavelet transforms of sources monitored as part of the UMRAO program, only for OJ 287 a comparably strong persistent signal has been found. The strength of the modulation and the comparatively short time scale makes PKS B0048097 a prime object for coordinated broadband observing campaigns. In particular, the correlation of the varying VLBI-jet ejection angle of the source with radio (and higher energy) light-curve evolution provides a tool to test precessing-jet models against alternative models (e.g., intrinsic instabilities of the flow) of periodic light-curve modulation in blazars. Unlike most other sources, the short 350 day to 600 day time scale of PKS B0048097 allows these alternatives to be tested observationally in a relatively short time.
Acknowledgements.
We thank the referee, Claudia M. Raiteri, for her valuable suggestions on improving the paper. MK has been supported in part by a Fellowship of the International Max Planck Research School for Radio and Infrared Astronomy at the Universities of Bonn and Cologne and in part by an appointment to the NASA Postdoctoral Program at the Goddard Space Flight Center, administered by Oak Ridge Associated Universities through a contract with NASA. PAH was supported in part by NSF grant AST 0205105. UMRAO is partially supported by a series of grants from the NSF and by funds from the University of Michigan. The VLBA is operated by NRAO, which is a facility of the National Science Foundation operated under cooperative agreement by Associated Universities, Inc. Part of this work has been made in collaboration with the VLBA 2 cm Survey Team.References
- (1) Abraham, Z. 2000, A&A, 355, 915
- (2) Aller, M. F., Aller, H. D., Hughes, P. A., & Latimer, G. E. 1999, ApJ, 512, 601
- (3) Aller, M. F., Aller, H. D. & Hughes, P. A., 2003, in Radio Astronomy at the Fringe, Zensus, J. A., Cohen, M. H. & Ros, E. (eds.), ASP Conf. Ser. Vol. 300, (San Francisco: ASP), p. 159
- (4) Falomo, R. 1996, MNRAS, 283, 241
- (5) Gabuzda, D. C., Pushkarev, A. B., & Cawthorne, T. V. 1999, MNRAS, 307, 725
- (6) Hughes, P. A., Aller, H. D., & Aller, M. F. 1998, ApJ, 503, 662
- (7) Kelly, B. C., Hughes, P. A., Aller, H. D., & Aller, M. F. 2003, ApJ, 591, 695
- (8) Lister, M. L., & Homan, D. C., 2005, AJ, 130, 1389
- (9) Lomb, N. R. 1976, Ap&SS, 39, 447
- (10) Mutel, R. L. & Denn, G. R. 2005, ApJ, 623, 79
- (11) Ostorero, L., Villata, M., & Raiteri, C. M. 2004, A&A, 419, 913
- (12) Pian, E., Foschini, L., Beckmann, V., et al. 2005, A&A, 429, 427
- (13) Pica, A. J., Smith, A. G., Webb, J. R., et al. 1988, AJ, 96, 1215
- (14) Raiteri, C. M., Villata, M., Aller, H. D., et al. 2001, A&A, 377, 396
- (15) Scargle, J. D. 1982, ApJ, 263, 835
- (16) Shen, Z.-Q., Wan, T.-S., Moran, J. M., et al. 1997, AJ, 114, 1999
- (17) Stirling, A. M., Cawthorne, T. V., Stevens, J. A., et al. 2003, MNRAS, 341, 405
- (18) Ulrich, M. H., Maraschi, L., & Urry, C. M. 1997, ARA&A, 35, 445
- (19) Villata, M. & Raiteri, C. M. 1999, A&A, 347, 30
- (20) Villata, M., Raiteri, C. M., Aller, H. D., et al. 2004, A&A, 424, 497