Recurrence of the Blue Wing Enhancements in the High Ionization Lines of SDSS 1004+4112 A
Abstract
We present integral field spectroscopic observations of the quadruple-lensed QSO SDSS 1004+4112 taken with the fiber system INTEGRAL at the William Herschel Telescope on 2004 January 19. In May 2003 a blueward enhancement in the high ionization lines of SDSS 1004+4112A was detected and then faded. Our observations are the first to note a second event of similar characteristics less than one year after. Although initially attributed to microlensing, the resemblance among the spectra of both events and the absence of microlensing-induced changes in the continuum of component A are puzzling. The lack of a convincing explanation under the microlensing or intrinsic variability hypotheses makes the observed enhancements particularly relevant, calling for close monitoring of this object.
Subject headings:
gravitational lensing, quasars: emission lines, quasars: individual (SDSS 1004+4112)1. Introduction
The large separation (14.62 arcsec) quadruple gravitationally lensed quasar was first identified by Inada et al. (2003) (hereinafter I03) in the Sloan Digital Sky Survey. The derived redshift is and the lensing complex consists of a cluster of galaxies at .
The components of a multiple lensed system can show uncorrelated variability due to the gravitational (de)magnification produced by compact deflectors aligned with the source. This phenomenon, microlensing (Chang & Refsdal, 1979, 1984), is routinely observed in the continuum emission of multiple imaged QSOs, and it is considered a powerful tool for mapping the QSO continuum source (Yonehara et al., 1999).
According to our current understanding of the structure of active galactic nuclei (AGNs), the continuum source of a QSO is surrounded by a wider region, where the broad emission lines (BELs) originate. Early versions of the standard model of AGNs assumed a too large size for the broad line region (BLR) (1 pc) to be microlensed by solar-mass objects (Nemiroff, 1988; Schneider & Wambsganss, 1990). However, these early estimates were reduced by two orders of magnitude by the new measurements of the BLR size based in the reverberation method (Wandel et al., 1999; Kaspi et al., 2000). Considering the new size estimates, a variety of theoretical models for the kinematic structure of the BLR (Popović, Mediavilla & Muñoz, 2001; Abajas et al., 2002; Lewis & Ibata, 2004) have shown that microlensing by stellar sized objects can produce significant amplifications of the BEL of multiple imaged QSOs, especially in the high ionization lines.
Richards et al. (2004b) (hereinafter R04) found excess in the blue wings of several high ionization lines of SDSS 1004+4112A, the highest magnified lensed image, relative to the same lines in the other images. The excess persisted for at least 28 days and then faded. No such enhancements in the blue wings were seen in the low ionization lines. These results are in agreement with current ideas about the stratification of the BLR according to the ionization level (Peterson & Wandel, 2000) and suggest the possibility of scanning the BLR with high spatial resolution. There is no evidence of continuum microlensing in the SDSS 1004+4112 event (however see Ota et al. 2006). This lack of correlation can be explained for a particular event (Lewis & Ibata, 2004), but the apparent absence of continuum amplification in all the reported cases of BEL microlensing (R04,Chartas et al. 2002, 2004; Dai et al. 2003) is intriguing.
In this article we present new spectroscopic measurements of SDSS 1004+4112 that show a recurrence of the blueward magnification of the high ionization line wings of image A.
2. Observations and data reduction
SDSS 1004+4112 was observed on 2004 January 19 with the fiber system INTEGRAL (Arribas et al., 1998), at the 4.2 m William Herschel Telescope (WHT, Roque de los Muchachos Observatory, La Palma, Spain). Two sets of three 1800 s exposures each were taken corresponding to two pointings separated by few arc seconds. We use the standard fiber bundle #3 (SB3) which consists of 115 object + 20 sky fibers, each one subtending 2.70′′ in diameter and covering a sky area of . A 300 diffraction grating was used, giving a spectral coverage of 6000 Å centered at 5700 Å and a spectral resolution of 19 Å, with a spectral dispersion of 6.2 Å . The observations were performed under medium seeing (1.5′′–2′′) conditions. The data reduction procedures included cosmic ray rejection, aperture tracing, spectra extraction, wavelength calibration, throughput correction, sky subtraction, atmospheric extinction correction and flux calibration. Since the vast majority of the flux is concentrated in one or two fibers, the spectrum has been obtained directly by combining their fluxes.
The absolute flux calibration must be treated with caution since the calibration star position within the fiber face could affect the amount of flux lost in the interfiber regions. The goodness of our relative photometry is shown by the comparison with the photometry of I03 (Figures 3 and 4).
Apart from WHT observation we have use data from the Keck and ARC telescopes (See Table 1), which has been kindly provided by Gordon T. Richards.
| Date | aaElapsed days from first observation. | Telescope | Ref. | Components |
|---|---|---|---|---|
| 2003 May 31 | 0 | Keck | R04 | ABCD |
| 2003 Nov 21 | 174 | ARCccAstrophysical Research Consortium (ARC) Telescope | R04 | AB |
| 2003 Nov 30 | 183 | ARC | R04 | AB |
| 2003 Dic 1 | 184 | ARC | R04 | AB |
| 2003 Dec 22 | 205 | ARC | R04 | AB |
| 2004 Jan 19 | 233 | WHT | - | ABCD |
| 2004 Mar 26 | 300 | ARC | R2bbSee Richards et al. (2004a) | AB |
3. Results
3.1. Comparison of A, B, and C spectra
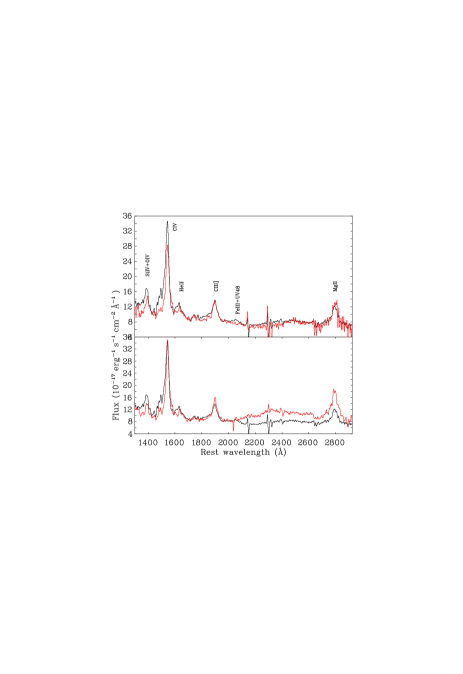
Inspection of Figure 1 reveals that: i) component A shows enhancements relative to components B and C in the blue wings of the high ionization emission lines (Si IV/O IV], C IV, He II, Al III, and UV48 Fe III complex) similar to those found by R04; ii) the A and B continua match very well in all the observed range although the C continuum exhibits an excess beyond 2000Å; iii) the low ionization lines, C III] and Mg II, match reasonably well with the same normalization factor as the continua; and iv) the EWs of the low ionization lines C III] and Mg II are larger in C than in A, and the EW of the C IV line is larger in C than in B.
3.2. Comparison with spectra of other epochs
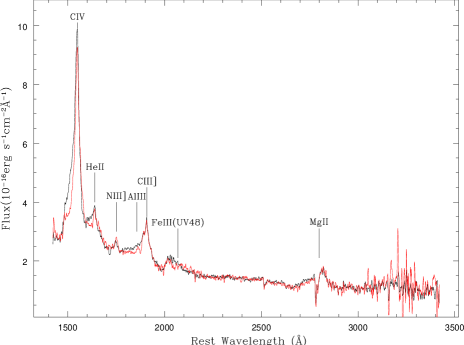
Seven spectroscopic observations were made on between 2003, May 31 and 2004, March 26 (See Table 1). The differences between the WHT spectra corresponding to components A and B are remarkably similar to those reported by R04 and Oguri et al. (2004) from Keck observations taken on 2003 May 31. A direct comparison, not shown here (See figures 3 and 4), among our spectra and the Keck 2003 data shows a very good global agreement for components A, B, and C. In the case of component A, some differences are found in C IV (the EW is larger in the WHT spectrum) and in He II (the blueward asymmetry is stronger in the Keck spectrum).
A direct comparison (not shown here) of the A and B ARC spectra based on the normalization of the continua shows that during the epoch 2003 November 21 to 2003 December 22 the blue excess disappears in the line of highest ionization (He II) and severely declines in CI V but it is still present in the lower ionization Al III and Fe III UV48 lines. The WHT observations show that the blue enhancements in component A again reached (on 2004 January 19) a level comparable to that of the Keck observations (2003 May 31). In Figure 2 we see that on 2004 March 26 the system shows similar features.
3.3. B-A and C-A magnitude difference curves
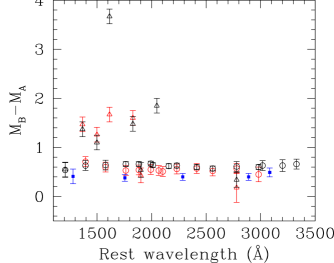
We estimate the flux ratio independently for the continuum and the emission lines. For the high ionization lines we have integrated only the blue half-side to enhance the asymmetries. To obtain the emission line flux we subtract a linear interpolation of the continuum from the regions adjacent to the lines. We then computed the continuum flux over intervals of 200 Å. The resulting magnitude differences, and , for both the continuum and the emission lines are presented in Figures 3 and 4.
In Figure 3 we present the WHT and Keck data. The agreement between both observations is quite remarkable. The small offset (0.05 mag) between the Keck and WHT continuum difference curves strongly constrains microlensing-induced continuum variability between both epochs (2003 May 31 and 2004 January 19). There is also good agreement (better than 0.05 mag with respect to the WHT continuum curve) with the photometric data by I03. This is reasonable also in terms of intrinsic variability if we take into account that the yearly intrinsic variation of this object could be of about 0.2 mag (according to the preliminary results of the photometric monitoring our group is performing), and that the predicted time delay between components A and B is about 1 month.
The differences for the low ionization lines (C III], Mg II) match (within errors) the continuum difference curve (there is some marginal evidence of a negative offset for the Mg II). This result does not support the existence of microlensing in the continuum. The blue half-sides of the high ionization lines are above the continuum with an offset of about 1 mag for the Si IV, C IV, Al III, and the UV48 Fe III complex. The blue half-side of the He II line shows a larger offset of about 3 mag respect to the continuum. Finally, there is no evidence of wavelength dependence of the continuum differences curve that have been invoked in several cases (see Wucknitz et al., 2003; Motta et al., 2002) to justify chromatic microlensing. This also excludes the possibility of differential dust extinction.
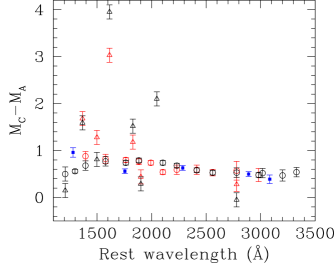
The difference magnitude curves are shown in Figure 4. The agreement between the WHT difference curve for the continuum and the photometric data by I03 is also remarkably good and does not support the existence of noticeable microlensing variability during the period between both observations. The Keck spectrum needed an offset of 0.8 mag to be matched to that of the I03 data. In Figure 4 the high ionization lines appear above the continuum but the low ionization lines do not match the continuum curve, which is mag above. An offset between the line and continuum quotients of two components of a gravitational lens has been interpreted as evidence for microlensing (see Mediavilla et al., 2005; Motta et al., 2002). If we assume that this hypothesis can be applied to the low ionization BEL and take into account that microlensing in the component A is for the same reason unlikely, we should accept that the continuum of component C is demagnified by microlensing. On the other hand, the continuum difference curve is not flat but shows a relative decrease in C with respect to A for shorter wavelengths (the color difference between components A and C has already been reported during the identification of the system as a multiple imaged QSO of large separation, see I03). This can be easily interpreted as dust extinction of component C (see e.g. Falco et al. 1999 & Muñoz et al. 2004). An interesting alternative possibility to explain the color differences around 2100Å and longer (See Figure 1) is UV FeII emission microlensed (magnified) in the C image and not in the others. The empirical iron emission template given by Vestergaard & Wilkes (2001) matches qualitatively the observed variation with wavelength. Both possibilities can be discriminated with future observations, since microlensing in the iron lines would show time variability but extinction would not.
4. B-A variability for the HeII and CIII] emission lines
In Figure 5 we present the values for the C III] and the HeII (blue half-side) emission lines corresponding to the seven epochs with spectra available (see Section 3.2). The value for the low ionization C III] line is almost constant (matching the value for the continuum; see previous section), whereas the He II emission line exhibits strong variability from a maximum during the first epoch, a posterior decay, and a final rise. It is very noticeable that the minimum of for the He II coincides with the baseline defined by the CIII].

5. Discussion and conclusions
The interpretation of the apparent recurrence of the blueward enhancement of the high ionization lines is challenging. If the enhancements were produced by intrinsic variability, they should appear with some delay in all components. However, observations do not reveal changes in the spectrum B that could be related to the blue wing asymmetries detected in A. On the other hand, the lack of continuum variability that may induce the change in the emission lines is also against this hypothesis.
Alternatively, the rising and fading of the blue wing enhancements can be explained by the relative displacement of a caustic network with respect to the BLR. However the displacement of the caustic across a kinematically structured BLR should induce velocity changes in the high ionization lines (R04) rather than recurrences like the one observed. Another inconvenience of the microlensing hypothesis is the very short time-scale for emission line variability. According to the observations, the He II blue wing excess was not present in the ARC 2003 December 22 spectrum but appears in the WHT spectrum taken on 2004 January 19 (See Figure 5) implying a rise time of less than one month, which reduces by a factor of 6 the upper limit inferred by R04 for the size of the amplified region under the hypothesis of microlensing. Richards et al. (2004b) estimated that the impact of microlensing in the A continuum was no more than 20% during the time spanned by their observations. Our comparison (see previous section) among the Inada et al. (2003), Keck, and WHT data indicates no traces of continuum variability during the period between 2003 May 2 and 2004 January 19. On one hand, this implies that the continuum microlensing time scale (if any), should be much larger than the one associated with high ionization line variability. On the other hand, (a) the agreement among the data corresponding to the low ionization lines and the continuum and (b) the apparent absence of microlensing chromaticity do not support this hypothesis. Thus, it seems that the process causing the variability of the high ionization lines does not affect the continuum. According to Lewis & Ibata (2004) and R04, microlensing by a caustic network can cause uncorrelated variability between the high ionization lines and the continuum. However, it is difficult to explain the absence of significant continuum microlensing ( mag) when the high ionization lines have undergone a complete cycle that in the case of the blue wing of He II implies differences of several magnitudes.
The decoupling between continuum and emission lines can be explained by supposing that the emission line region is formed by clouds of ionized gas moving at high velocity and/or considering a special geometry (biconical) for the BLR. This would favor the appearance of asymmetrical features and might explain the uncorrelated variability between emission lines and continuum. Even the possibility of microlensed transient events as SNs or shocks deserves consideration. We will explore these possibilities in a future work.
References
- Abajas et al. (2002) Abajas, C., Mediavilla, E., Muñoz, J. A., Popović, L. Č., & Oscoz, A. 2002, ApJ, 576, 640
- Arribas et al. (1998) Arribas et al., N. A. 1998, in Proc. SPIE Vol. 3355, p. 821-827, Optical Astronomical Instrumentation, Sandro D’Odorico; Ed., 821–827
- Chang & Refsdal (1979) Chang, K., & Refsdal, S. 1979, Nature, 282, 561
- Chang & Refsdal (1984) Chang, K., & Refsdal, S. 1984, A&A, 132, 168
- Chartas et al. (2002) Chartas, G., Agol, E., Eracleous, M., Garmire, G., Bautz, M. W., & Morgan, N. D. 2002, ApJ, 568, 509
- Chartas et al. (2004) Chartas, G., Eracleous, M., Agol, E., & Gallagher, S. C. 2004, ApJ, 606, 78
- Dai et al. (2003) Dai, X., Chartas, G., Agol, E., Bautz, M. W., & Garmire, G. P. 2003, ApJ, 589, 100
- Falco et al. (1999) Falco, E. E., et al. 1999, ApJ, 523, 617
- Inada et al. (2003) Inada et al., 2003, Nature, 426, 810
- Kaspi et al. (2000) Kaspi, S., Smith, P. S., Netzer, H., Maoz, D., Jannuzi, B. T., & Giveon, U. 2000, ApJ, 533, 631
- Lewis & Ibata (2004) Lewis, G. F. & Ibata, R. A. 2004, MNRAS, 348, 24
- Mediavilla et al. (2005) Mediavilla, E., Muñoz, J. A., Kochanek, C. S., Falco, E. E., Arribas, S., & Motta, V. 2005, ApJ, 619, 749
- Motta et al. (2002) Motta, V., Mediavilla, E., Muñoz, J. A., Falco, E., Kochanek, C. S., Arribas, S., García-Lorenzo, B., Oscoz, A., & Serra-Ricart, M. 2002, ApJ, 574, 719
- Muñoz et al. (2004) Muñoz, J. A., Falco, E. E., Kochanek, C. S., McLeod, B. A., & Mediavilla, E. 2004, ApJ, 605, 614
- Nemiroff (1988) Nemiroff, R. J. 1988, ApJ, 335, 593
- Oguri et al. (2004) Oguri et al. 2004, ApJ, 605, 78
- Ota et al. (2006) Ota et al., ApJ, accepted (astro-ph/0601700)
- Peterson & Wandel (2000) Peterson, B. M. & Wandel, A. 2000, ApJ, 540, L13
- Popović, Mediavilla & Muñoz (2001) Popović, L. Č., Mediavilla, E. G., & Muñoz, J. A. 2001, A&A, 378, 295
- Richards et al. (2004a) Richards, G., Johnston, D., & Hennawi, J. 2004a, IAU Circ., 8325, 2
- Richards et al. (2004b) Richards et al . 2004b, ApJ, 610, 679
- Schneider & Wambsganss (1990) Schneider, P. & Wambsganss, J. 1990, A&A, 237, 42
- Vestergaard & Wilkes (2001) Vestergaard, M., & Wilkes, B. J. 2001, ApJS, 134, 1
- Wandel et al. (1999) Wandel, A., Peterson, B. M., & Malkan, M. A. 1999, ApJ, 526, 579
- Wucknitz et al. (2003) Wucknitz, O., Wisotzki, L., Lopez, S., & Gregg, M. D. 2003, A&A, 405, 445
- Yonehara et al. (1999) Yonehara, A., Mineshige, S., Fukue, J., Umemura, M., & Turner, E. L. 1999, A&A, 343, 41