The infrared counterpart to the magnetar 1RXS J170849.0400910
Abstract
We have analyzed both archival and new infrared imaging observations of the field of the Anomalous X-ray Pulsar 1RXS J170849.0400910, in search of the infrared counterpart. This field has been previously investigated, and one of the sources consistent with the position of the AXP suggested as the counterpart. We, however, find that this object is more likely a background star, while another object within the positional error circle has non-stellar colors and shows evidence for variability. These two pieces of evidence, along with a consistency argument for the X-ray-to-infrared flux ratio, point to the second source being the more likely infrared counterpart to the AXP.
1 Introduction
The anomalous X-ray pulsars (AXPs) are a class of neutron stars, numbering about half a dozen, which are radio-quiet, with periods of the order s and estimated ages of to yr. Like the soft gamma-ray repeaters, they are thought to be magnetars, whose emission is powered by the decay of a super-strong magnetic field ( G). See Woods & Thompson (2004) for a review of the known magnetars and their properties.
While energetically, the emission at X-ray energies dominates, optical and infrared photometry of AXPs is giving interesting constraints on the physical processes of the stellar magnetospheres and environment. Recently, Wang et al. (2006) identified a mid-infrared and K-band excess around a magnetar, 4U 0142+61, which they interpret as thermal emission from a passively illuminate dusty fall-back disc. It would be interesting to see whether this is a generic property of the AXPs. If so, it might explain the consistency of K-band to soft X-ray flux ratios for most of the AXPs (Durant & van Kerkwijk, 2005a).
1RXS J170849.0400910 is a magnetar with 11s pulsations, discovered in the soft X-ray band by ROSAT and ASCA (Sugizaki et al. 1997). Recently, a hard X-ray component ( keV) to its spectrum has been found, which dominates the magnetar energetics (Kuiper at al. 2006).
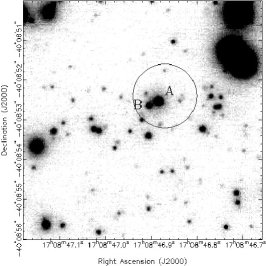
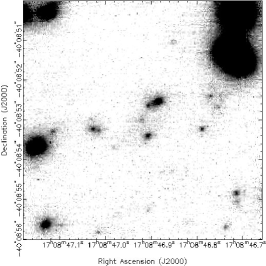
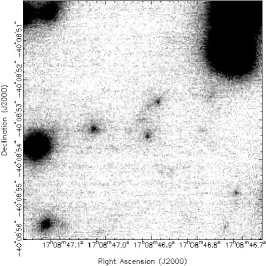
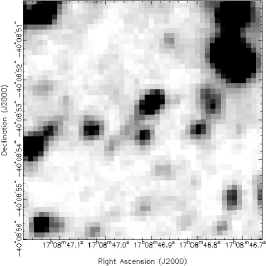
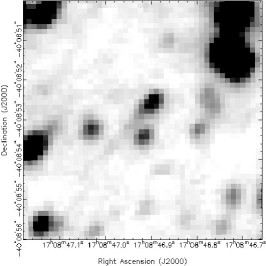
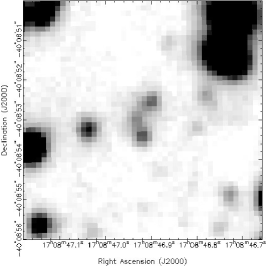
Israel et al. (2003) reported a tentative identification of the infrared counterpart to 1RXS J170849.0400910, based on near-infrared H- and K-band adaptive optics observations with the Adaptive Optics Bonette (AOB) on the Canada-France-Hawaii Telescope (CFHT), and further JHK photometry from the European Southern Observatory’s New Technology Telescope (ESO NTT). They found two possible faint counterparts in the positional error circle, Stars “A” and “B” separated by only 026 (see images below). Israel et al. suggested Star “A” was the more likely counterpart, based on its peculiar colors. Below, we present a re-analysis of their CFHT data, together with our own data and deep archival Very Large Tetescope (VLT) imaging. We first describe these datasets and our analysis methods, followed by the lines of argument which lead to our conclusion that in fact the true counterpart is Star “B”.
2 Observation and Analysis
We analyzed observations made with Magellan/PANIC and archival observations from CFHT/AOB and VLT/NACO (see Table 1 and below for details). The Magellan observations provide the widest field of view, and a uniform PSF and background; they are therefore the best images to base our photometric calibration on. The CFHT and VLT observations both made use of adaptive optics (AO) in order to reduce the size of stellar PSFs and thus increase the signal to noise ratio as well as reduce the problem of blending. Unfortunately, this comes at the cost of a PSF which has a complicated shape and varies with position on the image (particularly for shorter wavelengths). We thus calibrate the AO images using Magellan as our baseline.
| Date | Telescope | Instrument | Filter | Exposure Time (s) | FWMHaaTypical stellar profile size in arcsec. For AO images, measured close to the stars on interest. |
|---|---|---|---|---|---|
| 2002-08-17 | CFHT | AOB/KIR | K’ | 0.14 | |
| H | 0.14 | ||||
| 2003-06-06 | Magellan Clay | PANIC | J | 0.44 | |
| H | 0.35 | ||||
| KS | 0.31 | ||||
| 2003-06-07 | Magellan Clay | PANIC | J | 0.38 | |
| H | 0.4 | ||||
| Y | 0.36 | ||||
| MagIC | I | 0.44 | |||
| 2003-06-20 | VLT-UT3 | NA-CO | J | 0.11 | |
| H | 0.10 | ||||
| KS | 0.08 |
2.1 Magellan
We imaged 1RXS J170849.0400910 in the KSHJ bands using PANIC (Persson’s Auxilliary Nasmyth Infrared Camera; Martini et al., 2004) on the Magellan Clay Telescope, at Las Campanas, Chile. PANIC is a 10241024 Hawaii infrared array with 0125 pixels.
The conditions were good to excellent, with seeing between 030 and 045 (see Table 1). We also obtained further imaging in the I-band using MagIC (the Raymond and Beverly Sackler Magellan Imaging Camera111see http://occult.mit.edu/instrumentation/magic/; Schectman & Johns, 2003), but neither this nor the Y-band were sufficiently deep to detect Stars A and B and are not considered further. (For completeness, we note that for the I band, where we have photometric callibration, the 95% confidence detection limit is ).
We reduced the images in a standard way, by first subtracting off a dark frame from each raw image, flat-fielding using the median of the images, and then registering and combining them. For the H- and J-bands, we select the better of each of the two final images (from the and , respectively) for analysis rather than combine the images from both nights, since the inclusion of the slightly poorer images leads to at best a marginal improvement in the signal-to-noise ratios. The final JHKS images we use are shown in Figure 1.
We carried out PSF-fitting photometry on each stacked image using DAOPHOT (Stetson, 1987), using isolated sources on the image to model the PSF. To calibrate the photometric zero points, we imaged standard stars P576-F, S165-E, S264-D and S279-F (Persson at al. 1998), took photometry in a large aperture containing most of the flux and aperture-corrected the science-frame PSFs using aperture photometry on the PSF stars (after subtraction of neighboring fainter stars). We estimate the uncertainty in the photometric zero points to be 0.025 mag for each band. For future reference, we give the photometry and positions for a number of stars in the field in Appendix A.
To find the astrometric solutions for our images, we identified stars from the Guide Star Catalog (GSC) 2.2222Vizier Catalogue I/271 on our J-band image. With 24 stars, the RMS residuals in the solution were in each co-ordinate. The systematic uncertainty in the GSC astrometry is 02 to 04, so our total uncertainty in transforming the Chandra position reported by Israel at al. (2003) (accurate to 07) is 08 at 90% confidence. This positional error circle is shown in Figure 1. We found astrometric solutions for the rest of our images by tying them to the Magellan J-band image, which introduces negligible additional uncertainties. Stars A and B are the two brightest sources within the error circle. Their positions are (, -40°08′5253) for Star A and (, -40°08′5264) for Star B. (Here the relative positions are accurate to the digits given, as measured from the NACO K-band image below, and are on the same astrometric system as the positions listed in Appendix A from Magellan.)
The separation between Star A and Star B is only 026 (measured from the NACO images below), and so they can only be measured individually in the K-band, where there is the most flux and the seeing was best. Even so, one might expect that the magnitude of the fainter Star B is poorly measured. Star A’s magnitude, however, should be robust and not affected by the proximity of Star B. For the H and J bands, Star B could not be measured, but this should not affect the magnitudes for A too much since the AO images show that Star B is over a magnitude fainter in both bands. The final magnitudes are shown in Table 2.
2.2 CFHT
We retrieved from the CADC archive and re-analyzed the CFHT images presented by Israel et al. (2003). The AOB uses a wavefront sensor and deformable mirror to correct for atmospheric distortions, as measured from a natural guide star. The corrected beam is sent through to the KIR detector, a Hawaii array with 0035 pixels (see Rigaut et al. 1996). The final reduced stacked images were created in a standard manner as above; the result is shown in Figure 1.
The region of interest is about 125 off-axis with respect to the (fairly faint) AO guide-star and the field is never below an airmass of 1.9 from CFHT. The AO correction is therefore far from optimal, and the isoplanatic patch is smaller than the field of view. This means that the PSF varies from something core-dominated near the guide star (ideally an Airy pattern) to something more Gaussian at the furthest point. At no place on the image does the PSF fit a simple analytic model. This makes photometry difficult, whether by PSF fitting or by integrating in fixed-sized apertures.
In order to photometer Stars A and B on the CFHT images, we constructed a PSF based on the average of many stars across the field with a Lorentzian analytic portion, which hopefully will be a reasonable fit in the field center. Even though this fit will not be particularly good, Stars A and B will share the same true PSF (being so close together), and their relative magnitudes will be accurate. Note that although DAOPHOT does have the ability to handle a PSF which varies across the image, there were not enough PSF stars available on a relatively small field of view for this to work.
In order to calibrate our magnitudes, we calculated the magnitude offset relative to the calibrated Magellan images (above) for a number of isolated stars near to and roughly circularly distributed around the area of interest. Although the magnitudes show a fair amount of scatter ( mag in each band), with some systematic trends with position, the average offset is well determined and should be suitable for calibrating the two stars of interest. We estimate a total uncertainty in the photometric zero points of 0.03 mag in each band. See Table 2 for the final calibrated magnitudes.
Although the KS-band and the K’ band do not exactly overlap, they are close enough that an error due to this is negligible compared to the uncertainty in the photometric zero point above. We see no significant trend in the zero-point offset with color.
2.3 VLT/NACO
The source was imaged in three bands using NAOS-CONICA, the Nasmyth Adaptive Optics System and Near-Infrared Camera on VLT Unit telescope 4 (NACO: see Lenzen et al. 2003; Rousset et al. 2002). CONICA is a 1024 pixel square Aladdin detector (with 0027 pixel scale).
We retrieved these data from the ESO archive and reduced them in a similar way to that above. The signal-to-noise ratio of individual stars is much better than for the CFHT observations (see Figure 1). The isoplanatic patch is once more smaller than each of the images (particularly for the J-band), so we compare the (instrumental) magnitude offsets a set of isolated, well-measured stars near Stars A and B to those measured with Magellan. The final calibrated magnitudes and errors are shown in Table 2. We stress once more that while these magnitudes include systematic uncertainty from the calibration of the magnitude zero-points, the relative magnitudes between Stars A and B within an image are very well determined.
| Observation | |||||||
|---|---|---|---|---|---|---|---|
| Magellan/PANIC | 20.83(10) | 18.75(5) | 17.45(4) | 19.26(16)bbThis measurement is likely affected by the proximity of Star A | 1.81(16) | ||
| CFHT/AOB | 18.82(6) | 17.52(5)aaThe K’ band is very close to the more common KS band. | 20.29(13) | 19.02(8)aaThe K’ band is very close to the more common KS band. | 1.50(6) | ||
| VLT/NACO | 20.88(9) | 18.75(6) | 17.52(3) | 21.89(14) | 20.19(7) | 18.86(3) | 1.344(15) |
Note. — Numbers in parentheses indicate errors in the last digit
3 Results
We find that the observations above present three items of evidence that the real counterpart to 1RXS J170849.0400910 is Star B rather than Star A as previously reported by Israel et al (2003). These items may not be conclusive individually, but together make, we argue, a compelling case. They are discussed separately below. The only argument which favors Star A is that it lies closer to the center of the positional error circle, but both lie within the 90% confidence radius.
Before discussing our lines of argument, we should mention that the magnitudes we found for Star B are in disagreement with those presented by Israel et al. (2003), but our magnitudes for Star A are in good agreement (especially with the NTT data; note that in the published paper, there was a typo: the magnitude of Star A from the NTT should have been ; Israel, 2005 pers. comm.). We suspect that the discrepancy is due to the use of the on-axis PSF for measuring the stars (the authors claim a 012 FWHM, but this is not the case at 125 from the guide star). With our procedure of using stars close to the sources to create the PSF, and with the much better signal-to-noise ratio with the NACO images, we believe our photometry highly accurate, particularly for the relative magnitudes of Stars A and B.
In Appendix A we also list photometry for faint sources in or near the positional error circle, which are detected only in the VLT/NACO K-band image. Without color information or previous measurements, it is not possible to judge the likelyhood of one of these being the AXP counterpart, except that they would imply a very large X-ray to infrared flux ratio in comparison to other AXPs. Given the arguments in favour of Star B being the counterpart below, we do not consider these faint sources further, but list their measurements in the Appendix for completeness.
3.1 Variability
The relative magnitudes () given in Table 2 are independent of the photometric calibration performed, and show that one of the two stars has varied (at 3- significance).
From the magnitudes of the individual stars, it would appear that Star A shows no significant variability in any band, whereas Star B apparently brightened. The NACO K-band magnitude is inconsistent at the 2 level with that from CFHT, and at the 1.9 level with that from Magellan. A slight brightening is also seen in the H-band, but this is not statistically significant. Together, it seems highly likely that Star B has varied.
As a check, the K-band magnitudes of Star 2 (see Figure 3) from Magellan, CFHT and VLT are 18.74(8), 18.88(8) and 18.75(3) respectively. This shows that this field star is consistent with a constant brightness, and that the uncertainties in the magnitudes are reasonable.
Variability, especially in the K-band is a generic property of AXPs (Israel et al. 2002; see also Hulleman et al, 2004, Tam et al., 2004, Durant & van Kerkwijk, 2005a), so this hint of variability in Star B and not in Star A is a point in favor of Star B being the true counterpart.
3.2 Stellar colors
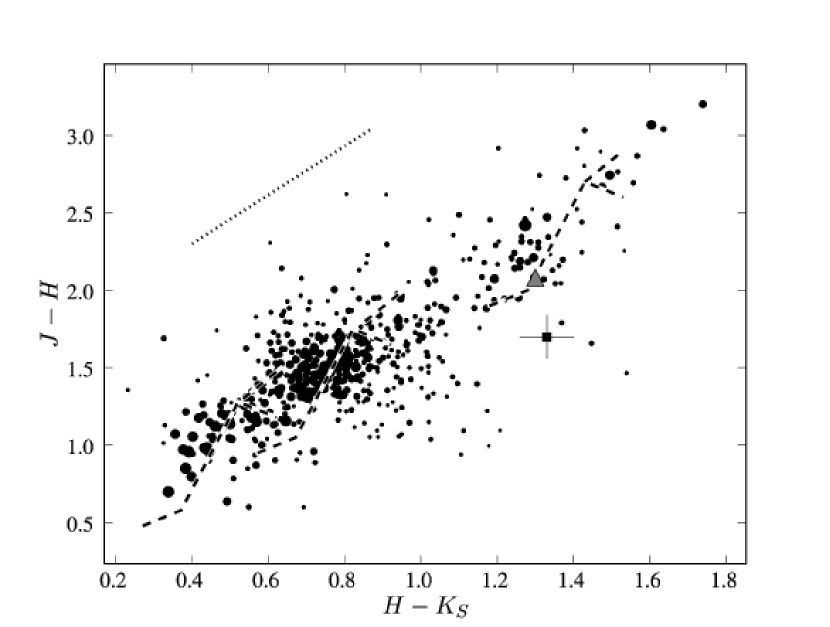
Figure 2 shows all the stars in the Magellan images on a color-color diagram (after a cut on the goodness-of-fit diagnostic to reject the worst measured 10% of stars). Star A has been plotted using its Magellan photometry, and Star B using its VLT/NACO magnitudes relative to Star A (since Star A has not been seen to vary, this should be secure).
Three different groups of stars with , 10.5 and 20 can be seen in Figure 2. Main sequence and red giant sequences are shown for these values of reddening. The first two groups are expected from our analysis of the run of reddening with distance in this direction (Durant & van Kerkwijk, 2006b). Star A appears to inhabit the most reddened group of stars (), with a distance kpc. Star B is, however, unusual: less than 5% of field stars (about 20 out of 450 in the 40″ square region of analysis) are as far from the expected stellar sequences. Star B does not fit stellar colors at any reddening.
Other AXPs show non-stellar colors (e.g. Hulleman et al., 2004) and similar colours have been seen in the infrared for 1E 1048.15937 (, ; Wang & Chakrabarti, 2002) as well as 4U 0142+61 (, ; Israel et al. 2004). It is unlikely for an ordinary star to occupy the same region of parameter space as Star B. Its position is consistent with an infrared excess, possibly from dust emission, as has been found for 4U 0142+61 by Wang et al. (2006). The probability of a chance coincidence of a star with such colors in the positional error circle is small (2.5%).
The color-color diagram hence offers further support for Star B being the infrared counterpart to 1RXS J170849.0400910.
3.3 X-ray to infrared flux ratio
For the four other AXPs with infrared counterparts, we found that they were remarkably similar in their X-ray (2–10 keV) to K-band flux when not in outburst (Durant & van Kerkwijk, 2005a): all have (1E 1048.15937, 4U 0142+61, 1E 2259+589 and XTE J1810197).
If Star A were the counterpart to 1RXS J170849.0400910, this would imply a flux ratio , whereas for Star B we get (for the range of magnitudes) . (Here we used erg s-1cm-2 [Woods & Thompson, 2004] and cm-2 [Durant & van Kerkwijk, 2006a]). Only the latter value is in the same range as the other AXPs, which suggests Star B is the more likely infrared counterpart.
4 Conclusions
We presented three lines of evidence that suggest that Star B is the true counterpart to 1RXS J170849.0400910: its variability, its unusual stellar colors and the consistency with other AXPs for its inferred X-ray to infrared flux ratio. Of these, the colors are perhaps the strongest piece of evidence. Together they strongly support the identification of Star B as the counterpart.
Despite their proximity on the sky, it seems unlikely that Stars A and B are physically associated. The hydrogen column for 1RXS J170849.0400910 of cm-2 is equivalent to a visual extinction (Durant & van Kerkwijk, 2006a), which is hard to reconcile with the reddening of 20 for Star A from its colors.
With this addition, all but one of the AXPs now have securely identified optical/infrared counterparts (with the exception being 1E 1841045; see Durant, 2005). Intriguingly, the sources appear to be rather similar in some of their properties: they have similar X-ray luminosities (Durant & van Kerkwijk, 2006b) and similar K-band to X-ray flux ratios. From the three sources with optical counterparts however, there appear to be different X-ray to optical flux ratios. While compared to 4U 0142+61, 1E 1048.15937 has a similar X-ray to I-band flux ratio, CXOU J010043.1721134 has a significantly lower X-ray to V-band flux ratio (Durant & van Kerkwijk, 2005b). This suggests that the optical and infrared emission are produced by different mechanisms, with the infrared more closely tied to the X-ray. The idea of Wang et al. (2006) of infrared emission coming from a passively illuminated dusty fall-back disc at the sublimation radius would seem to be consistent with these data.
Acknowledgments: This work made use of the CFHT archive hosted by CADC, of the ESO VLT archive (for programme 71.D-0503) and of the Vizier archive service of the CDS. We used astrometric information from the Guide Star Catalog 2.2 by the Space Telescope Science Institute and Osservatorio Astronomico di Torino. We acknowledge financial support by NSERC.
Appendix A Photometry
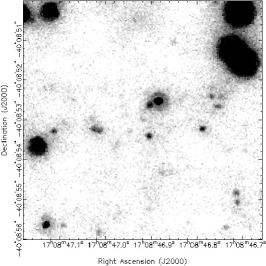
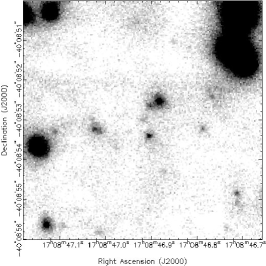
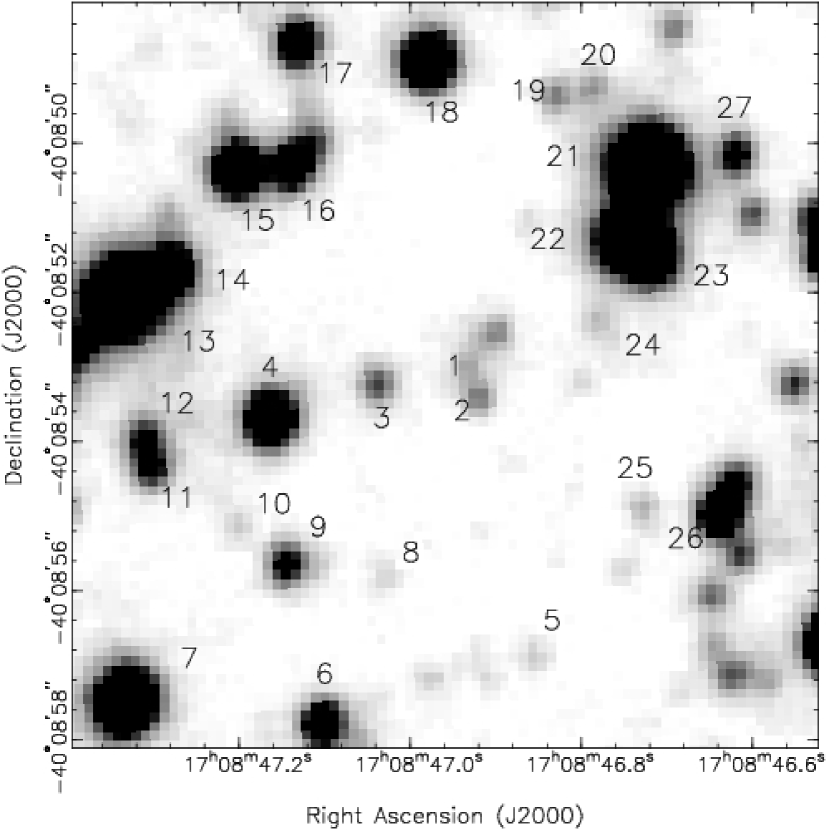
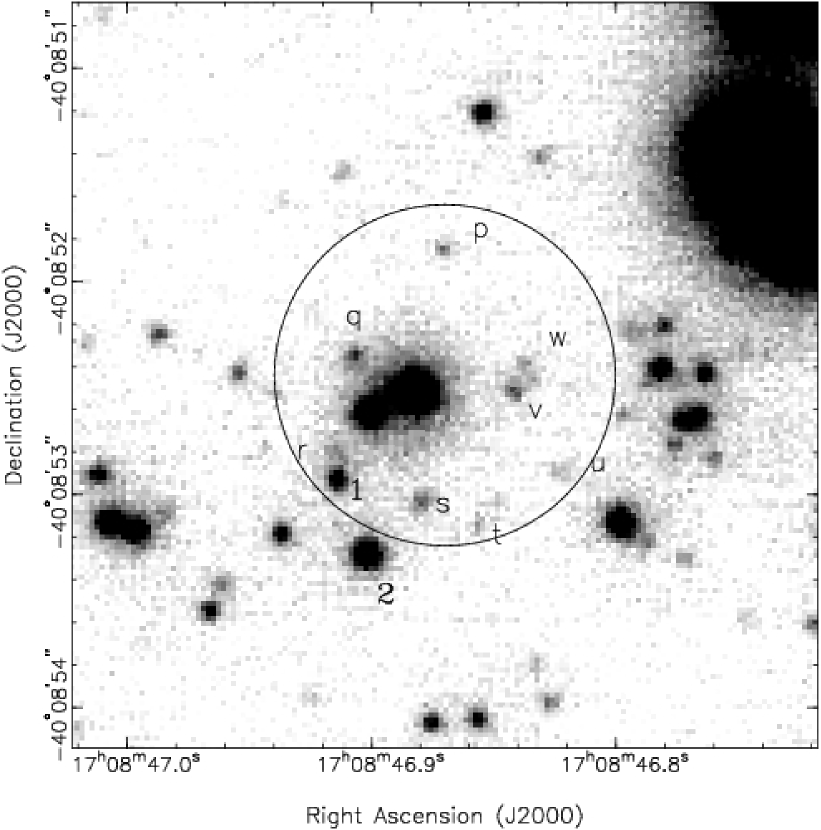
In Table 3 we list the Magellan JHK magnitudes and positions of stars in the field, as labeled in Figure 3. In Table 4 we list the K-band magnitudes and positions of faint sources detected in or around the position error circle, as measured in the VLT/NACO observations (Figure 4). None of these sources were detected in H or J, with limits , respectively, at 95% confidence.
| IDaaAs shown in Figure 3 | R.A. (J2000) | dec (J2000) | |||
|---|---|---|---|---|---|
| 1 | 17:08:46.919 | -40:08:52.97 | 21.28(18) | 20.6(2)bbMeasured from the NACO images, because of the proximity of other sources. | 20.02(6)bbMeasured from the NACO images, because of the proximity of other sources. |
| 2 | 17:08:46.912 | -40:08:53.41 | 20.81(11) | 19.34(9) | 18.74(7) |
| 3 | 17:08:47.029 | -40:08:53.24 | 20.38(7) | 19.30(9) | 18.48(5) |
| 4 | 17:08:47.153 | -40:08:53.69 | 18.067(10) | 17.216(12) | 16.833(13) |
| 5 | 17:08:46.846 | -40:08:56.89 | 21.8(3) | 19.53(11) | 18.33(5) |
| 6 | 17:08:47.088 | -40:08:57.79 | 18.98(2) | 16.352(6) | 15.005(3) |
| 7 | 17:08:47.322 | -40:08:57.48 | 17.201(5) | 15.601(3) | 14.793(3) |
| 8 | 17:08:47.022 | -40:08:55.82 | 22.0(4) | 20.4(3) | 19.63(17) |
| 9 | 17:08:47.131 | -40:08:55.65 | 19.73(4) | 18.48(4) | 17.92(3) |
| 10 | 17:08:47.190 | -40:08:55.12 | 21.9(3) | 20.3(3) | 19.35(14) |
| 11 | 17:08:47.292 | -40:08:54.35 | 19.82(4) | 18.48(4) | 17.80(3) |
| 12 | 17:08:47.300 | -40:08:53.96 | 19.85(4) | 18.43(4) | 17.72(3) |
| 13 | 17:08:47.329 | -40:08:52.07 | 16.316(2) | 15.471(3) | 14.980(3) |
| 14 | 17:08:47.270 | -40:08:51.70 | 18.293(12) | 16.036(5) | 14.838(3) |
| 15 | 17:08:47.190 | -40:08:50.35 | 18.077(10) | 16.997(10) | 16.445(9) |
| 16 | 17:08:47.124 | -40:08:50.28 | 18.850(19) | 17.512(15) | 16.85(13) |
| 17 | 17:08:47.124 | -40:08:48.65 | 18.867(19) | 18.23(3) | 17.74(3) |
| 18 | 17:08:46.970 | -40:08:48.88 | 17.829(8) | 15.814(4) | 14.620(3) |
| 19 | 17:08:46.816 | -40:08:49.36 | 20.84(11) | 19.50(7) | 18.72(7) |
| 20 | 17:08:46.772 | -40:08:49.27 | 21.11(14) | 19.62(11) | 18.88(9) |
| 21 | 17:08:46.714 | -40:08:50.30 | 16.189(2) | 15.520(3) | 15.223(3) |
| 22 | 17:08:46.728 | -40:08:51.27 | 16.745(4) | 15.990(4) | 15.624(3) |
| 23 | 17:08:46.699 | -40:08:51.59 | 19.01(2) | 16.592(7) | 15.319(3) |
| 24 | 17:08:46.765 | -40:08:52.44 | 21.5(2) | 19.82(16) | 18.68(7) |
| 25 | 17:08:46.714 | -40:08:54.90 | 21.5(2) | 19.87(17) | 18.85(9) |
| 26 | 17:08:46.626 | -40:08:54.98 | 18.829(18) | 17.719(19) | 17.241(19) |
| 27 | 17:08:46.611 | -40:08:50.16 | 19.73(4) | 18.23(3) | 17.52(2) |
Note. — Numbers in parentheses indicate errors in the last digit, and do not include photometric zero-point uncertainties (approximately 0.025 mag in each band). Positions are in hours for R. A. and degrees for declination. All data from Magellan imaging. For Stars A and B see Table 2
| IDaaAs shown in Figure 4 | R.A. (J2000) | dec (J2000) | |
|---|---|---|---|
| p | 17:08:46.875 | -40:08:51.75 | 21.12(13) |
| q | 17:08:46.912 | -40:08:52.33 | 20.93(11) |
| r | 17:08:46.926 | -40:08:52.85 | 21.6(2) |
| s | 17:08:46.882 | -40:08:53.11 | 20.76(9) |
| t | 17:08:46.853 | -40:08:53.25 | 21.40(17) |
| u | 17:08:46.816 | -40:08:52.96 | 21.6(2) |
| v | 17:08:46.838 | -40:08:52.52 | 20.85(10) |
| w | 17:08:46.838 | -40:08:52.38 | 21.36(17) |
Note. — Numbers in parentheses indicate errors in the last digit, and do not include photometric zero-point uncertainties (approximately 0.03 mag).
References
- (1) Bessell, M., Brett, J., 1988, PASP, 100, 1134
- (2) Durant, M., & van Kerkwijk, M., 2005, ApJ, 632, 563
- (3) Durant, M., & van Kerkwijk, M., 2005a, ApJ, 627, 376
- (4) Durant, M., & van Kerkwijk, M., 2005b, ApJ, 628, L135
- (5) Durant, M., & van Kerkwijk, M., 2006a, ApJ, submitted
- (6) Durant, M., & van Kerkwijk, M., 2006b, ApJ, submitted
- (7) Hulleman, F., van Kerkwijk, M., & Kulkarni, S., 2004, A&A, 416, 1037
- (8) Israel, G., Covino, S., Stella, L., Campana, S., Marconi, G., Mereghetti, S., Mignani, R., Negueruela, I., Oosterbroek, T., Parmar, A., Burderi, L., Angelini, L., 2002, ApJ, 580, L143
- (9) Israel, G., Covino, S., Perna, R., Mignani, R., Stella, L., Campana, S., Marconi, G., Bono, G., Mereghetti, S., Motch, C., Negueruela, I., Oosterbroek, T., Angelini, L., 2003, ApJ, 589, L93
- (10) Israel, G., Stella, L., Covino, S., Campana, S., Angelini, L., Mignanini, R., Mereghetti, S., Marconi, G., Penna, R., 2004, IAU Symposium 218
- (11) Kuiper, L., Hermsen, W., den Hartog, P., Collmar, W., 2006, ApJ accepted, astro-ph/0603467
- (12) Lenzen, R., Hartung, M., Brandner, W., Finger, G., Hubin, N., Lacombe, F., Lagrange, A., Lehnert, M., Moorwood, A., Mouillet, D., 2003, SPIE, 4841, 944
- (13) Martini, P., Persson, S., Murphy, D., Birk, C., Shectman, S., Gunnels, S., Koch, E., 2004, Proc SPIE, 5492, 1653
- (14) Persson, S., Murphy, D., Krzeminski, W., Roth, M., Rieke, M., 1998, AJ, 116, 2475
- (15) Rigaut, F., Salmon, D., Arsenault, R., Thomas, J., Lai, O., Rouan, D., Veéran, J., Gigan, P., Crampton, D., Fletcher, J., Stilburn, J., Boyer, C., Jagourel, P.
- (16) Rousset, G., Lacombe, F., Puget, P., Hubin, N., Gendron, E., Fusco, T., Arsenault, R., Charton, J., Feautrier, P., Gigan, P., Kern, P., Lagrange, A., Madec, P., Mouillet, D., Rabaud, D., Rabou, P., Stadler, E., Zins, G., 2003, SPIE, 4839, 140
- (17) Shectman, S., & Johns, M., 2003, Proc SPIE, 4837, 910
- (18) Schlegel, D., Finkbeiner, D., Davis, M., 1998, ApJ, 500, 525
- (19) Stetson, P., 1987, PASP, 99, 191
- (20) Space Telescope Science Institute (STScI) & Osservatorio Astronomico di Torino, 2001, Vizier catalog I/271
- (21) Sugizaki, M., Nagase, F., Torii, K., Kinugasa, K., Asanuma, T., Matsuzaki, K., Koyama, K., Yamauchi, S., 1997, PASJ, 49, L25
- (22) Tam, C., Kaspi, V., van Kerkwijk, M., Durant, M., 2004, ApJ, 617, L53
- (23) Wang, Z. & Chakrabarty, D., 2002, ApJ, 579, L33
- (24) Wang, Z., Chakrabarty, D., Kaplan, D., 2006, Nature, 440, 772
- (25) Woods, P., & Thompson, C., 2004, in “Compact Stellar X-ray Sources” eds Lewin W. and van der Klis, M.