Molecular Line Emission from Gravitationally Unstable Protoplanetary Disks
Abstract
In the era of high resolution submillimeter interferometers, it will soon be possible to observe the neutral circumstellar medium directly involved in gas giant planet (GGP) formation at physical scales previously unattainable. In order to explore possible signatures of gas giant planet formation via disk instabilities, we have combined a 3D, non-local thermodynamic equilibrium (LTE) radiative transfer code with a 3D, finite differences hydrodynamical code to model molecular emission lines from the vicinity of a 1.4 MJ self-gravitating proto-GGP. Here, we explore the properties of rotational transitions of the commonly observed dense gas tracer, HCO+. Our main results are the following: 1. Very high lying HCO+ transitions (e.g. HCO+ J=7-6) can trace dense planet forming clumps around circumstellar disks. Depending on the molecular abundance, the proto-GGP may be directly imageable by the Atacama Large Millimeter Array (ALMA). 2. HCO+ emission lines are heavily self-absorbed through the proto-GGP’s dense molecular core. This signature is nearly ubiquitous, and only weakly dependent on assumed HCO+ abundances. The self-absorption features are most pronounced at higher angular resolutions. Dense clumps that are not self-gravitating only show minor self-absorption features. 3. Line temperatures are highest through the proto-GGP at all assumed abundances and inclination angles. Conversely, due to self-absorption in the line, the velocity-integrated intensity may not be. High angular resolution interferometers such as the Submillimeter Array (SMA) and ALMA may be able to differentiate between competing theories of gas giant planet formation.
Subject headings:
planetary systems: protoplanetary disks — planetary systems: formation — line: formation — line: profiles — radiative transfer – circumstellar matter1. Introduction
Since the discovery of 51 Pegasus, there have been numerous detections of Jupiter-sized extrasolar planets through radial velocity experiments, transiting of parent stars and direct imaging (for recent reviews, see Udry, Fischer & Queloz, 2006, Charbonneau et al. 2006 and Beuzit et al. 2006).
Concomitant to the problem of characterizing the nature of these gas giant planets (GGPs) is developing the theoretical constructs which describe the nature of GGP formation. Two major theories have been developed concerning the physics of GGP formation. Core accretion begins with the formation of planetesimals through the collisional coagulation and sticking of progressively larger solid bodies in the circumstellar environment. Once kilometer sized planetesimals are formed, runaway accretion to Mars-sized bodies can occur. When the planetary embryos reach a mass of ten Earth masses or so, disk gas is accreted dynamically, resulting in GGP formation. Core accretion is the generally favored mechanism for forming Jupiter and Saturn (Pollack et al. 1996; Goldreich, Lithwick, & Sari, 2004a). The core accretion model has been challenged in explaining how a solid core can form on timescales less than the disk dissipation times of 106-107yr (Pollack et al. 1996; Ikoma, Nakazawa, & Emori, 2000). However it should be noted that recent models by Rafikov (2003) and Goldreich, Lithwick & Sari (2004b) have suggested a core accretion mechanism that is not incompatible with the short-lived disk lifetimes. Additional problems of the core-accretion model include resolving theoretical GGP core masses with those of Jupiter and Saturn (Mejia, 2004; Saumon & Guillot, 2004).
As an alternative to core-accretion, the disk instability mechanism has been investigated in many models by Boss (2001, 2004), Mejia (2004), and Mayor et al. (2005). In this theory, marginally unstable gaseous disks contract gravitationally to form GGPs. Models of gravitationally unstable disks suggest planets can form on rapid (103 yr) time scales (Boss 1997, 1998), but require disks to cool efficiently in order for gravitationally bound clumps to form. Boss (2004) has shown that convective cooling through protoplanetary disks can be quite efficient. Hybrid mechanisms for GGP formation have been suggested as well (Currie, 2005).
It is clear that both leading theories in the formation of GGPs have their shared successes and challenges in current models. Observations of protoplanetary disks will be key in constraining the two models. Because the gravitational instability method involves the accumulation of large clumps of cool gas from the circumstellar disk, molecular line observations may be helpful in revealing the nature of GGP formation. Indeed, in the era of high-resolution millimeter and submillimeter wave interferometers, clumps of cool and dense gas may indeed be directly imageable in nearby circumstellar disks.
Rotational transitions (+1) in interstellar molecules have long been used to better understand the nature of cold gas in star-forming environments (for a recent review, see Evans, 1999). Serving as a proxy for the observationally elusive molecular hydrogen (H2), excitation analysis of lines from molecules such as CO, CS, HCO+, HCN and others can provide diagnostics for the physical conditions in the cold molecular gas.
Through the use of submillimeter and millimeter wave interferometers, direct imaging of cold circumstellar disks have recently been made possible (e.g. Patel. et al. 2005, Qi et al. 2004). Submillimeter molecular line emission has been used to estimate molecular depletion factors (e.g. Andrews & Williams, 2005; van Zadelhoff et al., 2001), as well as provide information concerning kinematics in the circumstellar environment (e.g. Qi et al. 2003). It is additionally possible to constrain disk molecular gas masses through such observations (e.g. Hogerheijde et al. 2002). Recent CO (J=6-5) observations of TW Hya by Qi et al. (2006) has shown that molecular excitation can be quite high due to the dense gas present in protoplanetary disks.

In addition to observational data sets of molecular line emission from protoplanetary disks, radiative transfer modeling of the emission patterns can provide powerful constraints as to the physical conditions in the molecular gas. As an example, Qi et al. in the aforementioned study of TW Hya used a 2D non-LTE Monte Carlo model to derive vertical temperature distributions in the disk. Similar studies have been performed to calculate temperature and/or density distributions by Kessler (2004), and Semenov et al. (2005), among many others.
In order to fully utilize the new generation of interferometers to probe planet formation, submillimeter and millimeter wave emission modeling of GGP forming disks is needed. Progressive works by Wolf & D’Angelo (2005), Moro-Martin, Wolf & Malhotra (2005), and Varniere et al. (2006) have studied the effects of protoplanets in disks on infrared SEDs through the use of radiative transfer modeling. A necessary complementary dataset to these works is models of molecular line emission from planet forming circumstellar disks.
In this study, we take the first step in this direction by applying a newly developed 3D non-LTE radiative transfer code to a model of a gravitationally unstable protoplanetary disk (Boss, 2001). We will discuss the emission patterns by way of contour maps and emission line profiles. This paper is organized as follows: in §2, we discuss the numerical methods involved concerning hydrodynamics, radiative transfer, and chemistry; in §3 we present synthetic images of HCO+ emission in the disk; in §4 we discuss emission line profiles; in §5 we briefly discuss spectral maps and in §6 we summarize.
2. Numerical Methods
2.1. Hydrodynamics

We have run three dimensional hydrodynamic models using a finite-differences code to model the gravitationally unstable protoplanetary disk as fully described in Boss (2001). The code has been shown to be accurate to second order in space and time (Boss & Myhill 1992). The spherical grid is uniformly spaced in the radial direction between 4 and 20 AU. The azimuthal grid is uniform, and the polar grid spaced such that the resolution grows toward the midplane (with a maximum resolution of =0.3). The model includes a central protostar of 1 M☉ and a disk of 0.091 M☉. The protostar wobbles in response to the evolving disk, such that the center of mass of the system is preserved. The initial disk surface density is assumed to vary with radius as to through the inner disk, and in the outer disk. The initial density distribution is seeded with perturbations of the form cos() where =1,2,3,4 with an amplitude of 0.01. Random noise is included at a lower amplitude.
2.2. Radiative Transfer
We build the emergent spectrum by integrating the equation of radiative transfer over numerous lines of sight through the hydrodynamic snapshot (e.g. Walker, Narayanan & Boss 1994). The solution to the equation of radiative transfer has the numerical form
| (1) |
where is the source function, and is the optical depth. If local thermodynamic equilibrium (LTE) conditions hold, then the source function can be replaced by the Planck function. LTE is a fair approximation when the density is much greater than the critical density and collisions thermalize the gas, e.g.
| (2) |
where is the Einstein rate coefficient for spontaneous emission, are the collisional rate coefficients, and , correspond to the upper and lower states of a given transition. However, when considering either low density environments, or molecular species with high dipole moments (and thus high Einstein coefficients), the approximation of LTE may no longer hold. In these situations, the source function must be calculated explicitly.
In order to find the source function, an iterative procedure can be employed. We have developed a three-dimensional non-LTE radiative transfer code based on the Monte Carlo method. The first work to detail a Monte Carlo algorithm for non-LTE line transfer was by Bernes (1979). Future workers improved the algorithms and expanded to two and three dimensions (Choi et al. 1995, Juvela et al. 1997 Park & Hong 1998, Hogerheijde & van der Tak 2000, Schoier, 2000). Monte Carlo techniques in radiative transfer are powerful in that they offer a large amount of flexibility for different geometries and are easily parallelized. Due to the statistical nature of Monte Carlo, the solutions include shot noise, and can be slow to converge in cases of high (100) optical depths.
The non-LTE radiative transfer code we have developed operates on the following principles, adapted from Bernes (1979): the goal is to solve for the steady state distribution of energy states among the molecules. Once these level populations are known, the source function for a given transition can be calculated by:
| (3) |
where are the Einstein rate coefficients for absorption and stimulated emission. However, the problem is circular: the level populations in any grid cell depend on the mean intensity field through that point.
| (4) |
The intensity field depends on the emission from other cells which in turn is given by their source functions. Hence, it is necessary to guess the level populations, solve for the mean intensity field, calculate updated level populations and iterate until the level populations have converged.
The radiation field is modeled by photon ’packets’ that represent many real photons. The number of photons each model packet represents is proportional to the Einstein- for the transition and the number of molecules or atoms in the upper state of the transition in the emitting grid cell. The photons are isotropically emitted in a spontaneous manner with a line frequency drawn from the line profile function:
| (5) |
where is the frequency of the emitted photon, is the rest frequency of the transition, is the velocity of the emitting clump of gas, and is the standard deviation of the profile function. The standard deviation is the Doppler width determined by the local kinetic temperature and microturbulent velocity:
| (6) |
We assume a constant microturbulent velocity of 0.2 km s-1 . The photon then takes a step of a given distance , passing through gas with opacity:
| (7) | |||
| (8) |
After passing through this grid cell, the number of real photons the model photon packet represents is diminished by a factor due to absorptions. The model photon continues to take steps in the same direction until it either leaves the grid or the number of photons it represents has become negligible. When all of the photons have been emitted, the mean intensity is known through each grid point.
The updated level populations are then calculated with the equations of statistical equilibrium
which are solved through standard matrix inversion methods. With the new level populations in hand, the process can be repeated with a new calculated radiation field. These radiative transfer calculations are then iterated over until the level populations are found to converge. Convergence in non-LTE radiative transfer simulations depends both on the number of model photons realized in the iteration, as well as the optical depth.
The level population calculations are sensitively dependent on the accuracy of the rate coefficients. We have obtained our coefficients from the Leiden Atomic and Molecular Database111 http://www.strw.leidenuniv.nl/moldata (Schoier et al. 2005). In order to independently test our radiative transfer codes, we have run the test problem of an inside-out collapsing sphere published by van Zadelhoff et al. (2002). We present the results of this test in Figure 1, and direct the reader to van Zadelhoff et al. (2002) for details on the test problem and solutions.
2.3. The Model and Parameters
We have run our non-LTE radiative transfer code for HCO+ rotational transitions through model HR of Boss (2001). In this model, a 1.4 Jupiter-mass dense clump of gas is formed through gravitational instabilities in the circumstellar disk. The maximum density through the proto-GGP is 5.010-9g cm-3, and it orbits at a semimajor axis of 10 AU. The temperature through the proto-GGP ranges from 100-150 K.
For the radiative transfer calculations, we considered HCO+ molecular line emission, as well as thermal continuum emission with opacities given by Boss & Yorke (1990). The radiative transfer calculations were run on one snapshot of the hydrodynamic model for which we show the midplane density contours in Figure 2. The boundary conditions for the non-LTE transfer included photons from the 2.73 K cosmic microwave background. However, when convolving our resultant images to beams larger than the grid, we assumed a vacuum boundary. Our grid for the calculations was spherical in nature with (,,)=(100,512,43). We emitted roughly 3.11108 photons per iteration. The calculations typically took 2 weeks on 14, 2GHz, AMD-64 processors.
2.4. Chemistry of HCO+
Abundances in protoplanetary disks can be wildly variable due to the wide range of temperatures and densities involved, in addition to variable X-ray and UV fluxes. Our purpose is to investigate gross emission features from dense gas clumps in circumstellar disks and a full model of the complex chemical reaction networks in disk environments (e.g. Aikawa & Herbst, 1999; Semenov, Wiebe, & Henning 2004) is beyond the scope of this paper. We approximate the impact of disk chemistry by running models at different HCO+ abundances and analyzing their imprint on emission features.
There are commonly two methods of introducing chemical depletion in disks: a uniform depletion factor across the entire disk, and a jump depletion where grain depletion only comes into play below a certain temperature threshold. The formation of HCO+ depends directly on the abundance of CO, and thus the HCO+ abundance is assumed to follow the CO characteristic depletion. CO freeze-out typically occurs at T22K, thus implying a necessary HCO+ depletion at low temperatures. However, the abundance of HCO+ can be altered from typical interstellar values for a variety of other factors: photodissociation can occur in the hot inner regions of the disk due to the enhanced UV flux of a young star, or through interstellar cosmic rays. We therefore utilize a uniform depletion from standard ISM abundances taken from Lee, Bettens & Herbst, (1996). This assumption may limit the predicted detectability of massive gas clumps in a circumstellar disk. In a study of the fractional ionization in disks, Semenov et al. (2004) find the dominant ion in the intermediate layer and midplane to be HCO+ at the radii where the densest gas clumps in our models form (10 AU), whereas the fractional HCO+ drops in the surface layers. By uniformly depleting the HCO+ abundance, we may be decreasing emergent flux.
van Zadelhoff et al. (2001) estimate depletions ranging from 0.1-0.001 from standard ISM abundances for disks TW Hya and LkCa 15. Dutrey et al. (1997) find an average HCO+ abundance of 7.410H2, corresponding to a depletion of 0.15. We have run three models corresponding to depletion factors of 0.5, 0.1 and 0.01. While simple depletion models are likely not valid for the extremely dense cores of proto-GGPs, as we discuss in § 4.1, the specifics of the chemistry in the densest regions of the disk may not contribute significantly to the emergent HCO+ flux.
3. Images
High angular resolution interferometers such as ALMA will be able to achieve unprecedented imaging capabilities of Galactic circumstellar disks. Utilizing our radiative transfer codes, we have created synthetic intensity contour maps of the HCO+ emission from the gravitationally unstable protoplanetary disk in our models, and present them in this section. The parameter space we explore includes rotational transition, inclination angle, and abundance.
3.1. Molecular Transition
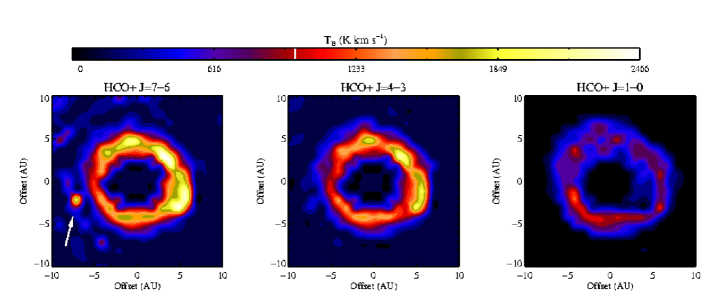
In Figure 3 we show model contours of spectral line intensity of the protoplanetary disk as viewed through the HCO+ J=1-0, 4-3 and 7-6 transitions at 1/2 ISM abundance. The disk is face on (=90) in each image.
The GGP in our simulation achieves a maximum density of =3.01015cm-3. At these high densities, and warm temperatures (100 K), collisions will ensure that most of the HCO+ molecules are excited well above the ground state. Indeed, as our simulations show, the GGP is only fully visible at the highest HCO+ transitions. While lower transitions in HCO+ may be able to detect dense clumps in the circumstellar disk, the densest clumps that may be self-gravitating can be identified using high-density tracers. For the HCO+ J=7-6 transition (107 cm-3), the proto-GGP emits quite prodigiously while the clumps in the remaining parts of the disk begin to fade. The high J levels of dense gas tracers serve as an efficient method of filtering out low density gas that may not be directly associated with the protoplanet. We have not explored any transitions beyond HCO+ J=7-6. It may be, however, that the proto-GGP is even more distinct at higher (THz) HCO+ transitions. For the transitions we have modeled, the densest clumps in the circumstellar disk are most visible in HCO+ J=7-6. We will explore the effects of inclination and abundance primarily in this transition.
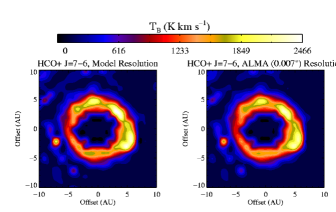
With its most extended baseline, ALMA will be able to achieve a spatial resolution of 0.007 at HCO+ (J=7-6, =624 GHz) (Bastian 2002). At the distance of Taurus Molecular Cloud, 140pc, this angular resolution (1 AU) is quite comparable to our model resolution of 0.5 AU. In Figure 4, we have simulated an observation of our circumstellar disk by setting it at a distance of 140 pc and convolving it with the 0.007 ALMA beam. We assume no lost flux and a circular Gaussian beam. The proto-GGP and other dense clumps are quite visible. As an example, in one hour of integration, the 64-element ALMA array should be able to image the dense protoplanet in Figure 4 with a signal to noise ratio of 3-4. Additionally, as we will show in § 4, signatures of dense clumps may be evident even in single-dish sub-mm telescopes through signatures in the emission line profile.


3.2. Inclination
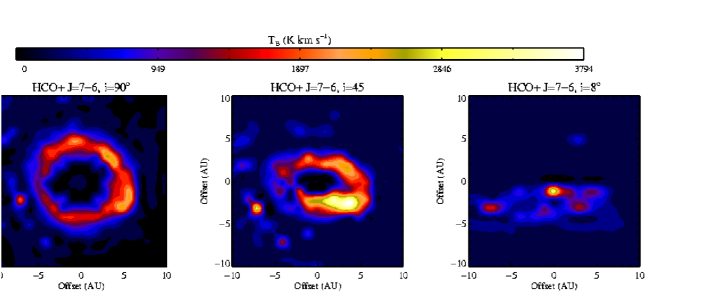
As we will discuss in § 4.1, the emission from the proto-GGP is largely from the outer layers. Consequently, the inclination angle of the disk does not affect the results significantly. As seen in Figure 5, even at nearly edge-on inclinations, the proto-GGP is still visible at HCO+ J=7-6. However, due to increasing column through the disk in low-inclination scenarios, other dense clumps in the disk begin to emit at similar intensities as the proto-GGP, thus confusing observations. Because of this effect, we have found that the minimum angle in our models that the proto-GGP is visible is 8. Inclination effects can quickly wash out signatures of the proto-GGP in the spectral line profile (see §4).

3.3. Abundances
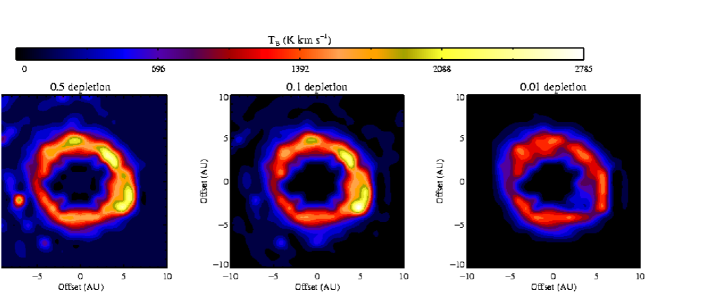
We have modeled the HCO+ abundances as uniform, modulo depletion factors (§ 2.4). In Figure 6, we present face-on images of the protoplanetary disk at 0.5, 0.1 and 0.01 depletion factors from standard ISM abundances. The proto-GGP is no longer visible at lower abundances. This holds for all inclinations, as well as all lower HCO+ transitions. With less emitting molecules along the line of sight, the proto-GGP emission is no longer able to dominate over the other dense clumps in the disk. However, the proto-GGP does, in fact, emit similar peak line temperatures as other dense clumps in the cloud. Why, then, does the protoplanet not appear to emit brightly in the image? The image shows velocity integrated line intensity - the total area under the emission spectrum. Much of the emission from the proto-GGP is self absorbed, and the majority of the emission comes from radiatively pumped gas in the outer layers at low velocity dispersion (§ 4.1). This effect reduces the velocity integrated intensity.

4. Line Profiles
4.1. Non-LTE Effects: Radiative Pumping in the Vicinity of Dense Gas Clumps
In Figure 7, we have plotted the HCO+ (J=7-6) emission spectrum through the proto-GGP in the model with 0.5 depletion factor. The large optical depths cause the line flux to be 0 K at line center. The emission from the proto-GGP does not originate at the core of the dense clump of gas, but rather in the more diffuse outer layers. While the gas in the dense core of the proto-GGP is in LTE, the emission from this gas suffers heavy extinction owing to the high optical depths at line center. However, the density through the proto-GGP drops off quickly with radius allowing gas in the outer layers (where 1) to be radiatively pumped by 1500 K gas near the protostar. The strong emission line temperatures, then, originate in radiative excitation of lower density non-LTE gas, rather than from the core of the cold proto-GGP, and consequently does not reflect the kinetic temperature of the emitting gas.
The emission pattern of heavy self-absorption at line center, and radiatively pumped gas at the surface is characteristic only of the densest clump of gas in our models, e.g. the self-gravitating proto-GGP with central density 1015 cm-3 . As it is these densest clumps that serve as antecedents to GGPs, the line profile of heavy self absorption at line center combined with offset emission may be characteristic of GGPs in formation. The optical depth in other dense clumps in the circumstellar disk is sufficient to produce self-absorption in the line profiles, but not to the same degree as seen toward the proto-GGP. As an example, in Figure 8, we plot the emergent HCO+ J=7-6 spectra at model resolution and depletion factor 0.5 from a clump in the face-on disk (located at x = 5 AU, y = -3 AU for reference with Figure 6) with central density 1.751011cm-3 . The optical depth at line center only reaches near the dense core of the clump, allowing significant emission from both the LTE core, as well as the radiatively pumped outer layers of the dense clump to escape. In contrast, the optical depth at line center at the core of the proto-GGP reaches a total value of several thousand, rendering the majority of the proto-GGP optically thick.
The nature of emission from the proto-GGP has implications concerning the assumed chemistry in these models. High optical depths through the densest regions of the proto-GGP prevents radiation from emerging. For example, even in the model with lowest optical depths (0.01 depletion factor), only 5% of the emission at the line peak originating from the center of the proto-GGP reaches the observer. This pales in comparison to the emission from the radiatively pumped gas in the outer layers of the proto-GGP which has an order of magnitude higher source function than the LTE gas at the core. The emission due to radiative pumping of the less dense gas in the outer layers of the proto-GGP will tend to mask more complex chemistry that may be occurring in the denser regions.

4.2. Effects of Abundance and Resolution
In order to further quantify the effect dense clumps have on the emission line profiles, we have convolved the model results with circular Gaussian telescope beams of different sizes (corresponding to the diameter of the telescope and the frequency of interest) and plotted the synthesized emission line spectra for three different HCO+ abundances.


In Figure 9, 10 and 11, we have plotted the model emission line profile as viewed by ALMA, the SMA and 10m class single-dish telescopes [e.g. Caltech Submillimeter Observatory (CSO) or the Heinrich Hertz Submillimeter Telescope (SMT)]. With each spectral line, we have overplotted the optical depth () as a function of velocity. The model disks are viewed face on. The line profiles are found to change significantly as a function of abundance. However, in each instance the line profiles through the proto-GGP are heavily self-absorbed.
In the model with a 0.5 depletion factor, the emission line through the proto-GGP, both at model resolution and that of ALMA, is self-absorbed to zero flux at line center. This is evident from the location of the peak in the optical depth profile. The asymmetry in the line profile (1-2 km s-1 of line center) is due to motion along the line of sight of the emitting atmosphere. As the beam size gets larger, more emission from the disk is included, and the effects of self-absorption begin to be washed out. The model with 0.1 depletion factor is qualitatively very similar to the 0.5 depletion factor case. There are minor differences involving the emission of different velocity components in the proto-GGP, but generally the results are the same. It is notable, however, that the peak line temperature has dropped by a factor of 2-3. Self-absorption features become more pronounced in the model with 0.01 depletion where an inverse p-cygni profile is observed. In this lowest abundance model, the column of emitting molecules is low enough that the emission can no longer fill in the absorption trough. The absorption is washed out for angular resolutions 0.1. The emission from the rest of the disk, once folded into the beam, quickly counteracts the self-absorption feature and a single peaked Gaussian line is observed.
At all abundances in our models, the self absorption through the proto-GGP reduces the flux at line center to 0 or negative values. Conversely, non self-gravitating dense clumps in our models only show moderate self-absorption. It may be that complete self-absorption to zero or negative flux is a signature of GGP formation discernible by ALMA. As the disk becomes more inclined, the self-absorption features become less discernible as the emission line broadens.
5. Spectral Maps
In Figure 12, we have taken spectra along various lines of sight through the face on protoplanetary disk with 0.5 depletion, convolved to a 0.007 ALMA beam. The proto-GGP stands out in emission quite high above the rest of the disk. This was evident as well in the contour emission map (Figure 3).
Spectral mosaics are particularly useful for identifying GGPs at low HCO+ abundance levels (e.g. Figure 13) where the proto-GGP may make itself evident through its bright emission line and self-absorbed profile. This type of emission is missed in a velocity integrated intensity contour map, however, owing to self-absorption in the line.
6. Conclusions
In this paper, we have presented non-LTE radiative transfer calculations of HCO+ rotational line emission in a gravitationally unstable protoplanetary disk. Our models suggest the following:
-
1.
Dense gas clumps associated with proto-GGPs formed via disk instabilities may be observable with interferometers (e.g. ALMA) in molecular transitions with high critical density (e.g. HCO+ J=7-6). The emission is dominated by radiatively pumped gas in the outer layers of dense clumps, and thus does not necessarily reflect the physical temperature of the emitting gas.
-
2.
The emission lines arising from the densest self-gravitating gas clumps in the protoplanetary disk are completely self-absorbed to zero or negative flux. The line profiles from other dense gas clumps are self absorbed, as well, although to a lesser degree.
-
3.
Proto-GGPs often appear as bright peaks in spectral line maps, making them easier to identify in the presence of extended disk emission.
-
4.
ALMA will have the angular resolution and sensitivity necessary to directly image proto-GGPs in formation in nearby circumstellar disks.
More complete chemical models and reaction networks will be incorporated in our models in future works.
References
- Aikawa & Herbst, (1999) Aikawa, Y., Herbst, E., 1999, A&A, 351,233
- Andrews & Williams, (2005) Andrews, S., Williams, J.P., 2005, ApJ, 619,175
- Bastian, (2002) Bastian, T.S., 2002, Astronomische Nachrichten, 323, 271
- Bernes, (1979) Bernes, C., 1979, A&A, 73,67
- Beuzit, et al. (2006) Beuzit, J.-L., Mouillet, D., Oppenheimer, B., Monnier, J. 2006, ’Direct Imaging of Extra-Solar Planets’, in Protostars and Planets V
- Boss, (2004) Boss, A.P., 2004, ApJ, 610,456
- Boss, (2001) Boss, A.P., 2001, ApJ, 563,367
- Boss, (1998) Boss, A.P., 1998, ApJ, 503,923
- Boss, (1997) Boss, A.P., 1997, Science, 276,1836
- Boss & Myhill (1992) Boss, A.P., Myhill, E.A., 1992, ApJS, 83,311
- Boss & Yorke, (1990) Boss, A.P., Yorke, H.W., 1990, ApJ, 353,236
- (12) Charbonneau, D., Brown, T., Burrows, A., Laughlin, G., 2006, ’When Extrasolar Planets Transit Their Parent Stars’, in Protostars and Planets V
- Choi et al. (1995) Choi, M.H., Evans, N.J., Gregersen, E.M., Wang, Y.S., 1995, ApJ448,742
- Currie, (2004) Currie, T., 2005, ApJ, 629,549
- Dutrey et al. (1997) Dutrey A., Guilloteau, S. Guelin, M., 1997, A&A, 317, L55
- Evans, (1999) Evans, N.J., 1999, ARA&A, 37,311
- (17) Goldreich, P., Lithwick, Y., Sari, R., 2004, ARA&A, 42,549
- (18) Goldreich, P. Lithwick, Y., Sari, R., 2004, ApJ, 614,
- Hogerheijde & van der Tak, (2000) Hogerheijde, M.R., van der Tak, F.F.S., 2000, A&A, 362,697
- Hogerheijde et al. (2002) Hogerheijde, M.R., Jayawardhana, R., Johnstone, D., Blake, G., Kessler, J., 2002, ApJ, 124,3387
- Ikoma, Nakazawa, & Emori (2000) Ikoma, M., Nakazawa, K., Emori, H., 2000, ApJ, 537,1013
- Juvela, (1997) Juvela, M., 1997, A&A, 332,943
- Kessler, (2004) Kessler, J., 2004, PhD Thesis, Caltech
- Lee, Bettens & Herbst, (1996) Lee H-H., Bettens R.P.A., Herbst, E., 1996, A&AS, 119, 111L
- Mayor et al. (2005) Mayor, L., Wadsley, J., Quinn, T., Stadel, J., 2005, MNRAS, 363,641
- Mejia, (2004) Mejia, A., 2004, PhD Thesis, Indiana University
- Moro-Martin, Wolf & Malhotra (2005) Moro-Martin, A., Wolf, S., Malhotra, R., 2005, ApJ, 621, 1079
- Park & Hong (1998) Park, Y.-S., Hong, S.S., 1998, ApJ, 494, 605
- Patel et. al (2005) Patel,N., Curiel, S., Sridharan, T.K., Zhang, Q., Hunter, T., Ho, P., Torrelles, J., Moran, J., Gomez, J., Anglada, G., 2005, Nature, 437
- Pollack et al. (1996) Pollack, J.B., Hubickyj, O., Bodenheimer, P., Lissauer, J.J., Podolak, M., Greenzweig, Y., 1996, Icarus, 124,62
- Qi et al. (2003) Qi, C., Kessler, J.E., Koerner, D.W., Sargent, A.I., Blake, G.A., 2003, ApJ, 597,986
- Qi et al. (2004) Qi, C., Ho, P.,Wilner, D., Takakuwa, S., Hirano, N., Ohashi, N., Bourke, T., Zhang, Q., Blake, G., Hogerheijde, M., Saito, M., Choi, M,, Yang, J., 2004, ApJ, 616,L11
- Qi et al. (2005) Qi, C., Wilner, D., Calvet, N., Bourke, T., Blake, G., Hogerheijde, M., Ho, P., Bergin, E., 2006, ApJ636,157
- Rafikov, (2003) Rafikov, R.R., 2003, AJ, 128,1348
- Saumon, & Guillot, (2004) Saumon, D., Guillot, T., 2004, ApJ, 609, 1170
- Schoier, (2000) Schoier, F.L., 2000, Ph.D. Thesis, University of Stockholm
- Schoier et al. (2005) Schoier, F.L., van der Tak, F.F.S., van Dishoeck, E.F., Black, J.H., 2005, A&A, 432,369
- Semenov, Wiebe, & Henning (2004) Semenov, D., Wiebe, D., Henning, Th., 2004, A&A, 417,93
- Semenov et al. (2005) Semenov,D., Pavlyuchenkov, Ya., Schreyer, K., Henning, Th., Dullemond, C., Bacmann, A., 2005, ApJ, 621,853
- Udry, Fiscer & Queloz (2006) Udry, S., Fischer, D., Queloz, D., 2006, ’A Decade of Radial-Velocity Exoplanet Discoveries’, in Protostars and Planets V
- van Zadelhoff et al. (2002) van Zadelhoff, G-J., Dullemond, C., van der Tak, F.F.S., Yates, J.A., Doty, S.D., Ossenkopf, V., Hogerheijde, M.R., Juvela, M., Wiesemeyer, H., Schoier, F.L, 2002, A&A, 395,373.
- Varniere et al. (2006) Varniere, P., Bjorkman, J.E., Frank, A., Quillen, A., Carciofi, A.C., Whitney, B., Wood, K., 2006, astro-ph/0508630
- Walker, Narayanan & Boss, (1994) Walker, C.K., Narayanan, G., Boss, A.P., 1994, ApJ, 431,767
- Walker, Maloney & Serabyn, (1994) Walker, C.K., Maloney, P.R.,Serabyn, E., 1994, ApJ, 437, L127
- Wolf & D’Angelo, (2005) Wolf, S., D’Angelo, G., 2005, ApJ, 619, 1114