The detection of M-dwarf UV flare events in the data archives
Abstract
We present the preliminary results from implementing a new software tool that enables inspection of time-tagged photon data for the astronomical sources contained within individual ultraviolet (UV) images of the sky. We have inspected the photon data contained within 1802 images to reveal rapid, short-term ( 500 sec) UV source variability in the form of stellar ‘flares’. The mean associated change in near UV (NUV) magnitude due to this flaring activity is 2.7 mag. A list of 49 new UV variable-star candidates is presented, together with their associated Sloan Digital Sky Survey (SDSS) photometric magnitudes. From these data we can associate the main source of these UV flare events with magnetic activity on M-dwarf stars. Photometric parallaxes have been determined for 32 of these sources, placing them at distances ranging from approximately 25 to 1000pc. The average UV flare energy for these flare events is 2.5 x 1030 ergs, which is of a similar energy to that of U-band, X-ray and EUV flares observed on many local M-dwarf stars. We have found that stars of classes M0 to M5 flare with energies spanning a far larger range and with an energy approximately 5 times greater than those of later (M6 to M8) spectral type.
Subject headings:
stars: variables: other (M-dwarf, dMe) — ultraviolet: stars1. Introduction
The NASA Galactic Evolution Explorer () satellite, which was launched in April 2003, has been successfully obtaining imaging photometric observations of astronomical sources in two ultraviolet bands (near ultraviolet [NUV] 1750 - 2750Å, far ultraviolet [FUV] 1350 - 1750Å). Scientific results from the initial observation of galaxies and stellar sources can be found in Martin et al. (2005) and references therein, and a description of the on-orbit instrumental performance is described by Morrissey et al. (2005). A major scientific data product from all-sky observations is a catalogue of sources detected in either/both UV bands (see http://galex.stsci.edu/GR1/). These UV sources are contained in the Merged Catalog (MCAT) which can be accessed at the Multi-mission Archive at the Space Telescope Science Institute (MAST). The catalogue is periodically updated and expanded as the mission progresses. This catalogue contains a wealth of information on both spectral and photometric observations recorded by , but the most significant (and most widely used) data-files are of the combined-visit variety, which provide source positions and fluxes derived from the NUV and/or FUV channel observations. A source visit refers to a period of observation (i.e. an exposure) of a particular region of the sky by , which can range from 100 seconds (for data recorded during the all-sky imaging survey) to several tens of orbits (each lasting 1500 sec) recorded during the deep imaging sky-survey mode of operation.
Using the information contained in these source lists, UV photometric variability observational visits to the same position on the sky has been found for some 84 objects, which are listed in the UV Variability (GUVV) catalog (Welsh et al., 2005). However, variability in the form of small transient flux changes or short-lived flare events that may possibly occur a single observational visit by can only be revealed by inspection of the time-tagged photon data for individual sources. Since has already detected several million UV sources during the first two years of its mission and each detected photon event is time-tagged with a precision of 0.05 seconds, clearly any search for variability within all these photon data files is extremely computer intensive and time-consuming. However, a new software tool has recently been developed by the Software Operations and Data Analysis team at Caltech that quickly enables source variability to be revealed within each observational visit (i.e. sky-field image) using the time-tagged photon count-rate data files. In this Paper we report the detection of 52 short-term UV variability events that can be associated with 49 stellar sources through an inspection of 1802 individual images. All these 1.24∘ diameter sky-fields have Sloan Digital Sky Survey (SDSS) DR4 imaging data (Adelman-McCarthy et al., 2006) with associated multi-filter (,, and ) visible photometric magnitudes. Using these data we have been able to determine that the vast majority ( 90) of these newly detected variable sources are M-dwarfs located up to 1kpc from the Sun.
2. Observations and Data Analysis
Our initial search for variability within the time-tagged source photon lists was performed with data generated from 1802 individual sky-field images contained in the data release IR1.1+GR1, which is soon to be made publicly available at the MAST facility. We have restricted our present study to data recorded in the NUV band through pointings made during (a) the Medium Imaging Survey (MIS), (b) the Deep Imaging Survey (DIS) and (c) the Nearby Galaxies Survey (NGS) (Martin et al., 2005). Only image fields that had associated SDSS visible imaging photometric data were chosen for this study. Data from the All-Sky Imaging Survey (AIS) were not included due to the short duration of these exposures. Although similar photon data exists in the FUV wavelength band for the MIS, DIS and NGS observations, those data are of an inferior S/N ratio to the NUV channel and are not presented here.
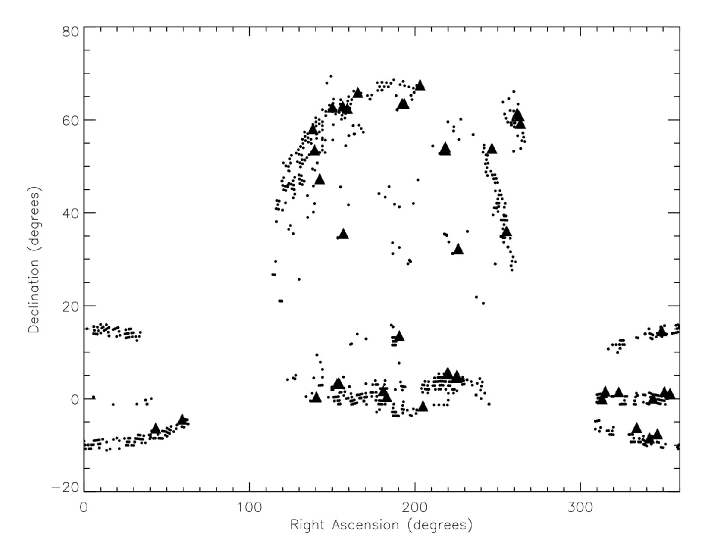
Each of the 1802 images has a diameter of 1.24∘ on the sky, and each exposure was of 1500 seconds duration (i.e.the length of one orbital eclipse). For sky-fields observed in the MIS and NGS modes usually 2 exposures per sky-field were recorded, but for several fields observed in the DIS mode as many as 50 exposures were recorded at a particular position on the sky. In a few cases, the exposures were shortened to 200 seconds due to on-orbit operational constraints. The data set is not uniform in the sense that many exposures of the same sky-field were taken several months apart. In addition, all consecutive exposures of the same field have a 60 minute gap between observations due to the satellite orbital eclipse period. All of these data correspond to observations of 752 different regions of the sky, with a total on-sky integration time of 2.27 x 10⁶ seconds. In Figure 1 we show the Galactic distribution of the 1802 MIS, DIS and NGS image fields that have been used for our present data analysis. These image fields were primarily selected for the study of external galaxies and hence the vast majority of the fields are located at moderately high Galactic latitudes, well away from the Galactic plane.
The raw UV imaging data were processed using the standard Data Analysis Pipeline (version 4.0) operated at the Caltech Science Operations Center (Pasadena, CA), which inputs time-tagged photon lists, instrument and spacecraft housekeeping data and satellite pointing aspect information (Morrissey et al., 2005). The data pipeline then uses the automated SExtractor source detection algorithm (Bertin and Arnouts, 1996) to produce a final catalog of source positions on the sky with corresponding ultraviolet magnitudes (averaged over the entire duration of the exposure) for each observation. At present, the time-tagged photon lists associated with each of these sources have not been widely available to the astronomical community. However a new software tool (named ‘varpix’), now allows post-pipeline inspection of the individual photon files for each source in order to search for any time-variability present during each exposure.
Since each of the 1802 exposures contains 1 Gbyte of data, clearly some sort of data-compression routine is required to search for source variability within the terra-byte of available photon data. ‘Varpix’, re-bins each of the normal 1.5 arcsec2 image pixels into 12 arcsec2 pixels and sums the photon counts in each of these larger sky-pixel areas over consecutive 16 second intervals. For every large sky-pixel (i) the median value of the summed photon counts, medpix (i,j) is calculated for each frame (j) such that a median image is created for all the frames. Similarly, for every sky-pixel (i) a maximum photon count, maxpix(i,j) is calculated for each frame, thus creating a maximum image of all frames. The variation, varpix(i), of the counts in sky-pixel (i) compared with the median and maximum image values is computed as:
varpix(i) = [maxpix(i,j) - medpix(i,j)] / sqrt(medpix(i,j))
This algorithm is essentially a crude photon count ‘variability signal-to-noise’ estimator that is calculated for each (large) sky-pixel image. The final product is thus a map of sky-pixel count-variability determined over a period of (j) 16-second long frames. The source detection algorithm, SExtractor, was then run on any of the large sky-pixel images with values of varpix(i) 15 to produce an initial list of possible variable source candidates. These positions were then matched to the spatially nearest astronomical source listed in the standard merged catalog (MCAT) of UV sources to verify their reality. In several instances, other orbiting satellites and asteroids were revealed by this screening process, and are not reported in our present list of variable stellar sources. The varpix(i) 15 value is an empirical signal-to-noise constraint that, when coupled to restricting the sampling of an image to the central 0.5∘ radius of the detector, eliminates spurious detections caused by instrumental edge reflections and glints that can contaminate an image. Extremely bright UV stellar sources, whose halo-broadened point spread function (which during observations is dithered in a spiral pattern on the sky) can sometimes extend beyond the 12 arc-second sized sky-pixel area and are also filtered out.
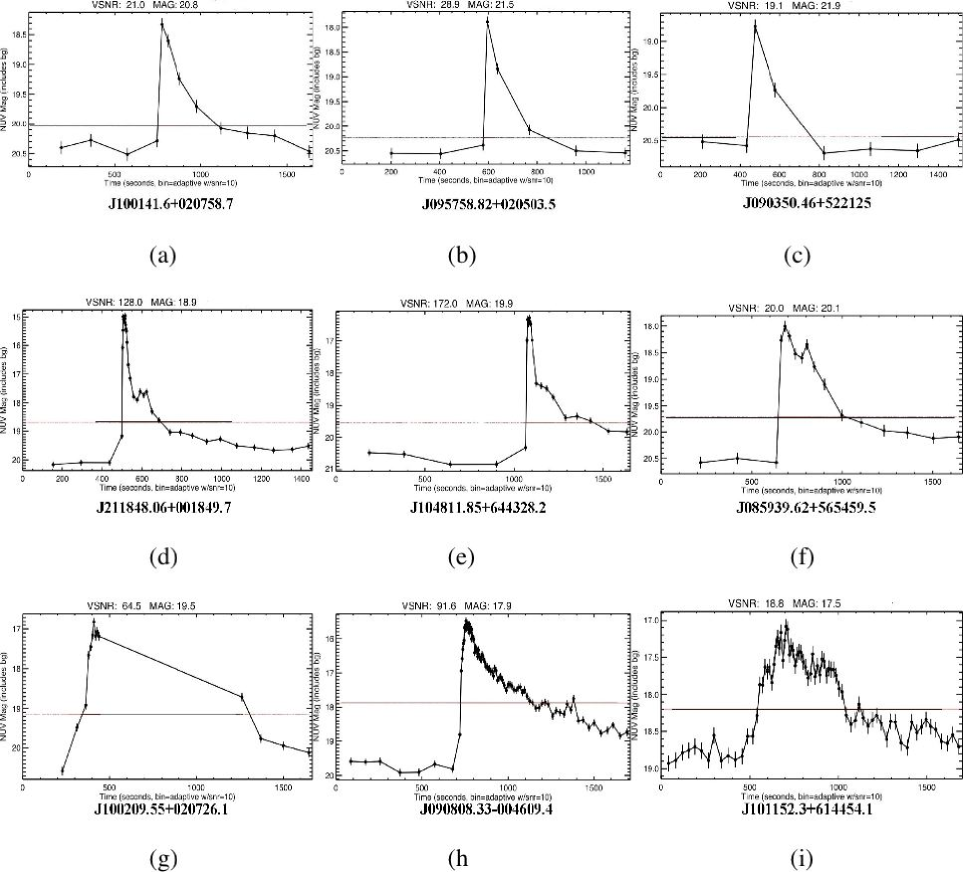
The time-tagged photon data associated with each of the the confirmed variable stellar sources were then extracted from the large sky-pixel images contained within each of the 16 second-long varpix frames, and (after background subtraction) were adaptively binned to produce time intervals in which the source photon flux reached a S/N ratio = 10. The source photon data contained in these bins were then converted into values of NUV magnitude, mnuv, in the AB magnitude system of Oke (1990) using the photon flux conversion of Morrissey et al. (2005). The resulting data product was set of values of mnuv as a function of adaptively binned time (i.e. a light-curve) for each variable source. In Figure 2 we show examples of these light-curves for nine of the newly detected variable sources. The physical nature of these short-term variations in flux will be discussed in the following Section.
The present ‘varpix’ algorithm is capable of detecting stellar flares that exhibit changes in the light-curve values of NUV magnitude (mnuv) of 0.25 mag on sources with a quiescent magnitude as faint as mnuv 21.0. We note that the detection sensitivity for variable sources is equivalent to that of the (stable) source detection limit of mnuv = 22.7 listed by Morrissey et al. (2005). The inferior sensitivity for variable source detection using ‘varpix’ is mainly due to the division of source photons into many 16-second bins, as opposed to the normal stable source sensitivity which is derived from a single 1500 second accumulation of photons during an MIS observation. Although the present ‘varpix’ detection algorithm is biased against the inclusion of very bright flare events, in fact none were found in these data (as subsequently confirmed by a manual search through all the exposures). Thus, only sources with with derived values of mnuv that lie in the magnitude range 14.7 - 21.0 were presently confirmed as being variable.
We also note that variable sources detected in the NUV channel were all subsequently confirmed as being variable in the FUV channel data, often with a comparable variation in the magnitude of their FUV flux. Although the variability detection process is incomplete for faint sources and low levels of variability, it presently provides a computationally fast and easy way of revealing astronomical sources that vary significantly over short time-periods ( 250 seconds) at UV wavelengths. Work is in progress to further refine all of the various selection criteria and screening constraints in order to produce an more complete catalog of UV variable sources.
In Table 1 we list information on the 49 variable UV sources (associated with 52 separate flare events) that have initially been found in the 1802 image fields using the software detection tool described above. Two separate UV transient variability events were recorded in different images for 3 of the sources, SDSS J100141.6+020758.7, SDSS J145110.28+310639 and SDSS J171746.57+594124.1. In columns (1) and (2) of this Table we list the Right Ascension (J2000.0) and Declination (J2000.0) of each detected source as measured by . Typically, these positions are accurate to 1.5 arc sec for detections in the central 1∘ of the detectors (Morrissey et al., 2005). In column (3) we list the nearest stellar source to this position, as catalogued in the SDSS DR4 catalog (Adelman-McCarthy et al., 2006). For very close binary systems the brighter companion was always chosen, and in one case the association with an SDSS identifier number was not possible due to the SDSS image being contaminated by a cosmic ray streak. In column (4) we list the MAST identifier for the respective image field in which the variability event was discovered. In column (5) we list the number of observations, Nobs, for each source contained within the archive that were searched using the ‘varpix’ software tool. In columns (6) and (7) we tabulate the maximum NUV magnitude (mNUVmax) observed within the duration of the flare and the associated change in this magnitude (mNUV) from the faintest value measured during the length of the observational visit. For the majority of sources this faint magnitude value is not equal to the true quiescent NUV magnitude, since for 60 of the sources the lowest value of mnuv recorded in most of their exposures lay below the detection threshold of the NUV channel (i.e. mnuv 22.7). Columns (8), (9), (10) and (11) list the SDSS visible point-spread function magnitudes in the , , and photometric bands (Abazajian et al., 2003). Magnitude values marked with asterisks are subject to saturation effects and have been excluded from any subsequent calculations and conclusions in this Paper. Finally, in column (12) we provide a probable spectral type for each source based on its SDSS photometric colors, or (for a few very bright objects) a catalog name based on cross identification with the Simbad on-line catalogue of sources. We have mainly used the ( - ) colors of West, Walkowicz and Hawley (2005), supplemented where necessary by the ( - ) colors of Agueros et al. (2005) and the ( - ) colors of West, Walkowicz and Hawley (2005), to assign the spectral types.
3. Discussion
3.1. The Light-Curves
A detailed inspection of all 52 light-curves, of which Figure 2 shows nine typical examples, reveals that the short-term variability events can broadly be described by three different signatures, which are very similar to those revealed from numerous ground-based U-band observations of M dwarf flares (Moffett and Bopp (1976), Houdebine (2003)). Type 1 events, shown in Figures 2(a) - (c), consist of a rapid flux rise (typically 50 seconds) with a single emission peak that is followed by an ’quasi-exponential’ decay (typically lasting 500 seconds) that normally returns to the pre-event flux level. Type 2 events, shown in Figures 2 (d) - (f), consist of a similarly rapid flux rise, but have multiple secondary emission peaks that eventually decay to the pre-event flux level after 500 seconds. Type 3 events, shown in Figures (g) - (i), have more complex rising and falling flux signatures. Of the 52 variability curves that has observed, 27 can be classed as Type 1 events, 15 are of Type 2, 4 are of Type 3 and the remaining 6 events cannot be classified due to an incomplete time sampling of their time versus flux-signatures (i.e. they occur too close to the start or end of an exposure). The similarity between the general shapes of the NUV and U-band flare light-curves suggests that a common emission mechanism is responsible for the observed flux. It has been well-established that U-band and bluer wavelength flare spectra are dominated by continuum emission (Hawley et al., 2003), which strongly favors a similarly significant continuum contribution to the flare spectra recorded at NUV wavelengths by . The relative contribution from continuum and/or emission lines in the UV bands recorded during a flare has been discussed by Robinson et al. (2005), who also argue that the NUV band is dominated by stellar continuum flux. However, we note that for the FUV band, line emission also becomes an important contributor (Phillips, Bromage and Doyle, 1992).
In Figure 3 we show a histogram plot of the change in NUV magnitude measured over one exposure, mnuv, versus the number of detected variable sources, N, that exhibit that magnitude change. The distribution peaks close to the mean value of mnuv = 2.7 magnitudes (i.e. a change of greater than a factor 10 in the emitted UV flux). This plot takes no account of the spectral type or distance to each flare star and is presented as an empirical example of the range of changes in NUV magnitude that the satellite can typically encounter during its scheduled observations. We note the presence of a subsidiary second peak in this distribution (albeit with a small number of events), that spans a 4.5 - 5.5 magnitude change. Events of this nature are characterized by an increase in flux of 100, and seem much rarer than the former less energetic events. For comparison purposes we note that the very large UV flare on GJ 3685A detected with had a value of mnuv = 7.7 magnitudes and a derived energy of 1034 ergs (Robinson et al., 2005).
3.2. M-dwarf flare energies and flare frequency
In Figure 4 we plot values of ( - ) versus ( - ) for the sources listed in Table 1 that possess reliable (i.e. unsaturated) SDSS photometric magnitudes. It is clear from this plot that the great majority of variable sources have values of ( - ) 0.8 and ( - ) 0.4. All these sources can be categorized as M-dwarf stars, based on the colors for cool stars presented in Finlator et al. (2000) and West, Walkowicz and Hawley (2005). The remaining UV variable sources are most probably active K-dwarfs. Several of the variable objects appear as binary systems in the SDSS images, with the source SDSS J101152.3+614454.1 being a triple M-star system. The data presented in Figures 2 and 3 also support the notion that the vast majority of the changes in UV flux originate in a single physical type of astronomical source, i.e. stellar flare eruptions on K and M stars. Since M-dwarfs account for more than 75 of the stellar population in the solar neighborhood, and such stars are known to possess strong magnetic fields with high coronal activity and associated chromospheric UV line emission (Mitra-Kraev et al., 2005), it is therefore not surprising that observations favor their serendipitous detection.
Unfortunately the S/N ratio of the data for the majority of these short-term flare events precludes us from performing a detailed physical analysis similar to that carried out on the giant UV flare observed by on the star GJ 3685A (Robinson et al., 2005). However, since we have a relatively large sample of M-dwarf flares we shall proceed with a more general statistical treatment of the present data.
In order to estimate the total emitted UV energy from each of each of these flares we require both knowledge of the integrated flux emitted over the time of the flare event, as well as the distance and stellar bolometric luminosity for each source. Distances to all of the M-dwarfs that have good quality SDSS photometry were derived using the photometric parallax method described in West, Walkowicz and Hawley (2005). We have determined that 32 of the 49 sources listed in Table 1 are both M-dwarfs have useable and band data (we preclude the J101152.3+614454.1 triple star system). Absolute magnitudes have been calculated for these 32 stars from the color relationship, with photometric distance estimates being subsequently derived. The corresponding stellar bolometric luminosity for each of these M-dwarfs is based on their spectral type (as listed in Table 1), and is estimated from the luminosity values given for individual M-dwarfs of similar spectral-type presented in Leggett et al. (1996, 2001). Due to our uncertainty of one spectral class in the values listed for each source in Table 1, the derived value of bolometric luminosity for each star, Lbol, is an average of the two luminosities for both of the spectral classes listed. In Table 2 we list our derived values of distance and Lbol (compared to that of the solar luminosity, L☉). In addition we list the total NUV flare energy, ENUVflare and the NUV flare luminosity, LNUVflare, referenced to the stellar bolometric luminosity, Lbol. Note that two flares were detected on the star J100141.6+020758.7, such that flare energies for 33 separate events are listed in Table 2.
The present sample of stars whose distances can be derived from photometric colors is biased against the inclusion of bright and nearby M dwarfs, due to a bright limit on SDSS magnitudes. However, for the 32 stars who do have distance estimates, flares were detected over the 25 - 1000pc range. The majority of these stars are located 300pc from the Sun, thus placing them within the thin disk. We note that stars of spectral type M5/M6 and later were only detected with distances 200pc. This is most probably due to an apparent magnitude selection effect, in which the intrinsically brighter and earlier spectral types (M0 - M4) were detectable to greater distances with . The most distant flare recorded was on the star J023955.52-072855.4 ( = 181∘, = -58∘ ) with a distance of 990pc, thus placing it 840pc below the Galactic plane.
The range of the 33 UV flare energies detected by extends from 1.2 x 1028 to 1.6 x 1031 ergs, with an average UV flare energy of 2.5 x 1030 ergs. This energy range is very similar to that derived from NUV observations of 54 flares on the dM4.5e star YZ Canis Majoris by Robinson, Carpenter Percival (1999). We also note that the presently derived NUV flare energies are similar to those of the U-band flares observed at visible wavelengths on UV Ceti (Panagi and Andrews, 1995), but they do not reach the more extreme flare energies recorded in the U-band by Pettersen, Coleman and Evans (1984) for the nearby dM3.5V star AD Leonis. Our derived UV flare energies are also similar to those reported for M-dwarf flares detected at EUV and X-ray wavelengths by Sanz-Forcada and Micela (2002), Gudel et al. (2004) and Mitra-Kraev et al. (2005).
The superposition of flares with a large range of energies is thought to play a fundamental role in the coronal (X-ray) heating of magnetically active dMe stars (Gudel et al., 2004), and thus studies of the flare frequency as a function of flare energy can be important in determining if flares are sufficiently numerous and energetic to explain the associated coronal emission (Audard et al., 2000; Gudel et al., 2003). Table 2 shows that there is a distinct difference in the range of UV flare energies for different spectral-types of M-dwarf. For example, flares detected on the 28 stars with spectral classes M0 to M5 were detected with energy ratios spanning the range log (LNUVflare/Lbol) = -2.4 to -5.5, with a median energy of log (LNUVflare/Lbol) = -3.6. However, for the (albeit small) sample of 5 stars of spectral classes M6 to M8 the mean flare energy spans a much smaller energy range of log (LNUVflare/Lbol) = -4.2 to -5.7, with a median flare energy of log (LNUVflare/Lbol) = -4.3 (i.e. a factor 5 lower in energy). This pattern of behavior is similar to that reported by West et al. (2004) and Cruz and Reid (2002), in which the activity strength (as measured by the ratio of H luminosity to the stellar bolometric luminosity) was also found to be higher for stars of spectral class M0 to M5 than for those of type M6 to M9. We refer the reader to Gizis, Reid and Hawley (2002) for a discussion of why the level of chromospheric activity may vary with M-dwarf stellar age and mass.
A derivation of the (UV) flare frequency rate on M-dwarfs is also particularly important for the study of habitability zones on possible associated extra-solar planetary systems (Turnbull and Tarter, 2003). Previous estimates of flare frequency have been made by Smith, Gudel and Audard (2005) who observed 17 large X-ray flares during 120,000 seconds observations of 5 dMe stars using the satellite (i.e. 0.4 X-ray flares hr-1 M-star-1). Also, Mitra-Kraev et al. (2005) have observed 13 UV (and near-simultaneous X-ray) flares during 40 hours of observations of 5 dMe stars using the Optical Monitor (used with NUV filters) also on the satellite (i.e. 3.08 UV/X-ray flares hr-1 M-dwarf-1). In addition, Gudel et al. (2004) observed almost continuous low-level X-ray variability during 65 ksec of observations of Proxima Centauri (dM5.5e). Unfortunately, although our observations have sampled a relatively large number of sky-fields for a relatively extended period of time (from which, in principle, a UV flare-rate per M-dwarf could be derived), the majority of the sight-lines are located well above the Galactic plane where the M-dwarf space density is poorly determined. As the mission progresses with an increased sky-coverage for lower Galactic latitudes, we will then be better placed to derive a statistically meaningful M-dwarf flare rate. In particular, extended observations of the entire Hyades star cluster (that covers 30 sq.deg on the sky) may provide the best estimate of flare frequency for local M-dwarfs.
3.3. Conclusion
We describe a newly developed software tool that allows inspection of the time-tagged photon lists associated with sources contained within each 1.24∘ diameter UV image of the sky. In its present form, potential UV source variability can only be reliably detected by this algorithm for objects with NUV magnitudes in the range 14.7 mnuv 21.0. A preliminary inspection of 1802 NUV images, recorded over a total exposure time of 2.27 x 10⁶ seconds, has revealed 52 short-term transient UV outbursts originating on 49 different stellar sources. A comparison of the SDSS , , and visual photometric magnitudes for these stellar sources shows that the vast majority can be categorized as nearby active M-dwarfs. Such stars are known to possess strong magnetic fields with high coronal activity and thus we can confidently associate the transient UV outbursts with stellar flares.
The light-curves for these 52 variability events can be broadly described by 3 different flux-signatures, with 50 of the outbursts consisting of a rapid flux rise (typically 50 seconds) with a single emission peak that is followed by an ‘exponential-like’ decay that typically lasts 500 seconds. This behavior is similar to many flares observed in the U-band on numerous M-dwarfs, whose spectra are dominated by continuum emission. It therefore seems highly likely that the flare emission recorded in the NUV band is similarly dominated by continuum emission.
The mean NUV magnitude change for these short-lived flare events is 2.7 mag., with several outbursts being 10 times more energetic than the mean value. Photometric distances in the 25 - 1000pc have been derived for flares observed on 32 of these M-dwarfs. The corresponding average NUV flare energy for the flare events on these stars of known distance is 2.5 x 1030 ergs, which is of a similar energy to that of U-band, X-ray and EUV flares observed on many local dMe stars. We have found that stars of classes M0 to M5 flare with energies spanning a far larger range and with an energy 5 times greater than those of later spectral type (i.e. M6 to M8).
Finally, we note that although the utility of the new ‘varpix’ software tool has been demonstrated on UV photon data associated with M-dwarf flare events, it could also be used to reveal lower level short-term variations in the UV flux from other astronomical objects such as cataclysmic variable stars, BL Lac and Seyfert galaxies.
References
- Abazajian et al. (2003) Abazajian, K., Adelman-McCarthy, J.K., Agueros, M.A. et al., 2003, AJ, 126, 2081
- Adelman-McCarthy et al. (2006) Adelman-McCarthy, J., Agueros, M., Allam, S. et al., 2006, ApJS, 162, 38
- Agueros et al. (2005) Agueros, M., Ivezic, Z., Covey, K. et al., 2005, AJ, 130, 1022
- Audard et al. (2000) Audard, M., Gudel, M., Drake, J. and Kashyap, V., 2000, ApJ, 541, 396
- Bertin and Arnouts (1996) Bertin, E. and Arnouts, S., 1996, A AS, 117, 393
- Cruz and Reid (2002) Cruz, K. and Reid, I.N., 2002, AJ, 123, 2828
- Finlator et al. (2000) Finlator, K., Ivezic, Z., Fan, X. et al., 2000, AJ, 120, 2615
- Fukugita et al. (1996) Fukugita, M., Ichikawa, T., Gunn, J-E., et al., 1996, AJ, 111, 1748
- Gizis, Reid and Hawley (2002) Gizis, J., Reid, I.N. and Hawley, S., 2002, AJ, 123, 3356
- Gudel et al. (2003) Gudel, M., Audard, M., Kashyap, V. et al., 2003, ApJ, 582, 423
- Gudel et al. (2004) Gudel, M., Audard, M., Reale, F. et al., 2004, A A, 416, 713
- Hawley et al. (2003) Hawley, S., Allred, J., Johns-Krull, C. et al., 2003. ApJ, 597, 535
- Houdebine (2003) Houdebine, E.R., 2003, A A, 397, 1019
- Jelinsky et al. (2003) Jelinsky, P., Morrissey, P., Malloy, J. et al., 2003, Proc. SPIE, 4854, 233
- Leggett et al. (1996) Leggett, S., Allard, F., Berriman, G. et al., 1996, ApJS, 104, 117
- Leggett et al. (2001) Leggett, S., Allard, F., Geballe, T. et al., 2001, ApJ, 548, 908
- Martin et al. (2005) Martin, D.C., et al. 2005, ApJ, 619, L7
- Mitra-Kraev et al. (2005) Mitra-Kraev, U., Harra, L., Gudel, M. et al., 2005, A A, 431, 679
- Moffett and Bopp (1976) Moffett, T. and Bopp, B., 1976, ApJS, 31, 61
- Monet et al. (2003) Monet, D., Levine, S., Canzian, B. et al., 2003, AJ, 125, 984
- Morrissey et al. (2005) Morrissey, P., Schiminovich, D., Barlow, T.A. et al. 2005, ApJ, 619, L7
- Oke (1990) Oke, J.B., 1990, AJ, 99, 1621
- Panagi and Andrews (1995) Panagi, P. and Andrews, A., 1995, MNRAS, 277, 423
- Pettersen, Coleman and Evans (1984) Pettersen, B., Coleman, L. and Evans, D., 1984, ApJS, 54, 375
- Phillips, Bromage and Doyle (1992) Phillips, K., Bromage, G. and Doyle, J., 1992, ApJ, 385, 731
- Pye et al. (1994) Pye, J., Hodgkin, S., Stern, R. et al., 1994, MNRAS, 266, 798
- Reid, Gizis and Hawley (2002) Reid, I.N., Gizis, J. and Hawley, S.L., 2002, AJ, 124, 2721
- Robinson et al. (1995) Robinson, R., Carpenter, K., Percival, J. and Bookbinder, J., 1995, ApJ, 451, 795
- Robinson, Carpenter Percival (1999) Robinson, R., Carpenter, K. and Percival, J., 1999, ApJ, 516, 916
- Robinson et al. (2001) Robinson, R., Linsky, J., Woodgate, B. and Timothy, J., 2001, ApJ, 554, 368
- Robinson et al. (2005) Robinson, R., Wheatley, J., Welsh, B.Y. et al., 2005, ApJ, 633, 447
- Sanz-Forcada and Micela (2002) Sanz-Forcada, J. and Micela, G., 2002, A A, 394, 653
- Smith, Gudel and Audard (2005) Smith, K., Gudel, M. and Audard, M., 2005, A A, 436, 241
- Turnbull and Tarter (2003) Turnbull, M.C. and Tarter, J., 2003, ApJS, 145, 181
- Welsh et al. (2005) Welsh, B.Y., Wheatley, J., Heafield, K. et al., 2005, AJ, 130, 825
- West et al. (2004) West, A., Hawley, S., Walkowicz, L. et al., 2004, AJ, 128,426
- West, Walkowicz and Hawley (2005) West, A., Walkowicz, L.M. and Hawley, S., 2005, PASP, 117, 706


| SDSS I.D. | Spectral Type | distance (pc) | log Lbol/L☉ | ENUVflare | log LNUVflare/Lbol |
|---|---|---|---|---|---|
| J023955.52-072855.4 | M0/M1 | 990 | -1.27 | 9.3e+30 | -2.6 |
| J034358.01-053526.5 | M3/M4 | 230 | -1.99 | 4.3e+29 | -4.0 |
| J085939.62+565459.5 | M1/M2 | 240 | -1.54 | 1.9e+30 | -3.3 |
| J090350.46+522125 | M5/M6 | 190 | -2.81 | 2.3e+29 | -4.2 |
| J094659.05+613146.2 | M5/M6 | 130 | -2.81 | 2.7e+29 | -4.2 |
| J095758.82+020503.5 | M3/M4 | 120 | -1.99 | 1.0e+29 | -4.6 |
| J100141.6+020758.7 | M2/M3 | 105 | -1.72 | 1.8e+29** | -4.3** |
| J100141.6+020758.7 | M2/M3 | 105 | -1.72 | 1.6e+29** | -4.4 ** |
| J100209.55+020726.1 | M3/M4 | 405 | -1.99 | 6.1e+30 | -2.8 |
| J100255.43+021159.6 | M2/M3 | 790 | -1.72 | 3.2e+30 | -3.1 |
| J101152.3+614454.1 | M3/M4 | 70 | -1.99 | 6.0e+29 | -3.8 |
| J101326.83+342309.8 | M3/M4 | 505 | -1.99 | 4.1e+30 | -3.0 |
| J102253.37+611917.5 | M3/M4 | 130 | -1.99 | 2.8e+29 | -4.1 |
| J104811.85+644328.2 | M3/M4 | 60 | -1.99 | 1.8e+29 | -4.3 |
| J114939.38+003510.2 | M2/M3 | 40 | -1.72 | 2.3e+28 | -5.2 |
| J115756.68-004004.6 | M3/M4 | 25 | -1.99 | 1.2e+28 | -5.5 |
| J123512.63+621745.1 | M3/M4 | 260 | -1.99 | 1.1e+31 | -2.5 |
| J124004.82+622309.1 | M4/M5 | 460 | -2.41 | 5.5e+30 | -2.8 |
| J131843.62+661914 | M3/M4 | 690 | -1.99 | 1.6e+31 | -2.4 |
| J132537.62-024540.9 | M4/M5 | 145 | -2.41 | 3.2e+29 | -4.1 |
| J142010.42+522157.8 | M4/M5 | 110 | -2.41 | 4.5e+28 | -4.9 |
| J142551.18+042948.7 | M4/M5 | 85 | -2.41 | 7.6e+29 | -3.7 |
| J144738.47+035312.1 | M5/M6 | 25 | -2.81 | 9.2e+28 | -4.6 |
| J144815.37+032223.3 | M7/M8 | 40 | -3.40 | 8.1e+27 | -5.7 |
| J164741.89+345732.9 | M2/M3 | 75 | -1.72 | 1.9e+29 | -4.3 |
| J171316.24+601121.1 | M4/M5 | 280 | -2.41 | 1.1e+30 | -3.6 |
| J172113.52+580609.8 | M3/M4 | 295 | -1.99 | 1.3e+30 | -3.5 |
| J204631.88+002452.5 | M4/M5 | 295 | -2.41 | 7.3e+30 | -2.7 |
| J220217.08-072243.3 | M0/M1 | 600 | -1.27 | 5.4e+30 | -2.8 |
| J224145.63-010539.2 | M5/M6 | 145 | -2.81 | 1.8e+29 | -4.3 |
| J225216.32-084240.5 | M3/M4 | 90 | -1.99 | 1.2e+30 | -3.5 |
| J230913.89+001852.2 | M4/M5 | 300 | -2.41 | 1.0e+30 | -3.6 |
| J232301.12-000118 | M3/M4 | 475 | -1.99 | 4.4e+30 | -2.9 |
| ** = 2 flares observed on this star | |||||