The Sulfur Abundance Anomaly in Planetary Nebulae
keywords:
ISM: planetary nebulae: general, Galaxy: abundances1 What Is The Sulfur Anomaly?
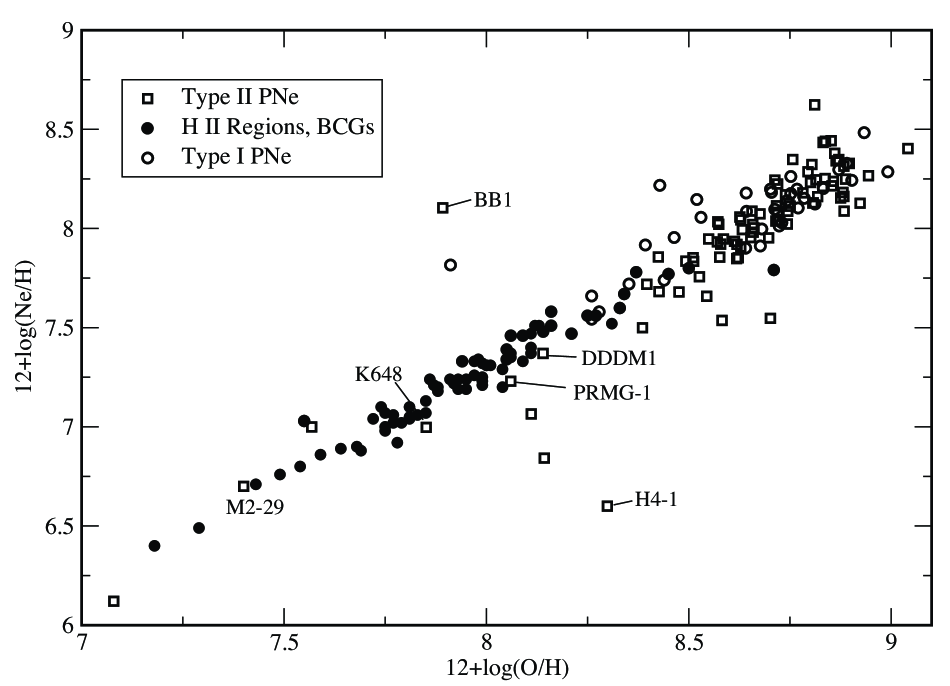
The alpha elements O, Ne, Mg, Si, S, Cl, and Ar are produced together in massive stars and their abundances are expected to evolve in lockstep. Both H II regions and planetary nebulae serve as interstellar probes of alpha element abundances. We have measured abundances for the alpha elements O, Ne, S, Cl, and Ar in over 130 Galactic Types I and II and halo PNe in a consistent manner from our own optical (3600-9600 Å) spectra (Henry, Kwitter, & Balick 2004). Figure 1 is a plot of Ne vs. O for a combined dataset containing H II regions, blue compact galaxies, and our sample of planetary nebulae. All object types appear to be consistent with the expected linear relation between Ne and O. Similar plots of Cl and Ar vs. O show the same behavior. However, S vs. O is an exception.
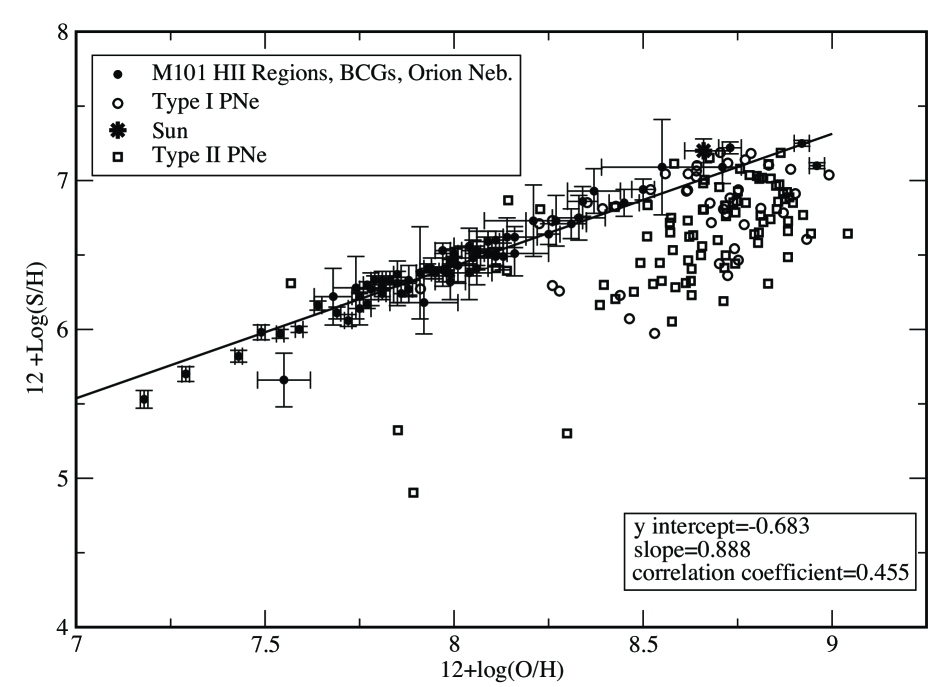
A plot of S vs. O is shown in Fig. 2. The filled circles show data for the H II regions and blue compact galaxies, while the open circles and squares represent Type I and Type II PNe, respectively. The H II regions and blue compact galaxies and many of the Type I PNe conform to the expected tight linear relation. A linear least squares fit to all but the PN data are shown with the line; fit parameters are provided in the lower right box. The points for the Type II PNe are highly scattered and fall systematically below the linear relation. This unexpected behavior between S and O was discovered and discussed in Henry, Kwitter, & Balick (2004) and was dubbed the sulfur anomaly. The same behavior is seen in the S data of Kingsburgh & Barlow (1994) if placed on this plot.
2 What Causes The Sulfur Anomaly?
When the vertical distance of a PN from its expected value of S/H (the value corresponding to its O/H value in Fig. 2) is plotted as functions of its [O III] temperature, [S III] temperature, and O+2/O+ ratio (all measures of nebular excitation), no correlations are apparent. The most likely explanation of the sulfur anomaly is that a sizeable portion of elemental S is present as S+3, which is unobservable in the optical. The abundance of S+3 is usually accounted for through the use of an ionization correction factor (ICF), and we propose that abundance methods heretofore have grossly underestimated the abundance of this ion. Direct measurements of the S+3 abundance in PNe can be effected through the observation of [S IV] 10.5m.
Sulfur abundances were determined from ISO data by Pottasch and coworkers (Pottasch et al. 2004) using the [S IV] 10.5m line. Seven of Pottasch’s objects are included in our optical sample, and a comparison of their derived S abundances with ours suggests that in some individual cases, the sulfur anomaly is reduced, although the ISO data have not solved the problem. The better S/N and overall quality of Spitzer data is needed to test our S+3 hypothesis in a definitive manner. We hope to employ the Spitzer Space Telescope to measure the strength of [S IV] 10.5m in 11 Galactic PNe.
We are grateful for support from NSF grant AST 03-07118 and the University of Oklahoma.
References
- [] Henry, R.B.C., Kwitter, K.B., & Balick, B. 2004, AJ, 127, 2284
- [] Izotov, Y.I., & Thuan, T.X. 1999, APJ, 511,639
- [] Kennicut, R.C., Bresolin, F., & Garnett, D.R. 2003, APJ, 591, 801
- [] Kingsburgh, R.L., & Barlow, M.J. 1994, MNRAS, 271, 257
- [] Pottasch, S.R., Bernard-Salas, J., Beintema, D.A., & Feibelman, W.A. 2004, A&A, 423, 593