44email: nemesio.rodriguez@obs.u-bordeaux1.fr 55institutetext: Observatorio Astronómico Nacional, Centro Astronómico de Yebes Apartado 148, 19080 Guadalajara, Spain 55email: p.devicente@oan.es
ORGANIC MOLECULES IN THE GALACTIC CENTER.††thanks: Table 7 is only available in electronic at the CDS via anonymous ftp to cdsarc.u-strasbg.fr (130.79.125.5) or via http://cdsweb.u-strasbg.fr/Abstract.html
Abstract
Aims. We study the origin of large abundances of complex organic molecules in the Galactic center (GC).
Methods. We carried out a systematic study of the complex organic molecules CH3OH, C2H5OH, (CH3)2O, HCOOCH3, HCOOH, CH3COOH, H2CO, and CS toward 40 GC molecular clouds. Using the LTE approximation, we derived the physical properties of GC molecular clouds and the abundances of the complex molecules.
Results. The CH3OH abundance between clouds varies by nearly two orders of magnitude from 2.410-8 to 1.110-6. The abundance of the other complex organic molecules relative to that of CH3OH is basically independent of the CH3OH abundance, with variations of only a factor 4–8. The abundances of complex organic molecules in the GC are compared with those measured in hot cores and hot corinos, in which these complex molecules are also abundant. We find that both the abundance and the abundance ratios of the complex molecules relative to CH3OH in hot cores are similar to those found in the GC clouds. However, hot corinos show different abundance ratios than observed in hot cores and in GC clouds. The rather constant abundance of all the complex molecules relative to CH3OH suggests that all complex molecules are ejected from grain mantles by shocks. Frequent (10years) shocks with velocities 6 km s-1 are required to explain the high abundances in gas phase of complex organic molecules in the GC molecular clouds. The rather uniform abundance ratios in the GC clouds and in Galactic hot cores indicate a similar average composition of grain mantles in both kinds of regions. The Sickle and the Thermal Radio Arches, affected by UV radiation, show different relative abundances in the complex organic molecules due to the differentially photodissociation of these molecules.
Key Words.:
Astrochemistry – ISM: clouds – ISM: molecules – Radio lines: ISM – Galactic: center1 Introduction
Gas-grain interaction in the interstellar medium (ISM) can have a large impact
on its chemistry because of the desorption and/or depletion of molecules onto
grains mantles. The gas phase abundance of molecules, which are believed to be
efficiently formed on dust grains such as, methanol (CH3OH), ethanol
(C2H5OH), and formaldehyde (H2CO), can be enhanced by orders of
magnitude due to the ejection/evaporation of these molecules from grain
mantles.
One of the interesting features of the gas-phase chemistry after ejection of these molecules is the fast conversion of these parent molecules into daughter molecules. The relative abundance of dimethyl ether ((CH3)2O) is expected to change by three orders of magnitude in a short period of time after CH3OH is ejected to gas phase (Millar et al. 1991; Caselli et al. 1993; Charnley et al. 1995; Horn et al. 2004). Basically all models of alcohol-driven chemistry have indicated that (CH3)2O and methyl formate (HCOOCH3) will reach their largest abundances - years after the ejection of CH3OH into gas phase. However, Horn et al. (2004) have shown that HCOOCH3 formation in gas phase from CH3OH is less efficient than previously considered in the models. This casts some doubts on the gas-phase production of HCOOCH3, and they propose that this molecule is also formed on grain mantles. The gas phase/grain formation of (CH3)2O has been studied by Peeters et al. (2006), showing that the main path to form (CH3)2O is by gas-phase reactions and that its formation on grains is a minor source of the observed abundances. Other organic molecules like formic acid (HCOOH) can be produced in both gas phase and grain mantle chemistry (Liu et al. 2002).
So far, large abundances of complex molecules have been detected in three different kinds of objects: hot cores associated with massive star formation (Ikeda et al. 2001), hot corinos associated with low-mass star formation (Bottinelli et al. 2006), and the Galactic center (GC) clouds (Martín-Pintado et al. 2001). Their physical properties are very different. While the hot cores and hot corinos are small (0.1 pc), hot (100 K), and very dense (10cm-3) condensations, the GC molecular clouds show averaged scales of 20-30 pc, kinetic temperatures 50-200 K, and an averaged density of 10cm-3 (Güsten & Philipp 2004). The molecular gas in the inner region of our Galaxy presents a different chemistry than in the Galactic disk (Martín-Pintado et al. 1997). In the GC, widespread large abundances of grain-processed molecules like CH3OH, C2H5OH, and silicon monoxide (SiO) are observed (Gottlieb et al. 1979; Minh et al. 1992; Martín-Pintado et al. 1997, 2001; Hüttemeister et al. 1998). It has been proposed that the sputtering of grains and grain mantles produced by widespread shocks with moderated velocities of 40 km s-1 are the responsible of the rich” chemistry observed in the GC clouds. The origin of the large scale shocks is so far unclear. These shocks could be produced by cloud-cloud collisions associated with the large-scale dynamics in the context of a barred potential (Hasegawa et al. 1994; Hüttemeister et al. 1998; Rodríguez-Fernández et al. 2006), by wind-blown bubbles driven by evolved massive stars (Martín-Pintado et al. 1999), or by hydrodynamic (HD) or magneto hydrodynamic turbulence (MHD) (Morris & Serabyn 1996). Since the formation of some complex organic molecules is believed to proceed in gas phase after the passage of the shocks and their abundances rapidly evolve, one could use the abundances of these molecules to gain insight into the chemistry of complex molecules in the ISM and to constrain the age of shocks in the GC (Martín-Pintado et al. 2001).
Following these ideas we made a systematic study of 40 molecular clouds in the GC region, between Sgr B2 and Sgr C, in complex molecules believed to be formed on grains like CH3OH, C2H5OH, and HCOOCH3, in gas phase from CH3OH like (CH3)2O and in gas phase and/or grains like HCOOH and H2CO. We also searched for the less abundant isomer of HCOOCH3, the acetic acid (CH3COOH). As tracers of the total column density of the molecular gas, we observed molecules like C18O, 13CO, and CS. Our systematic study shows that all the complex organic molecules present similar relative abundances with respect to CH3OH, except for the regions where photodissociation could be important. Furthermore, the abundance and abundance ratios of these complex molecules in the GC are similar to those observed in hot cores, while hot corino abundances seem to have similar ratios for different objects. Our results suggest that all complex organic molecules have been ejected from grain mantles and that their abundances represent, in first approximation, the grain mantle composition.
| Molecule | Transition | Frequency | S | |
|---|---|---|---|---|
| (MHz) | (K) | |||
| CH3OH……. | E | 145093.75 | 27.06 | 2.38 |
| E | 145097.47 | 19.52 | 2.11 | |
| A+ | 145103.23 | 13.94 | 2.38 | |
| E | 241700.22 | 47.95 | 3.91 | |
| E | 241767.22 | 40.41 | 3.75 | |
| A+ | 241791.43 | 34.83 | 4.94 | |
| 13CH3OH … | E | 141595.48 | 26.71 | 2.43 |
| E | 141597.06 | 19.21 | 2.16 | |
| A+ | 141602.53 | 13.60 | 2.43 | |
| C2H5OH …… | 90117.61 | 9.36 | 5.35 | |
| 104487.26 | 23.26 | 8.61 | ||
| 142285.05 | 37.17 | 12.66 | ||
| HCOOCH3 .. | E | 90145.69 | 19.69 | 17.00 |
| A | 90156.48 | 19.67 | 17.00 | |
| E | 90227.61 | 20.09 | 20.99 | |
| A | 90229.63 | 20.07 | 20.99 | |
| E | 111408.48 | 37.27 | 19.13 | |
| E | 111674.10 | 28.15 | 23.12 | |
| A | 111682.19 | 28.13 | 23.12 | |
| (CH3)2O111EE, AA, EA, and AE substates blended. Only the most intense transition is given. …. | 104703.30 | 31.07 | 5.43 | |
| 111783.01 | 25.26 | 6.80 | ||
| HCOOH ……. | 90164.25 | 23.53 | 5.78 | |
| 111746.79 | 16.13 | 9.65 | ||
| CH3COOH .. | A | 90246.25 | 20.30 | 43.20 |
| E | 90203.44 | 20.30 | 43.20 | |
| A | 111548.53 | 30.50 | 54.80 | |
| E | 111507.27 | 30.50 | 54.80 | |
| CS …………… | 146969.03 | 14.12 | 11.56 | |
| 244936.64 | 35.28 | 19.84 | ||
| C18O …….. | 109782.17 | 5.28 | 0.01 | |
| 219560.35 | 15.82 | 0.02 | ||
| 13CO ……… | 110201.35 | 5.30 | 0.01 | |
| HCO ……. | 141983.74 | 7.11 | 10.87 |
2 Observations and results
The observations of all transitions of the complex organic molecules shown in Table 1 were carried out with the IRAM 30-m radio telescope at Pico Veleta (Spain). The data were obtained in different seasons between 1996 and 2003. The half-power beam width of the telescope was 24′′, 17′′, and 12′′ for the 3, 2, and 1.3 mm bands. The receivers, equipped with SIS mixers, were tuned to single sideband with image rejections 10 dB. The typical system temperatures were 300, 500, and 900 K for the 3, 2, and 1.3 mm lines, respectively. We used two filterbanks of 256 x 1 MHz and one of 512 x 1 MHz as spectrometers. The velocity resolutions provided by the filter banks were 3, 2, and 1.3 km s-1 for the 3, 2, and 1.3 mm bands, respectively. Spectra were calibrated using the standard dual load system. We used the antenna temperature scale () for the line intensities because the emission is rather extended and completely fills the beam.
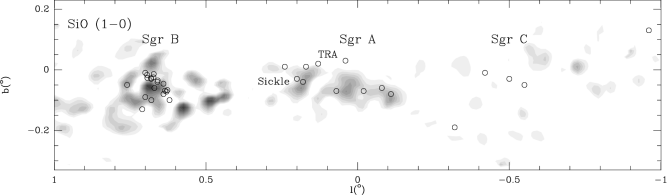
Figure 1 shows the location of the sources we observed superimposed on the large-scale SiO map of the GC by Martín-Pintado et al. (1997). The sources were selected from the SiO maps of Martín-Pintado et al. (1997). Some of these sources had already been observed in C2H5OH by Martín-Pintado et al. (2001). We also included some clouds in Sgr C, the Thermal Radio Arches (TRA) (Serabyn & Güsten 1987), and the Sickle (Serabyn & Güsten 1991), where the C2H5OH emission was not detected by Martín-Pintado et al. (2001). The selected molecular clouds are spread over the region between Sgr C and Sgr B2. The positions of the sources are given in galactic and equatorial coordinates in Table 2. The nomenclature used to designate them is similar to that of Martín-Pintado et al. (2001): MC stands for Molecular Cloud followed by a G and the galactic coordinates, as recommended by the IAU. We grouped the sources in different regions as shown in Fig. 1 and Table 2.
| source | l(o) | b(o) | (B1950) | (B1950) | Region |
|---|---|---|---|---|---|
| MC G0.96+0.13 | 0.96 | +0.13 | 17h 39m 36s6 | -29∘ 39′ 47′′ | Sgr C |
| MC G0.550.05 | 0.55 | 0.05 | 17h 41m 20s0 | -29∘ 24′ 30′′ | Sgr C |
| MC G0.500.03 | 0.50 | 0.03 | 17h 41m 21s2 | -29∘ 21′ 26′′ | Sgr C |
| MC G0.420.01 | 0.42 | 0.01 | 17h 41m 24s1 | -29∘ 15′ 51′′ | Sgr C |
| MC G0.320.19 | 0.32 | 0.19 | 17h 42m 24s7 | -29∘ 17′ 20′′ | Sgr C |
| MC G0.110.08 | 0.11 | 0.08 | 17h 42m 28s0 | -29∘ 02′ 55′′ | Sgr A |
| MC G0.080.06 | 0.08 | 0.06 | 17h 42m 30s0 | -29∘ 00′ 58′′ | Sgr A |
| MC G0.020.07 | 0.02 | 0.07 | 17h 42m 40s0 | -28∘ 58′ 00′′ | Sgr A |
| MC G+0.04+0.03 | +0.04 | +0.03 | 17h 42m 26s2 | -28∘ 51′ 45′′ | TRA |
| MC G+0.070.07 | +0.07 | 0.07 | 17h 42m 54s2 | -28∘ 53′ 30′′ | TRA |
| MC G+0.13+0.02 | +0.13 | +0.02 | 17h 42m 41s4 | -28∘ 47′ 35′′ | TRA |
| MC G+0.17+0.01 | +0.17 | +0.01 | 17h 42m 50s0 | -28∘ 45′ 50′′ | TRA |
| MC G+0.180.04 | +0.18 | 0.04 | 17h 43m 01s0 | -28∘ 47′ 15′′ | Sickle |
| MC G+0.200.03 | +0.20 | 0.03 | 17h 43m 03s6 | -28∘ 45′ 42′′ | Sickle |
| MC G+0.24+0.01 | +0.24 | +0.01 | 17h 42m 59s6 | -28∘ 42′ 35′′ | Sickle |
| MC G+0.620.10 | +0.62 | 0.10 | 17h 44m 18s0 | -28∘ 26′ 30′′ | Sgr B2_a |
| MC G+0.640.08 | +0.64 | 0.08 | 17h 44m 17s5 | -28∘ 24′ 30′′ | Sgr B2_a |
| MC G+0.670.06 | +0.67 | 0.06 | 17h 44m 18s0 | -28∘ 22′ 30′′ | Sgr B2_a |
| MC G+0.680.10 | +0.68 | 0.10 | 17h 44m 27s2 | -28∘ 23′ 20′′ | Sgr B2_a |
| MC G+0.700.01 | +0.70 | 0.01 | 17h 44m 10s0 | -28∘ 19′ 30′′ | Sgr B2_a |
| MC G+0.700.09 | +0.70 | 0.09 | 17h 44m 27s2 | -28∘ 22′ 05′′ | Sgr B2_a |
| MC G+0.710.13 | +0.71 | 0.13 | 17h 44m 38s4 | -28∘ 22′ 25′′ | Sgr B2_a |
| MC G+0.760.05 | +0.76 | 0.05 | 17h 44m 27s2 | -28∘ 17′ 35′′ | Sgr B2_a |
| SGR B2N | +0.68 | 0.03 | 17h 44m 10s6 | -28∘ 21′ 17′′ | Hot Core |
| SGR B2M | +0.66 | 0.04 | 17h 44m 10s6 | -28∘ 22′ 05′′ | Hot Core |
| MC G+0.6940.017 | +0.694 | 0.017 | 17h 44m 10s0 | -28∘ 20′ 05′′ | Sgr B2 |
| MC G+0.6930.027 | +0.693 | 0.027 | 17h 44m 12s1 | -28∘ 20′ 25′′ | Sgr B2 |
| MC G+0.6270.067 | +0.627 | 0.067 | 17h 44m 12s1 | -28∘ 25′ 05′′ | Sgr B2 |
| MC G+0.6300.072 | +0.630 | 0.072 | 17h 44m 13s6 | -28∘ 25′ 05′′ | Sgr B2 |
| MC G+0.6720.014 | +0.672 | 0.014 | 17h 44m 06s1 | -28∘ 21′ 05′′ | Sgr B2 |
| MC G+0.6400.046 | +0.640 | 0.046 | 17h 44m 09s1 | -28∘ 23′ 45′′ | Sgr B2 |
| MC G+0.6350.069 | +0.635 | 0.069 | 17h 44m 13s6 | -28∘ 24′ 45′′ | Sgr B2 |
| MC G+0.6590.035 | +0.659 | 0.035 | 17h 44m 09s1 | -28∘ 22′ 25′′ | Sgr B2 |
| MC G+0.6810.028 | +0.681 | 0.028 | 17h 44m 10s6 | -28∘ 21′ 05′′ | Sgr B2 |
| MC G+0.6730.025 | +0.673 | 0.025 | 17h 44m 09s1 | -28∘ 21′ 25′′ | Sgr B2 |
Note. Galactic and equatorial coordinates of the selected sources. Nomenclature, as recommended by the IAU: MC followed by a G and the galactic coordinates, where MC stands for Galactic center molecular cloud. We have grouped the sources by regions: sources around Sgr C, Sgr A, the TRA, the Sickle, Sgr B2 (_a is to difference two observation sessions), and the hot cores. Not all sources in the TRA or in the Sickle are affected by the same physical conditions.


Figures 2 and 3 show samples of line profiles for all observed molecules toward selected sources. Only for some sources like MC G0.020.07 we did observe all the molecular lines. The line profiles of molecules such as CH3OH are different from those of the CO isotopomers and CS due to the blending of several transitions. The complex organic molecules were only detected in some of the velocity components observed in C18O, 13CO, and CS. A good example of this difference in line profiles is shown in Figs. 2 and 3 for the source MC G+0.760.05 where C18O, 13CO, and CS show three or more velocity components, but C2H5OH only shows one. Each velocity component has been treated as an independent molecular cloud. Multiple velocity components are also found toward MC G+0.13+0.02, MC G+0.180.04, and MC G0.320.19.
3 Analysis of the data
To derive the physical and chemical properties of the selected molecular clouds, we fitted Gaussian profiles to all detected molecular lines for each velocity component. The observed spectra of some organic molecules are more complex than a single Gaussian profile because of the overlap of several transitions due to the large linewidths observed toward the GC clouds. To account for the overlap, we used the following constrains for the Gaussian fitting depending on the observed transitions:
– For molecules without internal rotation, like CS, C18O, 13CO,
HCOOH, and HCO, and for molecules with internal rotation when the
transitions are sufficiently separated, like those of C2H5OH and some of
the HCOOCH3 lines, simple Gaussian profiles were fitted to each
transition for every velocity component.
As mentioned before, the CS, C18O, and 13CO profiles generally show
more velocity components than those observed in the complex organic molecules.
For this work we only fitted the components in the velocity range where
at least one organic molecule was detected. In the case where the velocity
components overlapped we calculated the integrated intensity of CS,
C18O, and 13CO in the velocity range where the complex organic
molecules show the emission.
| molecule | A | B | C | Q | comments | references | ||
|---|---|---|---|---|---|---|---|---|
| (Debye) | (Debye) | (MHz) | (MHz) | (MHz) | ||||
| CH3OH | 0.885 | 1.440 | 127484.00 | 24679.98 | 23769.70 | Rotational levels split into E and A substates. | Menten et al. (1986) | |
| Observed transitions with several blended lines. | Anderson et al. (1990a) | |||||||
| 13CH3OH | 0.899 | 1.440 | 127527.40 | 24083.50 | 23197.00 | Rotational levels split into E and A substates. | Anderson et al. (1990b) | |
| Observed transitions with several blended lines. | Xu & Lovas (1997) | |||||||
| C2H5OH | 0.046 | 1.438 | 34891.77 | 9350.68 | 8135.34 | Rotational levels split into Trans and Gauche substates. | Pearson et al. (1995, 1997) | |
| Only Trans Transitions are exited at . | ||||||||
| HCOOCH3 | 1.630 | 0.680 | 19985.71 | 6914.75 | 5304.48 | Rotational levels split into E and A substates. | Plummer et al. (1984, 1986) | |
| Kuan & Snyder (1996) | ||||||||
| (CH3)2O | 0.000 | 1.302 | 38788.20 | 10056.50 | 8886.80 | Rotational levels spilt into AA, EE, AE and EA substates. | Groner et al. (1998) | |
| : (KaKc: ) AA:EE:AE:EA=6:16:2:4 | ||||||||
| : (KaKc: ) AA:EE:AE:EA=10:16:6:4 | ||||||||
| HCOOH | 1.396 | 0.260 | 77512.25 | 12055.11 | 10416.12 | Willemot et al. (1980) | ||
| Liu et al. (2002) | ||||||||
| CH3COOH | 0.860 | 1.470 | 11335.58 | 9478.73 | 5324.99 | Rotational levels split into E and A substates. | Wlodarczad & Demaison (1988) | |
| Mehringer et al. (1997) | ||||||||
| HCO | 2.332 | 281993.04 | 37809.11 | 33215.94 | Para (Ka=e) and Orto (Ka=o) split, 1(p)-3(o). | Johnson et al. (1972) | ||
| CS | 1.957 | 24495.56 | JPL | |||||
| C18O | 0.111 | 54891.42 | JPL | |||||
| 13CO | 0.111 | 55101.01 | JPL |
– The CH3OH and 13CH3OH profiles are composed of several overlapped
transitions arising from levels at different energies. In this case, we
fitted the blended transitions with multi-Gaussian profiles forced to have
the same linewidth and velocity separations corresponding to the rest
frequencies of the transitions. We also forced the relative intensities
derived from the
spectroscopic parameters (Tables 1 and 3), assuming the same rotational
temperature for all the transitions. In addition to the radial velocity and
linewidth, we also fitted the rotational temperature and the optical depths
that match the observed profiles. In this case, the antenna temperatures were
obtained from (-)(1-).
We used the optically thin emission from 13CH3OH transitions to
test the optical depths and the antenna temperatures obtained from the CH3OH
fits. The optical depths derived from the CH3OH
lines are in good agreement with those obtained from the
[CH3OH/13CH3OH] line-intensity ratios, assuming a 12C/13C
ratio of 20 (Wilson & Rood 1994). For the 13CH3OH, and in
some cases for the CH3OH lines, only the transitions with the largest
intensities were fitted.
In the case of the CH3OH 504
transition, a simple Gaussian fit was made since this line is not
overlapped with any other transition.
– Due to its internal rotation, the (CH3)2O rotational levels are split
into four substates with similar Einstein coefficients but different intensities
due to the nuclear spin degeneracy. These substates are called AA, EE, EA, and AE. Since
the four substates are blended, we measured the integrated intensity of the
four substates and then summed all the spin weights of each substate to derive
the (CH3)2O column densities.
– To obtain the upper limits to the column densities of undetected transitions
like those of CH3COOH, we used the level for the integrated
intensities.
Derived parameters from the Gaussian fits (peak intensity, integrated intensity, radial velocity and linewidth) for all transitions in each source are shown electronically in Table LABEL:obs, available at the CDS.
The linewidths of the complex organic molecules in our sources are 15 km s-1, typical in the GC region. Radial velocities of the different sources range from 93 km s-1 to 140 km s-1.
4 Derived parameters
4.1 Column densities, excitation temperatures, and densities
Molecular column densities were derived by assuming optically thin emission and the local thermodynamic equilibrium (LTE) approximation. In the case of optically thick lines like those of CH3OH, the optically thin isotopic substitution was used. Under these conditions, the total column density, N, of a molecule is given by:
| (1) |
| (2) |
where Nu is the column density in the upper level of the observed transition in cm-2, the upper level degeneracy (2Ju+1), the line frequency in GHz, the dipole moment in Debye, S the line strength, the integrated intensity in K km s-1, the spin weight degeneracy, Q the partition function, the upper level energy in K, and the rotational temperature also in K. Table 3 summarizes the dipole moments, the rotational constants, the partition functions, and the statistical weights used to calculate the total column densities.
4.1.1 Rotational temperatures
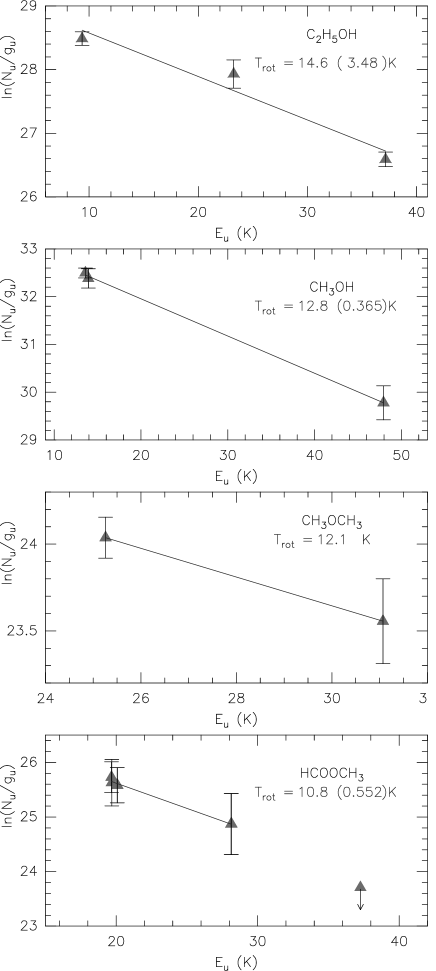
To derive the total column densities one first needs to estimate . For molecules with more than one observed transition, we calculated from population diagrams. Figure 4 shows, as an example, the population diagrams ( vs. ) of some of the organic complex molecules derived for the source MC G0.020.07. In general, from different molecules (third column on Table ORGANIC MOLECULES IN THE GALACTIC CENTER.††thanks: Table 7 is only available in electronic at the CDS via anonymous ftp to cdsarc.u-strasbg.fr (130.79.125.5) or via http://cdsweb.u-strasbg.fr/Abstract.html) agree within a factor of 2. We find values between 6 K and 18 K, much lower than the typical kinetic temperatures of 100 K derived from NH3 by Hüttemeister et al. (1993a) and H2 by Rodríguez-Fernández et al. (2000, 2001a), indicating subthermal excitation. We do not find any systematic trend in as a function of the molecule. For sources with only one observed transition, we assumed an average value of 8 K.
4.1.2 Densities
Once the is derived, we can make a rough estimate of the H2 densities, providing that the kinetic temperatures and the collisional cross section are known. The H2 densities can be estimated from
| (3) |
where is the Einstein coefficient between the upper and the lower levels, the collisional rate coefficient between the same levels, the transition frequency, the Plank constant, the Boltzmann constant, the rotational temperature, the background temperature, and the kinetic temperature. Pottage et al. (2004) have calculated the collision rate coefficients () between E-CH3OH and para-H2 for kinetic temperatures between 5 K and 200 K. Assuming a kinetic temperature of 100 K (Hüttemeister et al. 1993a; Rodríguez-Fernández et al. 2001a), we obtain H2 densities of 10cm-3 for the rotational temperature derived from CH3OH of 6–18 K. Similar H2 densities are also derived when the measured line intensities of E-CH3OH are fitted using the large velocity gradient (LVG) approximation model, provided by J. Cernicharo, for the excitation of E-CH3OH. We also estimated the H2 densities from the excitation temperatures derived from C2H5OH. The collisional cross section in this case was estimated from those of CH3OH but corrected for the difference in mass and size. These roughly estimated H2 densities are also 10cm-3.
The derived H2 densities are based on the collisional rates for a kinetic temperature of 100 K. However, the linewidths in the GC molecular clouds indicate the presence of supersonic turbulence and thus of non-equilibrium processes. In this case the collisional rates will not be described by the kinetic temperatures. However, for the observed transitions the rate coefficients do depend weakly on the increasing collisional velocities (Pottage et al. 2004), therefore our estimated densities will only be marginally affected by the effect of a larger velocity difference between the collisional partners than those represented by the kinetic temperature.
4.1.3 The H2 column densities
To estimate the H2 column density, we used the J=10 and J=21 C18O and the J=10 13CO transitions using the LTE approximation. We used the isotopic ratios of 12C/13C, 16O/18O (Wilson & Rood 1994), and a CO relative abundance of CO/H (Frerking et al. 1982). The last column in Table ORGANIC MOLECULES IN THE GALACTIC CENTER.††thanks: Table 7 is only available in electronic at the CDS via anonymous ftp to cdsarc.u-strasbg.fr (130.79.125.5) or via http://cdsweb.u-strasbg.fr/Abstract.html shows the derived H2 column densities. Our H2 column densities, derived from the LTE approximation, are within a factor of 2 of those derived by Rodríguez-Fernández et al. (2001a) using the LVG approximation.
Table ORGANIC MOLECULES IN THE GALACTIC CENTER.††thanks: Table 7 is only available in electronic at the CDS via anonymous ftp to cdsarc.u-strasbg.fr (130.79.125.5) or via http://cdsweb.u-strasbg.fr/Abstract.html also shows the relative CS abundance estimated from the CS column densities derived using the obtained from CH3OH. Since our data refer to the line emission of the main CS isotopomer, optical depth effects might affect the derived CS column densities (Hüttemeister 1993b). We compared our results with those derived from 13CS by Martín et al. (2006) in several common sources. The CS column densities derived from 13CS are always higher than those of the CS by a factor of 1-5. When the 13CS determinations are available, Table ORGANIC MOLECULES IN THE GALACTIC CENTER.††thanks: Table 7 is only available in electronic at the CDS via anonymous ftp to cdsarc.u-strasbg.fr (130.79.125.5) or via http://cdsweb.u-strasbg.fr/Abstract.html shows the two values estimated for the relative abundance of CS.
4.1.4 Column densities of complex organic molecules
To derive the column densities of the complex organic molecules we used the parameters in Table 3 and Eqs. 1 and 2. The relative abundance of complex molecules derived from their column densities and the H2 column densities are shown in Table ORGANIC MOLECULES IN THE GALACTIC CENTER.††thanks: Table 7 is only available in electronic at the CDS via anonymous ftp to cdsarc.u-strasbg.fr (130.79.125.5) or via http://cdsweb.u-strasbg.fr/Abstract.html.
4.2 Abundances and abundance ratios
Table ORGANIC MOLECULES IN THE GALACTIC CENTER.††thanks: Table 7 is only available in electronic at the CDS via anonymous ftp to cdsarc.u-strasbg.fr (130.79.125.5) or via http://cdsweb.u-strasbg.fr/Abstract.html shows the derived rotation temperatures, fractional abundances, and the H2 column densities for the different molecular clouds. Different sources in the same line of sight are identified by their radial velocities. The fractional abundances of the complex organic molecules are very high, even higher than in the hot cores. The abundances we find reach values up to 1.1 for CH3OH, 6 for C2H5OH, 5.6 for (CH3)2O, 7.5 for HCOOCH3, 4.1 for HCOOH, and 1.9 for H2CO. We have only obtained upper limits to the abundance of CH3COOH between 5 and 5.5.
There are some sources for which only upper limits to the abundances were measured for all the complex organic molecules except for CH3OH. In some cases, like the sources with galactic longitude 0.30∘, the upper limits to the abundances of all complex molecules are not relevant because of the lack of sensitivity of our observations. In this case the upper limits have not been included in the discussion. Other cases, like the C2H5OH upper limits toward MC G+0.180.04, MC G+0.200.03 (Sickle), and MC G+0.13+0.02 (TRA) are relevant and therefore included in our discussion. The molecular emission toward the Sickle shows two velocity components at 25 km s-1 and 80 km s-1, which are believed to be affected by the UV radiation produced by the Quintuplet cluster (Rodríguez-Fernández et al. 2001b). The molecular emission toward MC G+0.13+0.02, located in the TRA, also seems to be affected by the UV radiation from the Arches Cluster. In fact only the -30 km s-1 velocity component, which is clearly associated with the ionized gas (Serabyn & Güsten 1987), shows lower C2H5OH abundance than in other sources.
Because CH3OH is the only molecule that has been detected in all sources and
it is believed to play a central role in the formation of some of the
observed complex organic molecules, we compared the abundances of the rest
of the complex molecules with that of CH3OH.
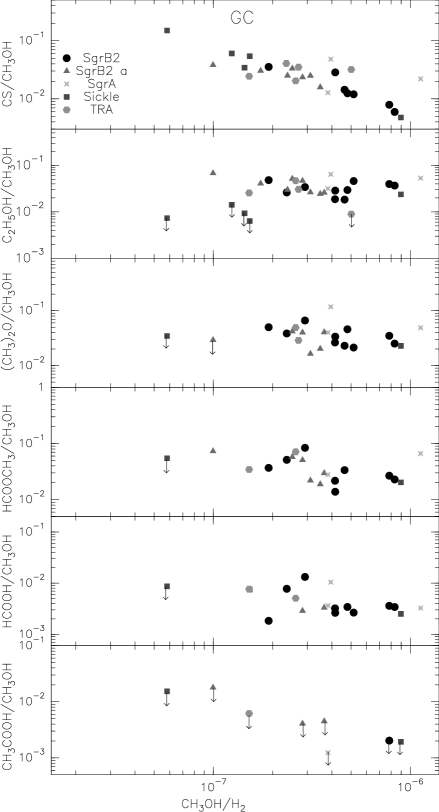
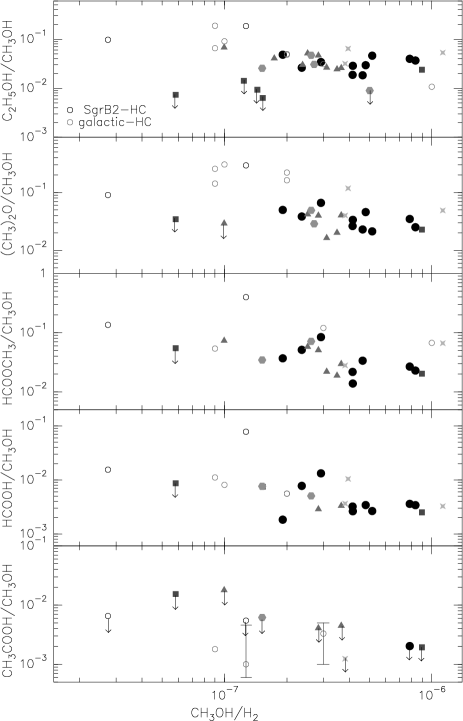
Figure 5 summarizes the results illustrating the abundance of
all the observed molecules relative to that of CH3OH as a function of the
CH3OH abundance. As already mentioned, we have only included the significant
upper limits in this figure.
The main results are:
–In spite of the CH3OH’s
abundance changing by a factor of 50, all the complex organic molecules,
except that of the CH3COOH with only upper limits to its abundance, show a
surprisingly constant relative abundance with respect to CH3OH.
–The mean [C2H5OH/CH3OH] abundance ratio of 3.610-2
is constant within a factor 3.7.
The Sickle and the TRA clouds show upper limits to the [C2H5OH/CH3OH]
ratios, which are a factor of 6 times lower than the mean ratio found in
the typical GC clouds, a factor of 1.6 higher than the scattering of the
data.
–The abundance ratios [(CH3)2O/CH3OH] and [HCOOCH3/CH3OH]
present similar mean values of 3.910-2. These ratios show a
somewhat larger dispersion than that of C2H5OH but are constant within a
factor of 7.
–For the [HCOOH/CH3OH] ratio, we obtained a mean value of
7.910-3 and a dispersion of a factor of 5.3.
–CH3COOH was not been detected in the GC clouds but its
[CH3COOH/CH3OH] ratio must be lower than .
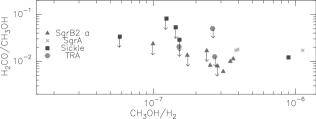
–We also show in Fig. 6 the [H2CO/CH3OH] ratio as a function of the CH3OH abundance. As for the more complex organic molecules, we find a constant ratio of 1.110-2, within a factor 3.
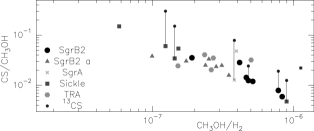
The [CS/CH3OH] abundance ratio is shown in Fig. 7. This abundance ratio decreases by a factor 60 as the CH3OH abundance increases. This is the only molecule for which we find a systematic trend, and the variation is clearly larger than those found for the complex organic molecules. As previously mentioned, our CS column densities could be affected by opacity effects. To show the effects of opacity, we have also included the abundance ratio obtained using the rarer CS isotopomer 13CS in Fig. 7 as vertical bars. The [CS/CH3OH] abundance ratio derived from the optically thin isotopomer increases by a relatively constant value for all clouds independently of the CH3OH abundance. The variation observed in the [CS/CH3OH] ratio as a function of the CH3OH abundance, using the 13CS data, is similar or even larger than that derived from the CS data. We therefore consider that the difference between the behavior of CS and the complex organic molecules is real and related to the different type of chemistry in the GC clouds.
5 Comparison with Galactic disk objects
In dark clouds, where the kinetic temperature is only 10 K, the abundance of complex organic molecules is very low. In the dark cloud TMC-1, the CH3OH, H2CO, and HCOOH abundances are as low as 210-9, 210-8, and 310-10, respectively (see e.g. Turner 2000). For other dark clouds like L183, one finds similar abundances of 810-9 for CH3OH, of 210-8 for H2CO, and of 310-10 for HCOOH (Turner et al. 1999; Dickens et al. 2000). Other complex molecules, like C2H5OH, (CH3)2O, CH3COOH, and HCOOCH3, have not been detected so far, but model predictions suggest C2H5OH abundances of 10-12 (Hasegawa & Herbst 1993). High abundance of the complex organic molecules were first observed in the short-lived (years) objects associated with massive star-forming regions known as hot cores. There, it is believed that grain mantle evaporation release complex molecules, like alcohols, into gas phase. Recently, Bottinelli et al. (2004a, b, 2006) and Kuan et al. (2004) detected relatively large abundances of complex organic molecules, like HCOOCH3 and (CH3)2O, toward the so-called hot corinos associated with warm condensation surrounding low mass proto-stars.
In the following sections, we compare the abundances of complex organic molecules in the GC with those found in the hot cores and hot corinos associated with star formation.
5.1 Hot cores
For the comparison between the GC and hot cores associated to massive star formation, we selected the homogeneous data set by Ikeda et al. (2001) for several hot cores (W51, NGC6334f, G327.30.6, G31.41+0.31, G34.3+0.2, G10.47+0.03, and the Orion Hot Core). We also used data from Remijan et al. (2002, 2003) to obtain the CH3COOH abundances derived from their [HCOOCH3/CH3COOH] ratio. The hot cores abundances of complex molecules and the H2 column densities are given in Table 4. Both the H2 and molecular column densities were derived from observations with similar beam sizes. Then the derived fractional abundances are independent of beam dilution. Since our comparation is based on the relative abundance between complex molecules, our results are not affected by the size of the hot cores.
We also used our data for
the Sgr B2N and Sgr B2M hot cores in Table ORGANIC MOLECULES IN THE GALACTIC CENTER.††thanks: Table 7 is only
available in electronic at the CDS via anonymous ftp to
cdsarc.u-strasbg.fr (130.79.125.5) or via
http://cdsweb.u-strasbg.fr/Abstract.html. Figure 8
illustrates the comparison between the abundance ratios observed for the GC and
those measured in hot cores.
As for the GC clouds, the abundance of CH3OH in hot cores shows
variations of more than one order of magnitude between different objects.
Surprisingly, the abundance ratios relative to CH3OH are also independent of
the CH3OH abundance and similar to those measured for the GC clouds.
The C2H5OH and HCOOH mean abundance ratios with respect to CH3OH
between hot cores and GC clouds are different by less than a factor of 2.
The molecule that presents the largest difference in its abundance ratio with
respect to that in the GC clouds is (CH3)2O with a mean ratio of
210-1, which is 6 times higher than those of the GC clouds.
The [CH3COOH/CH3OH] ratios in hot cores agree with the upper-limit ratios
found in GC clouds.
Our data for the Sgr B2N Hot Core shows slightly higher abundances of
HCOOCH3 and HCOOH than the rest of the hot cores. The Sgr B2M Hot Core,
with the lowest CH3OH abundance, shows similar ratios to those in the GC
sources.
| source | N(H2) | |||||||
|---|---|---|---|---|---|---|---|---|
| High mass222Ikeda et al. (2001) and Remijan et al. (2002, 2003). | ||||||||
| W51 e1/e2 | 3.0 | 0.9 | 3.0 | 0.3–1.8 | 36 | |||
| NGC6334f | 2.0 | 0.9 | 4.0 | 1.0 | 20 | |||
| G327.30.6 | 1.0 | 1.0 | 3.0 | 0.9 | 20 | |||
| G31.41+0.31 | 0.9 | 2.0 | 2.0 | 1.0 | 16 | |||
| G34.3+0.2 | 0.9 | 0.6 | 1.0 | 0.5 | 0.2 | 30 | ||
| G10.47+0.03 | 2.0 | 1.0 | 3.0 | 1.0 | 13 | |||
| Omc HC | 10.0 | 2.0 | 9.0 | 10 | ||||
| Low mass333Bottinelli et al. (2006). | ||||||||
| IRAS 4A | 0.1 | 2.8 | 6.8 | 4.6 | 2.0 | 160 | ||
| IRAS 4B | 7.0 | 120.0 | 220.0 | 1000 | 300.0 | 8.1 | ||
| IRAS 2A | 3.0 | 3.0 | 134.0 | 120 | 20.0 | 21 | ||
| IRAS 16293 | 1.0 | 24.0 | 34.0 | 62 | 10.0 | 7.5 |
It is remarkable that different objects like the hot cores and the GC clouds, with different properties in terms of densities, H2 column densities, and spatial extension, show such uniform abundance ratios of very complex molecules. Hot cores are denser than the GC clouds by more than 2 orders of magnitude, and they typically have larger column densities than the GC clouds.
5.2 Hot corinos
Bottinelli et al. (2004a, b, 2006), Jørgensen et al. (2005) and Kuan et al. (2004) observed the hot corinos associated with the low mass proto-stars, NGC1333 IRAS 4A, NGC1333 IRAS 4B, NGC1333 IRAS 2A and IRAS 16293-2422 (A and B), which also show large abundances of HCOOCH3, H2CO, (CH3)2O and HCOOH. Table 4 summarizes the recent compilation of the hot corino abundances of complex organic molecules by Bottinelli et al. (2006). In this case the molecular abundances were derived by assuming a source size of 0.5′′ for IRAS 4A (Bottinelli et al. 2004a), 0.25′′ for IRAS 4B, 0.43′′ for IRAS 2A (Maret et al. 2004), and 2′′ for IRAS 16293-2422 (Cazaux et al. 2003).
Except for IRAS 4A, which shows lower abundances, HCOOCH3, (CH3)2O, HCOOH, and H2CO show higher abundances in hot corinos than in the GC molecular clouds and hot cores. The data show that the abundance of CH3OH varies between sources by nearly two orders of magnitude, similar to the variation observed in the GC clouds. As in the GC molecular clouds and in the hot cores, the abundance of the complex organic molecules relative to that of CH3OH is independent of the CH3OH abundance for different hot corinos (Bottinelli et al. 2006).
Although the number of observations of hot corinos is still limited, it seems that the abundance ratios, including species believed to be formed by different chemistries, show a similar behavior to the GC sources. However, the abundance of the molecules is very different, as expected if the grain mantle composition in dark clouds were different than in the GC clouds and hot cores.
6 Discussion
With the exception of the clouds associated with the Sickle and the TRA, large
abundances of organic complex molecules like CH3OH, C2H5OH,
(CH3)2O, HCOOCH3, HCOOH, and H2CO seems to be a general
characteristic of molecular clouds in the GC at scales of a few hundred
parsecs.
The main characteristic of the GC molecular gas is that the complex organic
molecules show a constant relative abundance with respect to CH3OH, within a
factor 4–8 over the whole range of the CH3OH abundances in the observed GC
clouds.
This contrasts with the [CS/CH3OH] abundance ratio that
increases by a factor of 60 when the CH3OH abundance decreases.
We now discuss the origin of the chemistry of the complex molecules found in the GC sources, including the low [C2H5OH/CH3OH] abundance ratio measured in the Sickle and the TRA clouds.
| source | T | n(H2) | 444The relative abundances of C2H5OH, (CH3)2O, HCOOCH3, and H2CO with respect to CH3OH predicted by time-dependent chemical models, refer to the age of maximum abundance of the CH3OH’s daughters. | a | a | a | age |
|---|---|---|---|---|---|---|---|
| (K) | (cm-3) | y | |||||
| Galactic center clouds | 100555From Hüttemeister et al. (1993a) and Rodríguez-Fernández et al. (2001a). | 104-105 | 3.66 | 3.87 | 3.96 | 1.1010-2 | |
| hot cores666Mean abundance ratios for the hot core sources used in this work. | 100 | 106 | 6.90 | 21.80 | 8.03 | ||
| Leung et al. (1984)777Model 1 of the referred paper. | 10 | 104 | 0.14 | 6.00 | 43.6 | ||
| Herbst & Leung (1986)888Low-metal model in the referred paper. | 10 | 104 | 2.18 | 5.25 | 9.75 | ||
| Herbst & Leung (1989)e | 10 | 0.99 | 0.12 | 65.5 | |||
| Millar et al. (1991)d | 70 | 2 | 0.19 | 6.3210-2 | 1.26 | 1.18103 | |
| Hasegawa & Herbst (1993)999Model starting with all the H in H2. | 10 | 0.77 | 1.5610-2 | 4.06102 | |||
| Caselli et al. (1993)-CR101010Model fixed with the Orion Compact ridge observations. | 100 | 106 | 1.510-4 | 0.21 | 4.6710-3 | 1.05 | |
| Charnley et al. (1995) | 100 | 2106 | 2 | 1.5 | 410-2 | 0.30 | |
| Rodgers & Charnley (2001)111111Model without NH3. | 100 | 3.75 | 30.00 | 10.00 | |||
| Rodgers & Charnley (2001)121212Model with NH3. | 100 | 20.00 | 12.50 | 0.50 | |||
| Horn et al. (2004)131313Model 3 of the referred paper. | 100 | 0.75 | 3.3310-2 | 1.56 | |||
| Peeters et al. (2006)141414Model with (CH3)2O created only in gas phase. | 100 | 50.00 |
6.1 Models for gas-phase formations of organic molecules
Table 5 shows a compilation of the models proposed to explain the formation of complex organic molecules. Since gas-phase chemistry cannot account for the large abundance of alcohols, such as CH3OH and C2H5OH, or for other organic molecules like the H2CO measured in hot cores, evaporation from grain mantles has been proposed as the main formation mechanism. Most of these models assume that (CH3)2O and HCOOCH3 were produced in gas phase after the ejection of CH3OH. However, it has been recently claimed that HCOOCH3 cannot be produced efficiently in gas phase from CH3OH (Horn et al. 2004). The large abundances of this molecule found in the GC clouds clearly indicate that HCOOCH3 is hardly likely to be produced in gas phase. However, the most recent model from Peeters et al. (2006) studied the possibilities for the formation of (CH3)2O on grain mantles and concluded that the gas-phase reactions are the dominant way to form (CH3)2O, while grain mantle reactions are the minor source.
From the theoretical point of view, so far, only (CH3)2O seems to be
produced in gas phase from reactions involving CH3OH on relatively short
time scales.
Assuming that the gas phase models for the (CH3)2O formation are correct
(see references in Table 5), one would expect large changes in the
relative abundances between the daughter ((CH3)2O) and parent (CH3OH)
molecules as a function of time after ejection/evaporation. One expects low
[(CH3)2O/CH3OH] abundance ratio in early times just when large
abundances of CH3OH are ejected into the gas phase and the gas phase
processing starts. Low [(CH3)2O/CH3OH] ratios are also expected in late
times in the low CH3OH abundance regime when an important fraction of
CH3OH has been converted into daughter molecules and both molecules have been
destroyed by gas-phase reactions.
Between these two regimes, one would expect the [(CH3)2O/CH3OH] ratio to
reach its maximum values, because the daughter molecules reach their maximum
abundance.
From the hot core models, one expects variations in
[(CH3)2O/CH3OH] abundance ratio up to three orders of magnitude as a
function of time.
This contrasts with our data for the GC clouds and the hot cores, which show
variations of less than one order of magnitude. Assuming that the chemical
models for hot cores are applicable in the GC, the only possibility of
explaining the high abundances of complex molecules and
the rather constant [(CH3)2O/CH3OH] abundance ratios is to consider
that all GC clouds in our study, distributed over 200 pc, have undergone the
ejection of CH3OH from grain mantles nearly simultaneously,
105 years ago. This possibility seems very unlikely, suggesting that
(CH3)2O is also ejected from grain mantels.
Since (CH3)2O shows similar abundances with respect to CH3OH than
the other molecules that can only be formed on grain mantles like C2H5OH
and HCOOCH3, our data support the scenario in which all complex organic
molecules in the GC clouds, the hot cores, and also in hot corinos have been
ejected/evaporated from grains.
Previously we also found differences in the behavior of the relative abundances of CS and the complex organic molecules. This behavior is supported by the data in shock regions associated with outflows, as in L1448 (Jiménez-Serra et al. 2005) and L1157 (Bachiller & Pérez Gutiérrez 1997). The CS abundance is enhanced by the shock, but the enhancement of CH3OH is 1 order of magnitude larger than that of CS. This effect of differential ejection of the molecules can explain the variation in the complex organic molecules abundances in gas phase, while the CS abundance remains marginally affected.
6.2 Grain mantle erosion by shocks and time scales for depletion
In the GC clouds, the typical dust-grain temperatures are low (T10–30 K, Rodríguez-Fernández et al. 2004) and the ejection of molecules to gas phase cannot be produced by evaporation like in hot cores, but by shocks with moderate velocities. The shock heats the gas and produces the sputtering of molecules on the grain mantles. For shock velocities of 20 km s-1, the gas temperature can reach 1000 K (Kaufman & Neufeld 1996). After the shock passage, the gas rapidly cools on time scales of 104 years for densities of 10cm-3. The complex molecules ejected from the grains will again stick to the grains or grain mantles. The time scales will depend on the sticking coefficient. A sticking coefficient of 1 is expected for mean velocities corresponding to the thermal velocity at temperatures of 200 K because the complex molecules will be absorbed after every collision with a grain (Tielens & Hagen 1982). However, the sticking coefficient decreases when increasing the relative velocity between the grains and the molecules (Leitch-Devlin & Williams 1985). Buch & Zhang (1991) and Masuda et al. (1998) estimated that the sticking coefficient of H is a function of the mean velocity.
The key parameter is the adsorption energy of the complex molecules, which will depend on the surface of the dust grains. Since the CH3OH abundance in gas phase is relatively large, grain mantles are completely eroded and the most likely grain surfaces in the GC clouds would be graphite and silicates. The absorption energy of CH3OH on carbon basal planes is 1600 K (Aikawa et al. 1996) and on silicates is 2065 K (Allen & Robinson 1977). For the typical mean velocities in the GC of 2–4 km s-1 (see next section) the sticking coefficient will decrease and the time scale for sticking would be 10years on silicates and graphites. Similar time scales are found for the depletion of C2H5OH, HCOOCH3, and (CH3)2O molecules with absorption energies 3000 K on silicates (Allen & Robinson 1977). Short time scales for depletion, like those expected in the GC, would require a mechanism that continuously ejects molecules from the grain mantles.
6.3 Origin of the shocks in the GC
Rodríguez-Fernández et al. (2001a, 2004) have summarized the possible mechanisms for the heating and the chemistry of the molecular gas in the GC. Turbulence and low-velocity shocks are proposed as the most likely mechanism for driving the chemistry. One of the key parameters for constraining the origin of the shocks is the velocity dispersion in the GC molecular clouds. High angular-resolution observation of the envelope of Sgr B2 indicates that the warm molecular gas is highly turbulent with linewidths of 4 km s-1 (Martín-Pintado et al. 1999). Smith et al. (2000) show that MHD turbulence creates a wide range of shock velocities, but the larger amount of them should be produced with Mach numbers between 2–4. In the GC regions the sound speed is 1 km s-1 (at 100 K), and then the more abundant shocks associated with turbulence should have velocities between 2 and 4 km s-1, in agreement with the linewidth measured from high angular-resolution observations. As discussed in the previous section, for a mean velocity of 3 km s-1, the depletion will be 105 years.
The energy of any kind of turbulence will decay if there is not any source injecting new energy. It is interesting to compare the depletion time scales with the turbulence decay time scales to establish if the turbulence can maintain mean velocities that are high enough to match the depletion time scales. The turbulence decays as , where 0.8–1.0 (Mac Low et al. 1998; Stone et al. 1998). The decay time scale of these turbulences is similar to one dynamical time (=, where L is the turbulent length and the turbulent velocity, Avila-Reese & Vázquez-Semadeni 2001; Elmegreen & Scalo 2004), for both HD and MHD turbulence. The dynamical time for turbulence in the GC, assuming a turbulent length of 5 pc and a turbulent velocity dispersion of km s-1 (observed GC linewidths), is 310years, close to the depletion time scale. Since we do not observe large depletions in our data, the existence of faster shocks with velocities high enough to produce the sputtering of the grain mantles and with the time scales between shocks similar to the time scales for depletion, 10years is required. Shocks with velocities of 6 km s-1 are required in order to sputter molecules from the icy mantles on graphite and silicate grains by heavy atoms (Draine & Salpeter 1979). Then, if due to a sudden event, the turbulence generated by this event could explain the presence of complex organic molecules in the GC clouds for 105 years.
It is so far unclear what produces the supersonic turbulence and/or frequent shocks in the GC. The high-velocity shocks and the presence of a highly turbulent medium in the GC could be due to: a) the kinematics of the gas subjected to the barred potential of our Galaxy, b) the wind-blown bubbles produced in evolved massive stars like supernovas, or c) cloud-cloud collisions. The time scales needed in the GC to maintain the large abundances are much smaller than those associated to the quasi-circular orbits (1107 years), and a large number of large scale shocks would be required to explain the observed properties of the complex molecules. The other possible mechanisms could explain the observations if cloud-cloud collision and energetic events driven by massive stars occur on time scales of 105 years. In the scenario of a recent star burst in the GC as proposed to explain the fine structure lines of ionized gas (Rodríguez-Fernández & Martín-Pintado 2005), frequent energetic events associated to massive stars are expected to produce shocks with moderate velocities of 10 km s-1 (Martín-Pintado et al. 1999) ejecting complex molecules to gas phase and a large amount of energy into the ISM.
6.4 The chemistry of complex molecules in the Galaxy
The proposed gas-phase chemistry for some complex molecules does not seem to explain the similar abundances ratios observed in the GC clouds, in hot cores, and in hot corinos. From the empirical data gathered there, we can conclude that the most likely explanation for the large abundance of CH3OH, HCOOH, HCOOCH3, (CH3)2O and C2H5OH is that all these molecules are ejected from grains. It is interesting to note that in this scenario, the ice-mantle composition in complex organic molecules in the GC and in hot cores must be very similar. This is surprising in view of the changes of the complex organic molecules abundances observed in the hot corinos. The presence of complex molecules on grains can be due to grain chemistry or to the depletion after formation in gas phase.
Further investigations of the abundance of organic molecules in dark clouds are needed to constrain the molecules formed on ice mantles by grain chemistry in different types of molecular clouds.
6.5 Sources with low C2H5OH abundances
We also observed some clouds where the relative abundance of some organic
complex molecules like C2H5OH seems to be significantly smaller than
expected from these observed in other sources in the GC.
These sources are the Sickle (MC G+0.18+0.04 and MC G+0.20+0.03)
and the -30 km s-1 velocity component of the TRA (MC
G+0.13+0.02). We detected high CH3OH abundances of 10-7, but only
significant upper limits, 0.4-510-9 to the C2H5OH
abundance.
The stars from the Quintuplet and the Arches Clusters are said to heat and
ionize the Sickle and the TRA (Rodríguez-Fernández et al. 2001b) creating
photodissociation-regions (PDRs) around them.
In particular, the -30 km s-1 component is clearly associated
with the TRA (Serabyn & Güsten 1987).
The chemistry in these sources is then expected to be strongly affected by the presence of the UV radiation. It is very likely that the complex molecules in these sources are ejected to gas phase by shocks with the same abundances as observed in other GC molecular cloud. Additional evaporation from grain mantles can be ruled out since the heating will require UV photons that will also destroy the complex molecules. Due to a large UV radiation-field, the relative abundance of the complex molecules will be affected by dissociation. One can make a rough estimate of the effects of the UV radiation on the molecular abundances by comparing their photodissociation rates. Using the UMIST RATE99 (Le Teuff et al. 2000) and the Ohio State University databases151515www.physics.ohio-state.edu/eric/research.html, we found that the photodissociation rates of (CH3)2O and C2H5OH are larger than those of CH3OH, HCOOH and H2CO.

In Fig. 9 we show the results of a simple model in which we represent how the ejected complex organic molecules are photodestroyed as a function of time and visual extinction. The model considers a far-ultraviolet incident field 103 times higher than in the local ISM (G0=103), which is the typical radiation field observed in GC PDRs (Rodríguez-Fernández et al. 2004). For the regions with low , all the abundances decrease, but the abundance of C2H5OH decreases faster than the other organic complex molecules. Obviously the time scale for photodissociation depends on the visual extinction. We estimate a visual extinction of 4–17 mag for the Sickle and the TRA using our H2 column densities in Table ORGANIC MOLECULES IN THE GALACTIC CENTER.††thanks: Table 7 is only available in electronic at the CDS via anonymous ftp to cdsarc.u-strasbg.fr (130.79.125.5) or via http://cdsweb.u-strasbg.fr/Abstract.html and the conversion factor given by Bohlin (1975), (mag)=10N (cm-2). The photodissociation times scales for CH3OH will be comparable to depletion time scales for an averaged visual extinction of 8 mag.

For this visual extinction the other complex organic molecules will photodissociate much faster than the depletion time scale. This suggests that in the presence of UV radiation, large abundances of molecules like C2H5OH would require more frequent shocks than in the shielded regions. This is illustrated in Fig. 10, where we present the results of a simple model to show the time evolution of complex organic molecules in a region of =8 mag. In this model, we consider the effects of the UV radiation on the complex molecules that have been ejected by periodic shocks of 5years. They are ejected with the abundances measured in the GC and are destroyed because of the photodissociation. This simple model reproduces the constant high abundances observed for CH3OH, while the abundances of C2H5OH can vary by 3 orders of magnitude. In agreement with the observations, the photodissociation can reproduce the low abundances of C2H5OH in specific regions in the GC clouds. Further observation of complex organic molecules toward PDRs in the Galactic disk and in the Galactic center are required to test the proposed scenario.
7 Conclusion
We have found very high abundances for the complex organic molecules CH3OH, C2H5OH, HCOOCH3, (CH3)2O, and HCOOH in the GC regions, similar to or even higher than those measured in Galactic hot cores. The abundance ratios of these molecules are fairly constant in all the GC clouds. The most likely explanation for these large abundances is that they have been ejected from grain mantles by shocks. The highly turbulent molecular clouds in the GC could help to maintain the large gas phase abundance of complex molecules for time scales of 105 years after the ejection by shocks. The rather uniform abundance ratios in clouds distributed over 200 pc indicate that the average composition of grain mantles is similar for all the GC clouds and also for the hot cores in the Galactic disk. We found that, in the GC PDRs, UV photons can differentially photodissociate the complex molecules, changing their relative abundances dramatically.
Acknowledgements.
We wish to thank S. Bottinelli and her co-authors for communicating the results of their work prior to publication. This work was supported by the Spanish Ministerio de Educación y Ciencia under projects AYA 2002-10113-E, AYA 2003-02785-E, and ESP 2004-00665.References
- Aikawa et al. (1996) Aikawa, Y., Miyama, S. M., Nakano, T., & Umebayashi, T. 1996, ApJ, 467, 684
- Allen & Robinson (1977) Allen, M., & Robinson, G. W. 1977, ApJ, 212, 396
- Anderson et al. (1990a) Anderson, T., de Lucia, F., & Herbst, E. 1990a, ApJ, 72, 797
- Anderson et al. (1990b) Anderson, T., Herbst, E., & de Lucia, F. C. 1990b, ApJ, 74, 647
- Avila-Reese & Vázquez-Semadeni (2001) Avila-Reese, V., & Vázquez-Semadeni, E. 2001, ApJ, 553, 645
- Bachiller & Pérez Gutiérrez (1997) Bachiller, R., & Pérez Gutiérrez, M. 1997, ApJ, 487, L93
- Bohlin (1975) Bohlin, R. C. 1975, ApJ, 200, 402
- Bottinelli et al. (2004a) Bottinelli, S., Ceccarelli, C., Lefloch, B. et al. 2004a, ApJ, 615, 354
- Bottinelli et al. (2004b) Bottinelli, S., Ceccarelli, C., Neri, R. et al. 2004b, ApJ, 617, L69
- Bottinelli et al. (2006) Bottinelli, S., Ceccarelli, C., Williams, J. P., & Lefloch, B. 2006, A&A, submited
- Buch & Zhang (1991) Buch, V., & Zhang, Q. 1991, ApJ, 379, 647
- Caselli et al. (1993) Caselli, P., Hasegawa, T. I., & Herbst, E. 1993, ApJ, 408, 548
- Cazaux et al. (2003) Cazaux, S., Tielens, A. G. G. M., Ceccarelli, C., et al. 2003, ApJ, 593, L51
- Charnley et al. (1995) Charnley, S. B., Dress, M. E., Tielens, A. G. G. M., & Millar, T. J. 1995, ApJ, 448, 232
- Draine & Salpeter (1979) Draine, B. T., & Salpeter, E. E. 1979, ApJ, 231,438
- Dickens et al. (2000) Dickens, J. E., Irvine, W. M., Snell, R. L., et al. 2000, ApJ, 54, 870
- Elmegreen & Scalo (2004) Elmegreen, B. G., & Scalo, J. 2004, ARA&A, 42, 211
- Frerking et al. (1982) Frerking, M. A., Langer, W. D., & Wilson, R. W., 1982, ApJ, 262, 590
- Gottlieb et al. (1979) Gottlieb, C. A., Ball, J. A., Gottlieb, E. W., & Dickinson, D. F. 1979, ApJ, 227, 422
- Groner et al. (1998) Groner, P., Albert, S., Herbst, E., & de Lucia, F. C. 1998, ApJ, 500, 1059
- Güsten & Philipp (2004) Güsten, R. & Philipp, S. 2004, astro-ph/0402019
- Hasegawa & Herbst (1993) Hasegawa, T. I., & Herbst, E. 1993, MNRAS, 261, 83
- Hasegawa et al. (1994) Hasegawa, T., Sato, F., Whiteoak, J. B., & Miyawaki, R. 1994, ApJ, 429, L77
- Herbst & Leung (1986) Herbst, E., & Leung, C. M. 1986, MNRAS, 222, 689
- Herbst & Leung (1989) Herbst, E., & Leung, C. M. 1989, ApJ, 69, 271
- Horn et al. (2004) Horn, A., Mllendal, H., Sekiguchi, O. et al. 2004, ApJ, 611, 605
- Hüttemeister et al. (1993a) Hüttemeister, S., Wilson, T. L., Bania, T. M., & Martín-Pintado, J. 1993a, A&A, 280, 255
- Hüttemeister (1993b) Hüttemeister 1993b, PhD dissertation, Bonn University
- Hüttemeister et al. (1998) Hüttemeister, S., Dahmen, G., Mauesberer, R., Henkel, C., Wilson, T. L., & Martín-Pintado, J. 1998, A&A, 334, 646
- Ikeda et al. (2001) Ikeda, M., Ohishi, M., Nummelin, A., Dickens, J. E. et al. 2001, ApJ, 560, 792
- Jiménez-Serra et al. (2005) Jiménez-Serra, I., Martín-Pintado, J., & Rodríguez-Franco, A. 2005, ApJ, 627, L121
- Johnson et al. (1972) Johnson, D. R., Lovas, F., & Kirchhoff, W. H. 1972, J. Phys. Chem. Ref. Data, 1, 1972
- Jørgensen et al. (2005) Jørgensen, J. K., Schöier, F. L., & van Dishoeck, E. F. 2005, A&A, 437, 501
- Kaufman & Neufeld (1996) Kaufman, M. J., & Neufeld, D. A. 1996, ApJ, 456, 611
- Kuan & Snyder (1996) Kuan, Y.-J., & Snyder, L. E. 1996, ApJ, 470, 981
- Kuan et al. (2004) Kuan, Y.-J., Huang, H.-C., Charnley, S. B. et al. 2004, ApJ, 616, L27
- Le Teuff et al. (2000) Le Teuff, Y. H., Millar, T. J., & Markwick, A. J. 2000, A&AS, 146, 157
- Leitch-Devlin & Williams (1985) Leitch-Devlin, M. A., & Williams, D. A. 1985, MNRAS, 213, 295
- Leung et al. (1984) Leung, C. M., Herbst, E., & Huebner, W. F. 1984, ApJS, 56, 231
- Liu et al. (2002) Liu, S.-Y., Girart, J. M., Remijan, A. J., & Snyder, L. E. 2002, ApJ, 576, 255
- Mac Low et al. (1998) Mac Low, M.-M., Dlessen, R. S., Burkert, A., & Smith, M. D. 1998, Phys. Rev. Lett., 80, 2754
- Maret et al. (2004) Maret, S., Ceccarelli, C., Caux, E., et al. 2004, A&A, 416, 577
- Martín et al. (2006) Martín et al. (2006) in preparation
- Martín-Pintado et al. (1997) Martín-Pintado, J., de Vicente, P., Fuente, A., & Planesas, P. 1997, ApJ, 482, L45
- Martín-Pintado et al. (1999) Martín-Pintado, J.,Gaume, R. A., Rodríguez-Fernández, N. J., de Vicente, P., & Wilson, T. L. 1999, ApJ, 519, 667
- Martín-Pintado et al. (2001) Martín-Pintado, J., Rizzo, J. R., de Vicente, P., Rodríguez-Fernández, N. J., & Fuente, A. 2001, ApJ, 548, L65
- Masuda et al. (1998) Masuda, K., Tkahashi, J., & Mukai, T. 1998, A&A, 330, 773
- Mehringer et al. (1997) Mehringer, D. M., Snyder, L. E., & Miao, Y. 1997, ApJ, 480, L71
- Menten et al. (1986) Menten, K. M., Walmsley, C. M., Henkel, C., & Wilson, T. L. 1986, A&A, 157, 318
- Millar et al. (1991) Millar, T. J., Herbst, E., & Charnley, S. B. 1991, ApJ, 369, 147
- Minh et al. (1992) Minh, Y. C., Irvine, W. M., & Friberg, P. 1992, A&A, 258, 489
- Morris & Serabyn (1996) Morris, M., & Serabyn, E. 1996, ARA&A, 34, 645
- Pearson et al. (1995) Pearson, J. C., Sastry, K. V. L. N., Winnewisser, M., Herbst, E., & de Lucia, F. C. 1995, J. Phys. Chem. Ref. Data, 24, 1
- Pearson et al. (1997) Pearson, J. C., Sastry, K. V. L. N., Herbst, E., & de Lucia, F. C. 1997, ApJ, 480, 420
- Peeters et al. (2006) Peeters, Z., Rodgers, S. D., Charnley, S. et al. 2006, A&A, 445, 197
- Plummer et al. (1984) Plummer, G. M., Herbst, E., de Lucia, F. C., & Blake, G. A. 1984, ApJ, 55, 633
- Plummer et al. (1986) Plummer, G. M., Herbst, E., de Lucia, F. C., & Blake, G. A. 1986, ApJ, 60, 949
- Pottage et al. (2004) Pottage, J. T., Flower, D. R., & Davis, S. L. 2004, MNRAS, 352, 39
- Remijan et al. (2002) Remijan, A., Snyder, L. E., Liu, S.-Y., Mehringer, D. M., & Kuan, Y.-J. 2002, ApJ, 576, 264
- Remijan et al. (2003) Remijan, A., Snyder, L. E., Friedel, D. N., Liu, S.-Y., & Shah, R.-Y. 2003, ApJ, 590, 314
- Rodgers & Charnley (2001) Rodgers, S. D., & Charnley, S. B. 2001, ApJ, 546, 324
- Rodríguez-Fernández et al. (2000) Rodríguez-Fernández, N. J., Martín-Pintado, J., de Vicente, P. et al. 2000, A&A, 356, 695
- Rodríguez-Fernández et al. (2001a) Rodríguez-Fernández, N. J., Martín-Pintado, J., Fuente, A., de Vicente, P., Wilson, T. L., & Hüttemeister, S. 2001a, A&A, 365, 174
- Rodríguez-Fernández et al. (2001b) Rodríguez-Fernández, N. J., Martín-Pintado, J., & de Vicente, P. 2001b, A&A, 377, 631
- Rodríguez-Fernández et al. (2004) Rodríguez-Fernández, N. J., Martín-Pintado, J., Fuente, A., & Wilson, T. L. 2004, A&A, 427, 217
- Rodríguez-Fernández & Martín-Pintado (2005) Rodríguez-Fernández, N. J., & Martín-Pintado, J. 2005, A&A, 429, 923
- Rodríguez-Fernández et al. (2006) Rodríguez-Fernández, N. J., Combes, F., Martín-Pintado, J. Wilson, T. L., & Apponi, A. 2006, A&A, submited
- Serabyn & Güsten (1987) Serabyn, E., & Güsten, R. 1987, A&A, 184, 133
- Serabyn & Güsten (1991) Serabyn, E., & Güsten, R. 1991, A&A, 242, 376
- Smith et al. (2000) Smith, M. D., Mac Low, M.-M., & Zuev, J. M. 2000 A&A, 356, 287
- Stone et al. (1998) Stone, J. M., Ostriker, E. O., & Gammie, C. F. 1998, ApJ, 508, L99
- Tielens & Hagen (1982) Tielens, A. G. G. M., & Hagen, W. 1982, A&A, 114, 245
- Turner et al. (1999) Turner, B. E., Terziava, R., & Herbst, E. 1999, ApJ, 518, 699
- Turner (2000) Turner, B. E. 2000, ApJ, 542, 837
- Willemot et al. (1980) Willemot, E., Dangoisse, D., Monnanteuil, N., & Bellet, J. 1980, JPCRD, 9, 59
- Wilson & Rood (1994) Wilson, T. L., & Rood, R. T. 1994, ARAA, 32, 191
- Wlodarczad & Demaison (1988) Wlodarczad, G., & Demaison, J. 1988, A&A, 192, 313
- Xu & Lovas (1997) Xu, L.-H., & Lovas, F. L. 1997, JPCRD, 26, 17
[x]l c l c c c c c c c c c Relative abundances and H2 column densities
source
N(H2)
(km s-1)(K)
cm-2
\endhead\endfootMC G0.96+0.13 140 8.0111Derived from CH3OH. 10.6 1.4 8.3 10.7 12.2 30.0 16.6 0.2
MC G0.550.05 93 8.01 1.6 1.8 0.6 2.7 1.0 8.5 3.6 1.5
MC G0.500.03 92 8.01 0.4 1.0 0.3 1.1 0.4 3.6 1.6 2.5
MC G0.420.01 71 8.01 0.6 1.9 0.6 2.9 1.1 9.5 3.5 0.6
MC G0.320.19 70.4 8.01 0.9 0.8 18.1 6.2 23.4 17.5 10.0 0.2
MC G0.320.19 24 8.01 0.2 0.6 6.3 4.5 17.0 12.7 7.3 0.2
MC G0.320.19 26 8.01 1.1 2.6 27.0 19.5 73.3 54.7 24.5 0.07
MC G0.110.08 19.8 12.0222Derived from C2H5OH.-10.01 11.3 6.0 5.6 7.5 3.7 3.9 19.5 25.0/43.4 333From 13CS (Martín et al. 2006). 1.0
MC G0.080.06 29.6 10.02-12.01 4.0 2.5 4.7 2.6 4.1 4.5 7.1 19.0 0.6
MC G0.020.07 47 10.8444Derived from HCOOCH3.-14.02 3.8 1.2 1.5 1.1 1.4 0.5 6.6 4.9/17.5 3 6.8
MC G+0.04+0.03 26 10.01 2.7 0.8 0.8 0.7 0.6 2.0 3.4 9.5 1.1
MC G+0.070.07 52 10.01-12.82 2.6 1.2 1.3 1.9 1.3 1.9 13.1 5.3 2.2
MC G+0.13+0.02 30 8.0555Assumed 8 K. 5.0 0.5 1.4 3.4 2.1 9.4 16.1 0.6
MC G+0.13+0.02 52 8.05 2.4 0.5 1.6 3.7 2.4 10.5 9.6 0.4
MC G+0.17+0.01 59 101-12.72 1.5 0.4 0.3 0.5 1.2 0.9 3.1 3.7 1.3
MC G+0.180.04 27.1 8.05 1.2 0.2 0.8 0.9 1.7 2.5 10.2 7.5/37.3 3 0.7
MC G+0.180.04 85.8 8.05 1.4 0.1 0.6 0.7 1.3 1.9 7.8 5.0/22.0 3 0.8
MC G+0.200.03 24.9 8.05 0.6 0.04 0.2 0.3 0.5 0.9 2.0 8.7 1.7
MC G+0.200.03 87.7 8.05 1.5 0.09 0.4 0.7 1.1 2.0 4.4 8.3 0.9
MC G+0.24+0.01 36 12.62-8.01 9.0 2.1 2.1 1.8 2.3 1.7 10.9 4.3/11.3 3 3.0
MC G+0.620.10 56 11.02-7.81 3.5 0.8 0.7 0.7 0.3 1.1 3.5 5.5 2.6
MC G+0.640.08 63 10.021 10.0 0.7 0.3 0.7 0.4 1.8 2.4 3.8 2.0
MC G+0.670.06 51 10.52 3.1 0.8 0.5 0.7 0.4 1.3 1.9 7.8 3.1
MC G+0.680.10 21 9.02-6.04 2.5 1.3 1.1 1.5 0.4 1.3 2.1 8.4 3.2
MC G+0.700.01 62 11.02-10.01 3.7 0.9 1.5 1.1 1.2 1.6 4.2 2.8
MC G+0.700.09 43 10.01 1.7 0.7 0.3 1.3 0.4 3.6 2.4 5.3 2.9
MC G+0.710.13 40 8.01 2.4 0.8 0.6 2.8 0.9 7.9 0.6 6.0 2.8
MC G+0.760.05 27 10.014 2.8 1.3 1.1 1.5 0.8 1.2 2.3 6.7 3.8
MC G+0.6940.017 66 8.01-11.04 8.3 3.1 2.1 1.9 2.8 2.4 5.0 3.9
MC G+0.6930.027 68 10.01-11.54 7.8 3.1 2.7 2.1 2.8 1.6 6.2/15.0 3 4.1
MC G+0.6270.067 49 10.01-6.04 4.8 1.4 2.2 0.8 1.6 2.2 6.0/11.7 3 2.2
MC G+0.6300.072 46 9.01-12.0666Derived from (CH3)2O.
5.2 2.4 1.1 0.9 1.4 2.5 6.2 1.4
MC G+0.6720.014 54 10.014 1.9 0.9 1.0 0.7 0.4 1.2 6.8 5.5
MC G+0.6400.046 58 10.01-7.06 4.2 1.2 1.4 0.6 1.1 1.6 11.9 4.7
MC G+0.6350.069 48 11.06-8.04 4.6 0.9 1.1 1.6 0.6 2.5 6.7 2.3
MC G+0.6590.035 62 11.01-16.04 4.2 0.8 1.1 0.9 1.3 0.7 13.9
MC G+0.6810.028 65 11.01-12.04 2.9 1.0 1.9 2.5 3.9 0.8 8.8
MC G+0.6730.025 68 18.54-13.91 2.4 0.6 0.9 1.2 1.8 0.8 14.6
SGR B2N 65 72.62 1.3 2.3 3.5 5.0 9.9 0.7 19.0
SGR B2M 63 55.42 0.3 0.3 0.3 0.4 0.4 0.2 65.0