The Discovery of Three New Quasars in the AGN and Galaxy Evolution Survey
Abstract
We present the discovery of three quasars in the AGN and Galaxy Evolution Survey (AGES) spectroscopic observations of the NOAO Deep Wide-Field Survey (NDWFS) Boötes Field. These quasars were selected as part of a larger Spitzer mid-infrared quasar sample with no selection based on optical colors. The highest redshift object, NDWFS J142516.3+325409, , is the lowest-luminosity quasar currently known. We compare mid-infrared techniques for identifying quasars to more traditional optical techniques and show that mid-infrared colors allow for selection of high-redshift quasars even at redshifts where quasars lie near the optical stellar locus and at where optical selection is impossible. Using the superb multi-wavelength coverage available in the NDWFS Boötes field, we construct the spectral energy distributions (SEDs) of high-redshift quasars from observed -band to 24 (rest-frame 600 Å - 3.7 ). We show that the three high-redshift quasars have quite similar SEDs, and the rest-frame composite SED of low-redshift quasars from the literature shows little evolution compared to our high-redshift objects. We compare the number of quasars we have discovered to the expected number from published quasar luminosity functions. While analyses of the quasar luminosity function are tenuous based on only three objects, we find that a relatively steep luminosity function with provides the best agreement with the number of high-redshift quasars discovered in our survey.
Subject headings:
quasars: general; quasars: emission line1. Introduction
Understanding the evolution of quasars through cosmic time allows us to study the history of accretion of matter onto supermassive black holes in the nuclei of galaxies. In addition, quasars at high redshift provide the lighthouses needed to probe the conditions under which galaxies initially formed near the epoch of re-ionization. Samples of quasars at high redshift, however, are still quite small and most high-redshift quasar surveys are only sensitive to the most luminous examples of these objects. We know very little about the population of low-luminosity quasars at these early times.
Surveys for low-redshift quasars have been quite successful and have led to quasar samples suitable for detailed statistical studies of the evolution of the quasar luminosity function to moderate redshifts (Schmidt & Green 1983; Boyle et al. 2000; Fan et al. 2001b, a; Wolf et al. 2003; Croom et al. 2004; Richards et al. 2005; Barger et al. 2005; Brown et al. 2006; Jiang et al. 2006; Richards et al. 2006). Censuses of high-redshift objects have opened the Universe even back to the era of reionization, but the number of such objects is still small. Deep spectroscopic follow-up of -dropout objects in the Sloan Digital Sky Survey (SDSS) (York et al. 2000) have found 19 quasars at (Fan et al. 2001c, 2003, 2004, 2005). Zheng et al. (2000) and Chiu et al. (2005) found 7 quasars at based on SDSS photometry which complement the 17 quasars at found in SDSS DR3 (Abazajian et al. 2005) spectroscopy selected as outliers from the stellar locus (Schneider et al. 2005). SDSS imaging, however, is relatively shallow () and thus the quasars found using SDSS photometry probe only the luminous tail of the quasar luminosity function. Furthermore, the use of optical photometry for selecting high-redshift quasars is biased against heavily reddened objects, as the observed optical flux from objects at probes the rest-frame ultraviolet emission which is most heavily affected by dust and the strong absorption from neutral hydrogen in the intergalactic medium.
The difficulty of conducting deep, wide-area multi-color surveys has meant that only a handful of lower-luminosity sources have been reported. Stern et al. (2000) found a faint quasar () at in a small area imaged approximately 4 magnitudes deeper than SDSS. A quasar at () was selected based on 1 Ms of X-ray imaging in the Chandra Deep Field North (Barger et al. 2002). Djorgovski et al. (2003) imaged the field around the quasar SDSS J0338+0021 at and discovered a second quasar at , a magnitude fainter than the SDSS detection limit (). Mahabal et al. (2005) imaged the field around the quasar SDSS J1148+5251 and report the discovery of a faint () quasar.
Unfortunately, the number of successful searches for faint high-redshift quasars is comparable to the number of surveys with negative results. Barger et al. (2003) found no additional high-redshift quasars in the full 2 Ms imaging of the Chandra Deep Field North that were not detected in 1 Ms of observation and Cristiani et al. (2004) found no high-redshift objects based on deep X-ray imaging of the Hubble Deep Field North and Chandra Deep Field South. Willott et al. (2005) imaged 3.8 deg2 of sky in and and Sharp et al. (2004) imaged 1.8 deg2 in reaching 3 and 2 magnitudes deeper than SDSS, respectively, but neither survey detected any new low-luminosity, high-redshift quasars.
In this paper, we present photometry and spectroscopy of three new high-redshift () quasars using the multi-wavelength photometry available in the NOAO Deep Wide-Field Survey (NDWFS; Jannuzi & Dey 1999, Dey et al., in prep.) Boötes field and spectroscopic observations from the AGN and Galaxy Evolution Survey (AGES; Kochanek et al., in prep), which provides redshifts for several highly-complete samples of quasars to mag, nearly 2 mag fainter than SDSS selects high-redshift objects. With our three newly discovered quasars, we compare the number density inferred from this survey to predictions based on quasar luminosity functions in the literature.
This paper is organized as follows: in §2, we summarize all the multi-wavelength photometry used in the paper and in §3 we discuss our spectroscopic observations. We compare the mid-infrared selection of quasars utilized in this work to optical criteria used in the past in §4. Finally, we place our survey in context with past studies of the quasar luminosity function and consider future high-redshift quasar searches in §5. All optical photometry presented here are corrected for foreground galactic reddening using the dust maps of Schlegel, Finkbeiner, & Davis (1998). We use AB magnitudes for all bands (Oke 1974), although the photometric catalogs from the NDWFS and FLAMINGOS Extragalactic Survey (FLAMEX; Elston et al. 2005) present Vega magnitudes111, , , , and . Flux measurements from Spitzer are converted to AB magnitudes using . Also, when quoting optical, near-infrared, and IRAC photometry, we use SExtractor (Bertin & Arnouts 1996) MAG_AUTO magnitudes (which are comparable to Kron total magnitudes; Kron 1980) due to their small systematic errors and uncertainties at faint fluxes. When calculating luminosities, we use a flat cosmology and km s-1 Mpc-1.
2. Multi-wavelength Photometry
2.1. NOAO Deep Wide-Field Survey
We utilize the deep optical () and
near-infrared () imaging of the 9.3 deg2
Boötes field provided by the
third data release from the NOAO Deep Wide-Field
Survey (Jannuzi & Dey 1999). A full description of the
observing strategy and data reduction will be presented elsewhere
(Jannuzi et al., in prep; Dey et al., in prep) and the data can be obtained publicly
from the
NOAO Science Archive222http://www.archive.noao.edu/ndwfs
http://www.noao.edu/noao/noaodeep.
The NDWFS catalogs reach ,
, , and at 50% completeness.
2.2. Boötes
We imaged 8.5 of the sky, covering 7.7 of the NDWFS Boötes field, between 29 January 2005 and 31 March 2005 in the -band with 90Prime (Williams et al. 2004) on the Bok 2.3m telescope on Kitt Peak. The 90Prime imager offers a 1 field of view when mounted at prime focus on the Bok telescope. Exposure times range from 1–2.5 hours throughout the field with typical seeing of 18. Images were flatfielded using observations of the twilight sky. For each night of observations, we stack all of the dithered -band images to produce a high signal-to-noise ratio image of the fringing pattern in the detector. This master fringe image is then scaled and subtracted from each object frame to remove the strong fringing pattern.
We calibrate the astrometry and photometry of these -band images using public imaging from the Sloan Digital Sky Survey DR4 (York et al. 2000; Adelman-McCarthy et al. 2005). Cross comparisons between Boötes and SDSS show a 01 rms dispersion in the astrometry and a 5% scatter in the photometry for bright stars (). This 5% scatter is likely a combination of photometric calibration errors in SDSS (expected to be on the order to 2%; Ivezić et al. 2004) and imperfect fringe removal and flat fielding in the zBoötes imaging. Furthermore, we find that objects observed in overlapping Boötes fields have an rms scatter of 5% in the final photometry. The astrometry between the NDWFS and zBoötes are slightly offset (). When matching objects in each zBoötes field to the NDWFS catalogs, we remove the local mean astrometric offsets in both right ascension and declination from zBoötes positions, resulting in astrometry that agrees to 02 rms. As the exposure times and observing conditions were variable throughout the survey field, the limiting depth of the catalog depends on location in the survey area. The typical depth is 22.5 mag for point sources in a 5 arcsecond diameter aperture. Full details of the data reduction and a full release of the -band imaging catalogs will be presented in a future data-release paper (Cool, in prep).
2.3. FLAMEX
The FLAMINGOS Extragalactic Survey (FLAMEX) (Elston et al. 2005) provided some of the and photometry used in this work. The Florida Multi-object Imaging Near-IR Grism Observational Spectrometer (FLAMINGOS) on the Kitt Peak 2.1m telescope was used to image 4.7 of the NDWFS Boötes field to a limiting depth of detecting approximately 150,000 sources (). The FLAMEX catalogs are publicly available333http://flamingos.astro.ufl.edu/extragalactic/overview.html.
2.4. IRAC Shallow Survey
The IRAC Shallow Survey (Eisenhardt et al. 2004) observed 8.5 of the sky in the NDWFS Boötes region at 3.6, 4.5, 5.8, and 8.0 with the IRAC instrument (Fazio et al. 2004) on Spitzer. This survey found 270,000, 200,000, 27,000, and 26,000 sources brighter than limits of 12.3, 15.4, 76, and 76 Jy (corresponding to limits of 21.2, 20.9, 19.2, and 19.2 AB mag) in each of the four IRAC bands (Eisenhardt et al. 2004; Stern et al. 2005).
2.5. MIPS Imaging
The NDWFS Boötes field was also observed at 24, 70, and 160 with the Multiband Imaging Photometer for Spitzer (Rieke et al. 2004) as part of the Spitzer IRS team’s Guaranteed Time Observing programs (Houck et al. 2005); only the 24 photometry is considered here. The 24 imaging covers 8.22 of the NDWFS Boötes field and reaches a 80% completeness limit of 0.3 mJy (Brown et al. 2006).
| Object Name | Redshift | ||||||
|---|---|---|---|---|---|---|---|
| NDWFS J142937.9+330416 | 5.39 | ||||||
| NDWFS J142729.7+352209 | 5.53 | ||||||
| NDWFS J142516.3+325409 | 5.85 |
| Object Name | Redshift | |||||
|---|---|---|---|---|---|---|
| NDWFS J142937.9+330416 | 5.39 | |||||
| NDWFS J142729.7+352209 | 5.53 | |||||
| NDWFS J142516.3+325409 | 5.85 |
3. Spectroscopic Observations
3.1. AGN and Galaxy Evolution Survey
The AGN and Galaxy Evolution Survey (AGES, Kochanek et al., in prep) has obtained complete spectroscopic samples of galaxies and quasars using several multi-wavelength selection techniques in the NDWFS Boötes field. Spectra of 20,000 objects were taken with Hectospec, a 300 fiber robotic spectrograph on the MMT 6.5m telescope (Fabricant et al. 1998, 2005; Roll et al. 1998). Data reduction was completed using HSRED, a modified version of the SDSS spectroscopic pipeline. Dome flat spectra were used to correct for the high-frequency flat-field variations and fringing in the CCD, and, when available, twilight sky spectra provided a low-frequency flat-field correction for each fiber. Each Hectospec configuration has approximately 30 fibers dedicated to measuring the sky spectrum which is subtracted from each object spectrum. Simultaneous observations of F-type stars in each configuration are cross correlated against a grid of Kurucz models (Kurucz 1993) to derive a sensitivity function for each observation, thus linking the observed counts to absolute flux units. The final reduced spectra cover the 3700Å to 9200Å spectral range at resolution .
AGES quasar target selection occurred in two stages. In the first phase of the project, AGES obtained redshifts of nearly all point sources with mag that were either X-ray sources with 4 or more counts in the the XBoötes survey (Murray et al. 2005) or were MIPS 24 sources brighter than 1mJy with non-stellar 24 to -band colors. This led to a sample of roughly 900 spectroscopically identified AGNs as well as redshifts of nearly 9000 galaxies selected using a variety of other techniques. By combining the AGES galaxy and AGN redshift samples, Stern et al. (2005) confirmed the ease with which quasars could be recognized using mid-infrared colors. In the second phase of AGES spectroscopy, we extended the optical flux limit to and added IRAC color selection to our methods of identifying quasars. In detail, mid-infrared selected objects considered here were required to have and either or a detection at 5.8 or 8.0 and be classified as point-sources in the NDWFS imaging. In AGES, targets were classified as point sources if their SExtractor CLASS_STAR parameter was larger than 0.8 for at least one of the , , or -bands. The AGES mid-infrared selection cut used for point sources dispenses with the color restriction given in Stern et al. (2005) which is intended to minimize the contribution of galaxies which are not common to our optical flux limits. While we only consider the sample of point-sources selected in the mid-infrared from AGES in this paper, it is worth noting that when selecting AGN from extended source in AGES, the vertical selection cuts from Stern et al. (2005) are imposed to reduce contamination of star-forming galaxies on the AGN sample. The shift from an -band to an -band spectroscopic limit led to a significant increase in the number of quasars in the AGES database, including three objects. The second phase of AGES target selection also included a 24 -selected quasar sample. These objects were required to be point sources, have , and have -band 30 diameter aperture magnitudes, , such that . This -band selection criterion rejects normal stars from the sample but retains AGNs. Two of the three quasars selected based upon their IRAC colors were also selected based upon their 24 photometry.
3.2. Auxiliary Observations
In order to augment the AGES discovery spectra, spectroscopic observations of two of the high-redshift objects discovered in this work were completed with the Multi-Aperture Red Spectrograph (MARS) on the 4-m telescope on Kitt Peak and the DEIMOS spectrograph (Faber et al. 2003) on the Keck-II telescope under poor observing conditions. These data were reduced using standard techniques. Also, to achieve higher quality data, two of the objects described in this paper were observed multiple times within AGES itself. Coaddition of all of the available spectra for each object was performed to improve the final signal-to-noise ratio of the data.

4. Results
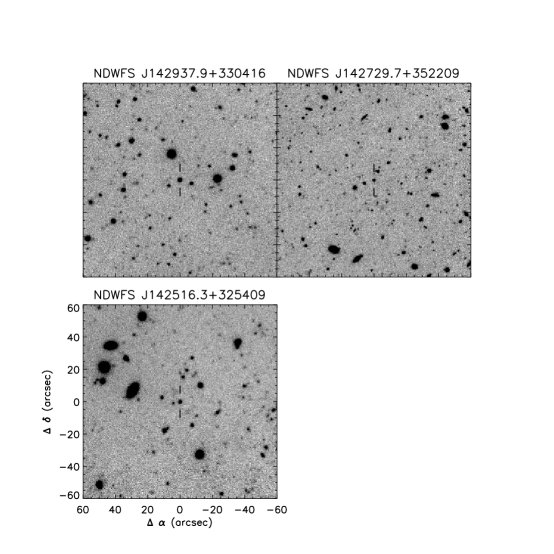
We have identified three new high-redshift () quasars observed as part of the AGES spectroscopic sample. Figures 1 and 2 show the -band finding chart and spectra for each of the three high-redshift objects. Tables 1 and 2 list the observed photometry and redshifts of the three new high-redshift quasars and Table 3 shows the derived rest-frame -band luminosity and the luminosity of each object at 1450 Å. In calculating the rest-frame luminosities, we assume a power-law SED of the form where . The spectra shown in Figure 2 are the coadded spectra from all the observations of each object: NDWFS J142516.3+325409 was observed three times in AGES as well as with MARS and DEIMOS, NDWFS J142937.9+330416 was observed once in AGES and with MARS, and NDWFS J142729.7+352209 was observed twice within AGES. Each of the discovered objects show the clear signature of a broad asymmetric Ly emission line. As the signal-to-noise ratios of the final spectra are only modest, redshifts for each object were determined based upon the break in the Ly line profile rather than on weak emission lines which are poorly detected. Quoted redshifts thus have errors of order
The quasars included in this paper were not selected with standard dropout techniques which identify objects with very red optical colors indicative of a strong spectral break. These techniques have been successful in identifying quasars at redshifts above 5 (e.g. Fan et al. 2000, 2001c, 2003, 2004, 2005; Stern et al. 2000; Djorgovski et al. 2003; Mahabal et al. 2005), but have several weaknesses. At , quasars cross the stellar locus in optical color-color space making optical selection problematic. The inclusion of near-infrared photometry can break this degeneracy to some extent, but obtaining this data can be time consuming.
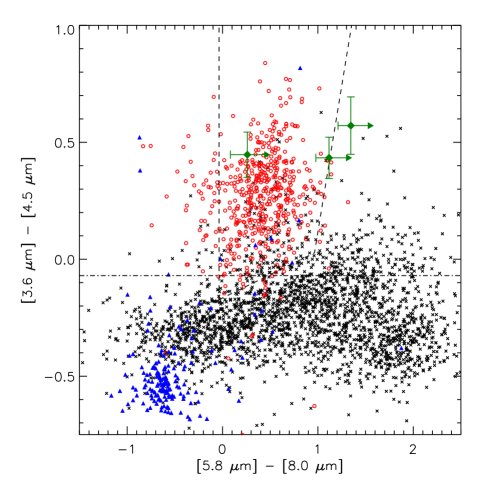
The high-redshift quasars studied here were all selected on the basis of their mid-infrared colors using a scheme similar to that presented in Stern et al. (2005). In brief, quasars, with their roughly power-law spectra, have redder mid-infrared colors than galaxies. The IRAC color-color space for AGES objects shown in Figure 3 illustrates the separation of the high-redshift objects discovered here from stars and low-redshift galaxies. We also indicate the criteria used for AGN selection given by Stern et al. (2005) (dashed line) and the AGES point-source mid-infrared selection criterion (dot-dashed line). Extended sources are targeted as AGN in AGES if they meet the full Stern et al. (2005) criteria. Low-redshift () objects, which are predominately extended galaxies, are shown with x-marks while objects with are marked with circles and are dominated by unresolved AGN. At , the locus of low-redshift galaxies clearly crosses the AGES point-source mid-infrared selection criterion but remains outside the Stern et al. (2005) selection region, illustrating the need for the separate point-source and extended-source selection criteria used by AGES. The three high-redshift quasars studied here (diamonds with error-bars) are well-separated from low-redshift galaxies throughout this color-color space.
One obvious question arises due to our mid-infrared selection of high-redshift quasars: does the population of mid-infrared selected quasars differ from quasars selected using more traditional optical techniques? The spectra in Figure 2, though of only modest signal-to-noise ratio, show no obvious differences from objects presented in the literature and would suggest no strong difference between high-redshift quasars selected based upon their optical or mid-infrared colors. Figure 4 shows the versus color-color space for point sources observed in AGES as well as the color track of high-redshift quasars predicted using the Vanden Berk et al. (2001) SDSS quasar composite modified by the addition of absorption blueward of Ly using the prescription of Songaila & Cowie (2002). The three quasars discovered here reside in the region traditionally used to select quasars with (e.g. Richards et al. 2002) further indicating that the quasars selected in this study are similar to those selected in the past. Both NDWFS J142516.3+325409 and NDWFS J142937.9+330416 lie quite close to the stellar locus in these colors, however, illustrating one of the main difficulties of traditional optical color selection techniques.
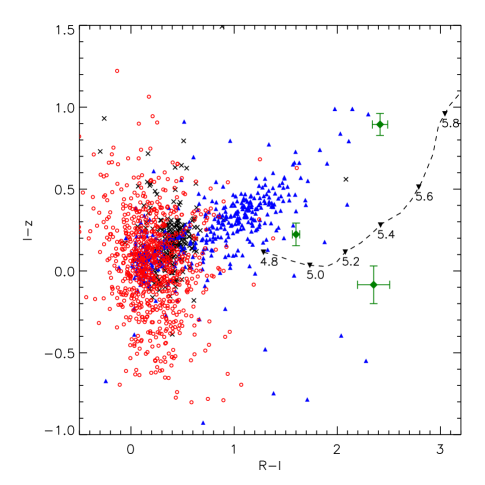
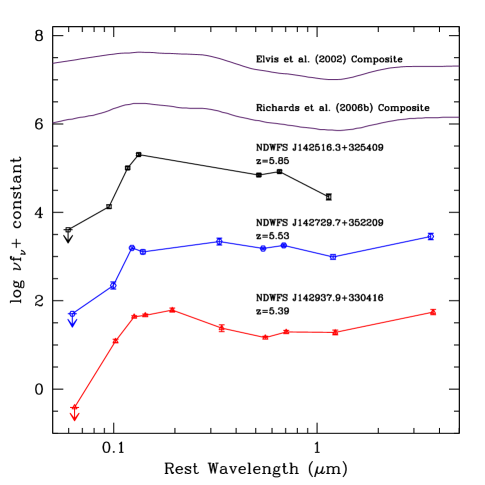
Figure 5 shows the spectral energy distribution from the observed -band to 24 (approximately rest-frame 600 Å - 3.7 ) for each of the high-redshift quasars identified in this work. Again, all three of these objects were selected based upon their mid-infrared colors; the two lowest-redshift quasars were also selected based on their 24 fluxes. For comparison, we have also plotted the average quasar SEDs from two studies in the literature; the top line shows the Elvis, Risaliti, & Zamorani (2002) radio-quiet quasar composite while the lower line shows the average SED of Spitzer-observed SDSS quasars from Richards et al. (2006b). The broad photometric properties of the high-redshift quasars are quite similar to each other as well as to the low-redshift composite spectra. The main difference between the low- and high-redshift objects is the lack of absorption due to neutral hydrogen at the highest frequencies in the composite spectra. The highest redshift object, NDWFS J142516.3+325409, shows a strong break between observed 4.5 and 8.0 , but this is likely due to poor signal-to-noise ratio in the 8.0 photometry as this object is near the flux limit of the 8.0 imaging. The rest-frame UV to optical color of NDWFS J142729.7+352209 is redder than the other two quasars studied here as well as both of the comparison composites, possibly indicating enhanced dust extinction in this object. Compared to a sample of 58 quasars at from AGES, the rest-frame UV to optical color of NDWFS J142729.7+352209 is not unique; it falls well within the distribution of colors of lower-redshift objects.
| Object Name | Redshift | ||
|---|---|---|---|
| NDWFS J142937.9+330416 | 5.39 | -26.00 | -25.52 |
| NDWFS J142729.7+352209 | 5.53 | -25.15 | -24.67 |
| NDWFS J142516.3+325409 | 5.85 | -26.52 | -26.03 |
Figure 6 shows the optical versus mid-infrared color-color space for AGES point sources. In this color space, all three of the discovered quasars are separated from the locus of low-redshift galaxies, Galactic stars, and quasars. We show one possible selection method for high-redshift quasars by the dot-dashed line in Figure 6. Within this region, the AGES source catalog contains 19 point sources with mag; 14 of these were spectroscopically observed. Of these 14 targets, 9 objects are stars, 2 are lower-redshift () quasars, and 3 have . Assuming the 4 objects without redshifts are not located at high redshift, this selection results in a minimum efficiency of %, though with only 3 quasars, this efficiency measurement is rather uncertain. The large contamination from stars arises due to increasing photometric errors in the colors as the stars approach the IRAC flux limit and thus much of the contamination could be mitigated with a deeper IRAC imaging survey.
5. Discussion
The quasars reported here add three new low-luminosity, high-redshift quasars to the slowly growing catalog of these objects. All three of these objects are fainter than quasars at similar redshifts found in the SDSS, and NDWFS J142516.3+325409 is the lowest luminosity quasar currently known. The number of these objects should grow quickly as the next generation of deep wide-area surveys are completed, opening the door to understanding the nature of low-luminosity quasars near the epoch of reionization.
As the number of low-luminosity quasars is still small, the details of the luminosity function of these objects is poorly constrained. Extrapolating the Fan et al. (2001b) quasar luminosity function (QLF), determined using quasars with , to higher redshifts and lower luminosities, we would expect a density of 0.28 deg-2 to the optical flux limit of the AGES spectroscopy or 2.2 quasars with in the AGES survey area for a complete, optically limited, survey.
In order to estimate the effect of the IRAC flux limits on the expected number of quasars in our survey, we create a sample of 58 quasars at from the full AGES catalog with existing FLAMEX photometry. These objects include quasars selected using the full suite of AGES selection techniques including X-ray, radio, or 24 fluxes or their optical or mid-infrared colors and thus likely exhibit a broad range of broad-band photometric properties. We augment this sample with 17 quasars in the same redshift range listed in the SDSS Third Quasar catalog (Schneider et al. 2005) which were also detected in 2MASS. For each object in this sample, we convert the observed (or for SDSS quasars) to a rest-frame ultraviolet-to-optical spectral slope, , by assuming the measured broad-band colors are the result of a pure power-law SED with . Next, we create a mock catalog of high-redshift quasars using the Fan et al. (2001b) QLF to assign each mock object a redshift and UV luminosity at 1450 Å. The observed distribution of UV-to-optical spectral slopes defines the distribution of -corrections that are applied to the mock catalog to convert the rest-frame luminosity at 1450Å to the observed flux at 3.6 for each object. We then use the observed distribution of mid-infrared spectral indices, , measured by Stern et al. (2005), to assign each mock quasar a flux at 4.5, 5.8, and 8.0 . Finally, we apply the AGES mid-infrared flux limits and selection criteria to measure the fraction of high-redshift objects which are missed by the AGES mid-infrared selection criteria. We find that approximately 35% of the mock quasars that pass the mag optical flux limits are missed when the IRAC flux limits are included. It may be a concern that the addition of the SDSS quasars, which, unlike the AGES sample, were all selected based on their optical colors, may bias this estimate; we have verified that omitting these objects from the calculation does not affect the final completeness more than a few percent. It should be noted that the above calculation assumes quasars at have the same broad-band photometric properties as objects; this assumption can only be tested after a large sample of high-redshift quasars with multi-wavelength photometry is collected. In the AGES sample of 2153 mid-infrared selected objects, 83% of the targets obtained valid redshifts. Combining this 83% spectroscopic completeness with the effects of the mid-infrared flux limits, we estimate that our overall completeness is 54% and thus we would expect to find only 1.2 quasars at for a QLF with a slope of . To then find three quasars is somewhat unlikely, since the Poisson probability of finding 3 or more objects when 1.2 are expected is only 12%.
Based on a sample of 12 quasars at , Fan et al. (2004) found that the high-redshift QLF was best fit by a steeper QLF () than that measured by Fan et al. (2001b). If we instead use the best fit bright-end slope and normalization from Fan et al. (2004) but keep the redshift evolution of the quasar number density determined by Fan et al. (2001b), we would expect to find 6.2 quasars at in a complete optically-limited survey of the AGES area. This value drops to 3.5 when the effects of our mid-infrared flux limits and spectroscopic incompleteness are added. This value agrees quite well with the 3 objects found in our survey, but, at this point, this agreement is only suggestive due to the small number of quasars in our sample and the small sample size and luminosity range used by Fan et al. (2004) to determine this QLF slope. Richards et al. (2006) found the QLF slope to evolve from (where ) at to progressively flatter slopes at higher redshift such that at , one would predict . If the QLF at is, indeed, as steep at , the trend measured by Richards et al. (2006) must break down beyond , but a larger sample of low-luminosity objects is required to place any robust constraints on the evolution of the QLF to .
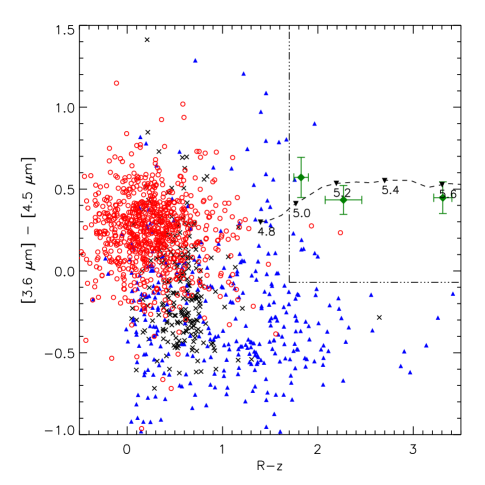
We have shown that mid-infrared selection of quasars can be useful in the search for high-redshift objects to , thus avoiding some of the key problems inherent in optically based high-redshift quasar searches. At , optical selection of quasars is impossible as the Ly emission from objects at these redshifts is shifted out of the -band. In the near-infrared, the existing large area surveys (primarily 2MASS) are too shallow to detect even the brightest high-redshift quasars found by the SDSS. In the near future, the UKIDSS survey will image 4000 deg2 of the sky to 3 mag deeper than 2MASS and should find about 10 quasars with (Warren & Hewett 2002). While near-infrared spectroscopy is ultimately the only means by which one can ensure any candidate is located at high redshift, the use of mid-infrared colors in the selection of these objects may provide a valuable tool in separating stars from quasars at the highest redshifts. Figure 7 illustrates the expected color of quasars to based upon the locally determined SDSS quasar composite spectrum (Vanden Berk et al. 2001). We also show the colors predicted from a power-law () continuum with Balmer emission lines having the same strength and width of those measured on the SDSS composite spectrum.

As the strong emission from the H emission line redshifts into the 4.5 band, the colors of quasars redden quickly near . Correspondingly, the sudden drop in color at occurs as the strong H emission line redshifts out of the 4.5 band; by , the colors of high-redshift quasars redden as H redshifts from the 3.6 band into the 4.5 IRAC bandpass. The overall trend toward bluer colors exhibited by the SDSS composite across this redshift range occurs as the IRAC passbands probe the transition between a spectral slope of measured blueward of 5000Å and of redward of this wavelength in the SDSS composite spectrum. This transition likely occurs due to contamination of the AGN light by the host-galaxy in the low-redshift AGNs used to construct the composite spectrum. This contamination makes the colors predicted using the Vanden Berk et al. (2001) composite generally redder than those expected using the simple model consisting only of a power-law continuum and Balmer emission lines. For both tracks, the mid-infrared colors of very high-redshift quasars remain redder than stars () and low-redshift galaxies throughout the redshift range shown. As the large number of deep, wide-area, Spitzer fields with corresponding deep optical and near-infrared photometry become available, the ability to build large samples of high-redshift quasars, including low-luminosity objects, will allow us, for the first time, to probe the statistics of low-luminosity quasars at high redshift.
References
- Abazajian et al. (2003) Abazajian, K., et al. 2003, AJ, 126, 2081
- Abazajian et al. (2004a) Abazajian, K., et al. 2004, AJ, 128, 502
- Abazajian et al. (2005) Abazajian, K., et al. 2005, AJ, 129, 1755
- Adelman-McCarthy et al. (2005) Adelman-McCarthy, J. K. 2005, submitted, arXiv:astro-ph/0507711
- Barger et al. (2002) Barger, A. J., Cowie, L. L., Brandt, W. N., Capak, P., Garmire, G. P., Hornschemeier, A. E., Steffen, A. T., & Wehner, E. H. 2002, AJ, 124, 1839
- Barger et al. (2003) Barger, A. J., Cowie, L. L., Capak, P., Alexander, D. M., Bauer, F. E., Brandt, W. N., Garmire, G. P., & Hornschemeier, A. E. 2003, ApJ, 584, L61
- Barger et al. (2005) Barger, A. J., Cowie, L. L., Mushotzky, R. F., Yang, Y., Wang, W.-H., Steffen, A. T., & Capak, P. 2005, AJ, 129, 578
- Bertin & Arnouts (1996) Bertin, E., & Arnouts, S. 1996, A&AS, 117, 393
- Boyle et al. (2000) Boyle, B. J., Shanks, T., Croom, S. M., Smith, R. J., Miller, L., Loaring, N., & Heymans, C. 2000, MNRAS, 317, 1014
- Brown et al. (2006) Brown, M. J. I., et al. 2006, in press, arXiv:astro-ph/0510504
- Chiu et al. (2005) Chiu, K., et al. 2005, AJ, 130, 13
- Cristiani et al. (2004) Cristiani, S., et al. 2004, ApJ, 600, L119
- Croom et al. (2004) Croom, S. M., Smith, R. J., Boyle, B. J., Shanks, T., Miller, L., Outram, P. J., & Loaring, N. S. 2004, MNRAS, 349, 1397
- Djorgovski et al. (2003) Djorgovski, S. G., Stern, D., Mahabal, A. A., & Brunner, R. 2003, ApJ, 596, 67
- Eisenhardt et al. (2004) Eisenhardt, P. R., et al. 2004, ApJS, 154, 48
- Elston et al. (2005) Elston, R. J., et al. 2005, in press, arXiv:astro-ph/0511249
- Elvis, Risaliti, & Zamorani (2002) Elvis, M., Risaliti, G., & Zamorani, G. 2002, ApJ, 565, L75
- Faber et al. (2003) Faber, S. M., et al. 2003, Proc. SPIE, 4841, 1657
- Fabricant et al. (1998) Fabricant, D. G., Hertz, E. N., Szentgyorgyi, A. H., Fata, R. G., Roll, J. B., & Zajac, J. M. 1998, Proc. SPIE, 3355, 285
- Fabricant et al. (2005) Fabricant, D., et al. 2005, PASP, 117, 1411
- Fan et al. (2000) Fan, X., et al. 2000, AJ, 120, 1167
- Fan et al. (2001a) Fan, X., et al. 2001a, AJ, 121, 31
- Fan et al. (2001b) Fan, X., et al. 2001b, AJ, 121, 54
- Fan et al. (2001c) Fan, X., et al. 2001c, AJ, 122, 2833
- Fan et al. (2003) Fan, X., et al. 2003, AJ, 125, 1649
- Fan et al. (2004) Fan, X., et al. 2004, AJ, 128, 515
- Fan et al. (2005) Fan, X., et al. 2005, in press, arXiv:astro-ph/0512080
- Fazio et al. (2004) Fazio, G. G., et al. 2004, ApJS, 154, 10
- Houck et al. (2005) Houck, J. R., et al. 2005, ApJ, 622, L105
- Ivezić et al. (2004) Ivezić, Ž., et al. 2004, Astronomische Nachrichten, 325, 583
- Jannuzi & Dey (1999) Jannuzi, B. T., & Dey, A. 1999, ASP Conf. Ser. 191: Photometric Redshifts and the Detection of High Redshift Galaxies, 191, 111
- Jiang et al. (2006) Jiang, L., et al. 2006, ArXiv Astrophysics e-prints, arXiv:astro-ph/0602569
- Kron (1980) Kron, R. G. 1980, ApJS, 43, 305
- Kurucz (1993) Kurucz, R. 1993, ATLAS9 Stellar Atmosphere Programs and 2 km/s grid. Kurucz CD-ROM No. 13. Cambridge, Mass.: Smithsonian Astrophysical Observatory, 1993, 13,
- Mahabal et al. (2005) Mahabal, A., Stern, D., Bogosavljević, M., Djorgovski, S. G., & Thompson, D. 2005, ApJ, 634, L9
- Murray et al. (2005) Murray, S. S., et al. 2005, ApJS, 161, 1
- Oke (1974) Oke, J. B. 1974, ApJS, 27, 21
- Richards et al. (2002) Richards, G. T., et al. 2002, AJ, 123, 2945
- Richards et al. (2005) Richards, G. T., et al. 2005, MNRAS, 360, 839
- Richards et al. (2006) Richards, G. T., et al. 2006, ArXiv Astrophysics e-prints, arXiv:astro-ph/0601434
- Richards et al. (2006b) Richards, G. T., et al. 2006b, ArXiv Astrophysics e-prints, arXiv:astro-ph/0601558
- Rieke et al. (2004) Rieke, G. H., et al. 2004, ApJS, 154, 25
- Roll et al. (1998) Roll, J. B., Fabricant, D. G., & McLeod, B. A. 1998, Proc. SPIE, 3355, 324
- Schlegel, Finkbeiner, & Davis (1998) Schlegel, D. J., Finkbeiner, D. P., & Davis, M. 1998, ApJ, 500, 525
- Schmidt & Green (1983) Schmidt, M., & Green, R. F. 1983, ApJ, 269, 352
- Schneider et al. (2005) Schneider, D. P., et al. 2005, AJ, 130, 367
- Sharp et al. (2004) Sharp, R. G., Crampton, D., Hook, I. M., & McMahon, R. G. 2004, MNRAS, 350, 449
- Songaila & Cowie (2002) Songaila, A., & Cowie, L. L. 2002, AJ, 123, 2183
- Stern et al. (2000) Stern, D., Spinrad, H., Eisenhardt, P., Bunker, A. J., Dawson, S., Stanford, S. A., & Elston, R. 2000, ApJ, 533, L75
- Stern et al. (2005) Stern, D., et al. 2005, ApJ, 631, 163
- Stoughton et al. (2002b) Stoughton, C., et al. 2002, Proc. SPIE, 4836, 339
- Vanden Berk et al. (2001) Vanden Berk, D. E., et al. 2001, AJ, 122, 549
- Warren & Hewett (2002) Warren, S., & Hewett, P. 2002, ASP Conf. Ser. 283: A New Era in Cosmology, 283, 369
- Williams et al. (2004) Williams, G. G., Olszewski, E., Lesser, M. P., & Burge, J. H. 2004, Proc. SPIE, 5492, 787
- Willott et al. (2005) Willott, C. J., Delfosse, X., Forveille, T., Delorme, P., & Gwyn, S. D. J. 2005, ApJ, 633, 630
- Wolf et al. (2003) Wolf, C., Wisotzki, L., Borch, A., Dye, S., Kleinheinrich, M., & Meisenheimer, K. 2003, A&A, 408, 499
- York et al. (2000) York, D. G., et al. 2000, AJ, 120, 1579
- Zheng et al. (2000) Zheng, W., et al. 2000, AJ, 120, 1607