GRB 060313: A New Paradigm for Short-Hard Bursts?
Abstract
We report the simultaneous observations of the prompt emission in the -ray and hard X-ray bands by the Swift-BAT and the KONUS-Wind instruments of the short-hard burst, GRB 060313. The observations reveal multiple peaks in both the -ray and hard X-ray bands suggesting a highly variable outflow from the central explosion. We also describe the early-time observations of the X-ray and UV/Optical afterglows by the Swift XRT and UVOT instruments. The combination of the X-ray and UV/Optical observations provide the most comprehensive lightcurves to date of a short-hard burst at such an early epoch. The afterglows exhibit complex structure with different decay indices and flaring. This behavior can be explained by the combination of a structured jet, radiative loss of energy, and decreasing microphysics parameters occurring in a circum-burst medium with densities varying by a factor of approximately two on a length scale of . These density variations are normally associated with the environment of a massive star and inhomogeneities in its windy medium. However, the mean density of the observed medium () is much less than that expected for a massive star. Although the collapse of a massive star as the origin of GRB 060313 is unlikely, the merger of a compact binary also poses problems for explaining the behavior of this burst. Two possible suggestions for explaining this scenario are: some short bursts may arise from a mechanism that does not invoke the conventional compact binary model, or soft late-time central engine activity is producing UV/optical but no X-ray flaring.
1 Introduction
Gamma-ray bursts (GRBs) are generally classified into one of two categories: long-soft and short-hard (Kouveliotou et al., 1993)111Two additional classes of bursts have been proposed: an intermediate class (Horváth, 1998; Mukherjee et al., 1998; Horváth et al., 2006) which falls between the short and long burst classes with respect to and has a hardness ratio softer than long bursts, and a very short class (Cline et al., 2005) which has a very hard spectrum and .. Short GRBs are bursts with (where is the time in which the cumulative counts above background are between 5% and 95% of the total) and a hardness ratio that is typically larger than the one of long GRBs. Short bursts also exhibit an initial spike with insignificant spectral evolution at energies greater than (Norris & Bonnell, 2006). 25-30% of all GRBs in the Burst and Transient Source Experiment (BATSE) catalog (Fishman et al., 1994) are short-hard bursts (SHBs; Kouveliotou et al., 1993), while 124% of the Swift (Gehrels et al., 2004) sample are SHBs. It has been proposed that SHBs are the result of a compact binary merger such as a double neutron star (DNS; Paczyński, 1986; Eichler et al., 1989; Narayan, Paczyński, & Piran, 1992; Fryer, Woosley, & Hartmann, 1999; Rosswog, Ramirez-Ruiz, & Davies, 2003; Lee, Ramirez-Ruiz, & Granot, 2005; Panaitescu, 2006a) or a neutron star and a black hole (NS-BH; Lattimer & Schramm, 1976; Paczyński, 1991; Narayan, Paczyński, & Piran, 1992; Mochkovitch et al., 1993; Fryer, Woosley, & Hartmann, 1999; Lee, Ramirez-Ruiz, & Granot, 2005; Panaitescu, 2006a). Since the natal kick of a neutron star is , and since the typical life time of compact binaries is (Panaitescu, 2006a), a compact binary could wander anywhere from to in the time it takes for the binary to merge. At these large distances from the neutron star’s stellar nursery, a lower density external medium is expected.
Understanding and testing these different short GRB models has been difficult due to the large time delay in localizing the burst afterglows. The Interplanetary Network (IPN; Hurley et al., 2005) has triangulated a few short GRBs on timescales of days (Bloom et al., 2006); however, on these timescales, the afterglow has long since faded. Since the launch of the Swift satellite, eleven SHBs222It has been noted in the literature that there have been other well localized short bursts which have soft spectra (Bloom et al., 2006). Recent work (Levan et al., 2006; Sakamoto et al., 2006) has suggested that Swift and HETE-2 short bursts have softer spectra than the BATSE bursts. They find that the hardness ratio is in-between that of the BATSE short and long GRBs, but the Swift short bursts are typically harder than the long ones. Hereafter, we assume the Swift and HETE-2 short bursts fit into the hard classification scheme and refer to short bursts as those bursts with short-hard spectra. have been localized in under an hour. Four of the eleven bursts, GRBs 050202 (Tueller et al., 2005), 050906 (Krimm et al., 2005), 050925 (Holland et al., 2005), and 051105A (Mineo et al., 2005), were localized in the hard X-ray band by the Swift Burst Alert Telescope (BAT; Barthelmy et al., 2005a) but with no corresponding X-ray, optical, or radio detections; three additional bursts, GRBs 050509B (Gehrels et al., 2005; Bloom et al., 2006), 050813 (Retter et al., 2005; Morris et al., 2005), and 051210 (La Parola et al., 2006), were localized by the BAT with corresponding Swift X-ray Telescope (XRT; Burrows et al., 2005a) detections but no optical or radio detections; the remaining four bursts, GRBs 050724 (Barthelmy et al., 2005b; Berger et al., 2005; Campana et al., 2006; Grupe et al., 2006; Vaughan et al., 2006), 051221A (Parsons et al., 2005; Burrows, Capalbi, & Grupe, 2005; Grupe, Burrows, & Patel, 2005; Roming et al., 2005a; Soderberg et al., 2006; Burrows et al., 2006), 051227 (Barbier et al., 2006), and 060313 (Pagani et al., 2006a), were localized by the BAT and XRT with corresponding Swift Ultra-Violet/Optical Telescope (UVOT; Roming et al., 2005b) and/or ground-based detections. Additional rapid observations of GRBs 050709 (Fox et al., 2005; Villasenor et al., 2005; Covino et al., 2006) and 060121 (Arimoto et al., 2006; Levan et al., 2006) were made with the High Energy Transient Explorer (HETE-2). These rapid observations have broadened our understanding of short GRBs and provided strong evidence that the origin of short bursts is different from that of long bursts and is consistent with the merger of compact objects (Gehrels et al., 2005; Barthelmy et al., 2005b; Fox et al., 2005; Villasenor et al., 2005).
However, the data for GRB 060313 indicates that there are problems with the model for a compact binary merger, at least for this burst. Two possible explanatons for the observed behavior are: some short bursts may be produced by a different mechanism than that invoked by the standard compact binary model, or late-time central engine activity is generating late internal shocks from which low energy (UV/optical) flares arise. Here we present the broad-band nature of the short GRB 060313 and its afterglow based on Swift BAT, XRT, and UVOT as well as KONUS-Wind (Aptekar et al., 1995) data. This is only the fifth short burst with a reported optical afterglow and the first with UV detections and optical flaring. It is also the hardest burst in the Swift sample. In addition, the optical and UV detections made by the UVOT of this burst are the earliest () optical/UV detections of a short burst to date. The combination of the UVOT data with the BAT, KONUS, and XRT data provide the most comprehensive lightcurves to date of a SHB at such an early epoch and affords a unique opportunity to probe the mechanism behind this short GRB.
2 Observations & Data Analysis
On March 13, 2006, at , the BAT triggered on GRB 060313 (Pagani et al., 2006a). The timing analysis hereafter is referenced from the BAT trigger time (). The initial BAT light curve has two slightly overlapping peaks with a total duration of . The peak count rate was approximately () occurring at s.
The UVOT began a finding chart exposure after the trigger. The afterglow was discovered during ground processing. The XRT began its autonomous sequence of observations of the GRB field at , after the BAT trigger. The XRT on-board centroiding algorithm could not converge on a source in the image, but a fading source was detected in the ground-processed data (Pagani et al., 2006b). The first ground based detection was made at with the VLT and FORS2 telescopes (Levan & Hjorth, 2006). No radio source was detected at the VLT position (Soderberg & Frail, 2006).
Hereafter, we adopt the notation for the afterglow flux as a function of time, where is the frequency of the observed flux, is the time post trigger, is the spectral index which is related to the photon index () , and is the temporal decay slope. We also adopt the convention in cgs units. A flat cosmological constant dominated cosmology with the parameter values , , and is assumed.
2.1 BAT Analysis
Ground analysis (Markwardt et al., 2006) of the BAT data determined that for the band is (estimated error includes the systematics) with a fluence of in the band. The 1 second peak photon flux measured from s in the band is . All BAT errors are at the 90% confidence level.
In the lightcurve (Figure 1) at least 20 statistically significant peaks with FWHMs in the range (Barthelmy et al., 2006) can be seen. There is no periodic structure in the lightcurve for at least the first . There is also no evidence of extended emission in the to range at an upper limit of (). This is consistent with an upper limit on the flux ratio between the initial peak and the peak of any potential extended emission of . SHBs 050724 and 051227 had flux ratios of 46 and , respectively (Barthelmy et al., 2006).
2.2 KONUS-Wind Analysis
KONUS-Wind (K-W) triggered on GRB 060313 at (Golenetskii et al., 2006). It was detected by the S1 detector which observes the south ecliptic hemisphere; the incident angle was . The propagation delay from Swift to Wind is for this GRB, therefore, correcting for this factor, one sees that the K-W trigger time corresponds to .
The GRB time history was recorded in three energy ranges: G1 (), G2 (), and G3 (). Thanks to the high intensity of the burst, the K-W reserve system (so called ’nonius’) was triggered providing resolution record in the G2 and G3 ranges of the entire burst (up to ). Five spectra in 101 channels were accumulated during the burst (the total number of spectra accumulated during the trigger record is 64). The light curve (Figure 1) shows several multi-peaked pulses with a total duration of approximately . As with the BAT multi-channel light curve, the three channel KONUS light curves (Figure 3) illustrate that the burst is a short hard burst.
2.3 XRT Analysis
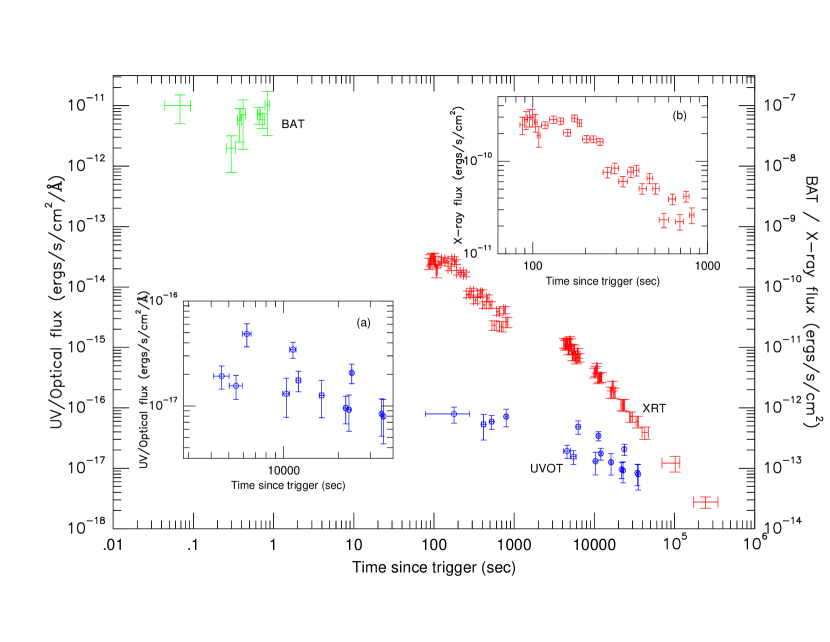
An uncatalogued, fading source was discovered during ground analysis (Pagani et al., 2006b) of the XRT data. The X-ray afterglow was observed in Windowed Timing (WT) mode for . As the source faded the XRT switched into Photon Counting (PC) mode, thus providing 2-dimensional spatial information (for a complete description of the XRT modes see Hill et al., 2004). To avoid pile-up in the PC data during the first orbit of observations, the XRT lightcurve was extracted in the energy range using an annulus centered on the afterglow position with an inner radius of 2 pixels and applying a PSF correction. The X-ray lightcurve (see Figure 4) during the first orbit of observation manifested variability, with spikes and fluctuations superimposed on the overall fading behavior. The initial decay slope was . The lightcurve profile becomes smoother in the later orbits ( after the BAT trigger) and the decay curve can be fitted by a power law with index of . In addition, the flux at these later times is larger by a factor compared with the extrapolation of the earlier X-ray lightcurve. The X-ray lightcurve is shown in Figure 4, with the count rate converted into unabsorbed flux using the best spectral model fit.
The X-ray spectrum from the Photon Counting data was extracted in the energy range, with a binning of at least 20 counts per energy bin, using the latest versions of the ancillary and response matrix files. The PC spectrum of the first orbit of observation was extracted excluding the central 2 pixels to avoid pile up. The spectrum can be fitted by a simple absorbed power law, yielding a photon index of and an absorption column density consistent with the Galactic value of (Dickey & Lockman, 1990). The spectrum softens during the later orbits: the best power law model fit of the afterglow spectrum extracted from 4.1 to after the GRB trigger yields a photon index of , fixing the at the Galactic value.
2.4 UVOT Analysis
The Swift spacecraft slewed promptly when the BAT detected GRB 060313, and UVOT began imaging the field shortly after the BAT trigger. The UVOT took 44 exposures of the field between 78 and after the BAT trigger. For the majority of these exposures the afterglow was too faint to be detected. The UVOT photometry that is used in this paper is presented in Table 1. The UVW2 detection (see below) implies that the Lyman limit must be blueward of , suggesting an upper limit on the redshift of . To further constrain the redshift, , a power-law UV/optical SED with an unconstrained spectral slope, , as well as a fixed Galactic E() was assumed. The redshift was then varied and the spectrum for a given was modified according to the parameterization of the average Lyman absorption (Madau, 1995). The magnitudes relative to each UVOT filter were then estimated for a grid of and , with a corresponding value for each - pair. The grid of values were plotted to illustrate how and could be constrained. The probability distributions were also projected onto each axis to obtain the confidence intervals. Neither parameter is very well constrained, but the best and at the 90% confidence level. The most likely redshift is , but it is minimally peaked.
| (s) | (s) | Filter | Mag | Error | Adjusted -band Mag |
|---|---|---|---|---|---|
| 178 | 200 | 19.56 | 0.32 | 19.06 | |
| 416 | 50 | 19.49 | 0.49 | 19.49 | |
| 524 | 50 | White | 19.07 | 0.28 | 19.38 |
| 795 | 50 | 19.17 | 0.35 | 19.17 | |
| 4568 | 886 | 20.85 | 0.27 | 20.60 | |
| 5476 | 900 | UVW2 | 20.20 | 0.28 | 20.83 |
| 6280 | 684 | 20.09 | 0.27 | 19.59 | |
| 10328 | 900 | UVM2 | 20.53 | 0.44 | 21.02 |
| 11235 | 900 | UVW1 | 19.66 | 0.19 | 19.97 |
| 12052 | 708 | 20.70 | 0.24 | 20.70 | |
| 16147 | 886 | 21.31 | 0.42 | 21.06 | |
| 21890 | 900 | UVM2 | 20.87 | 0.32 | 21.36 |
| 22797 | 900 | UVW1 | 21.09 | 0.41 | 21.40 |
| 23618 | 716 | 20.52 | 0.23 | 20.52 | |
| 34426 | 900 | UVW1 | 21.19 | 0.42 | 21.50 |
| 35217 | 658 | 21.56 | 0.49 | 21.56 |
| Filter | ZP | Error |
|---|---|---|
| 17.88 | 0.09 | |
| 19.16 | 0.12 | |
| 18.38 | 0.23 | |
| UVW1 | 17.69 | 0.02 |
| UVM2 | 17.29 | 0.23 |
| UVW2 | 17.77 | 0.02 |
| White | 19.78 | 0.02 |
The UVOT has filters which approximate the Johnson system and three ultraviolet filters: UVW1 with a central wavelength of , UVM2 with , and UVW2 with . Examination of the first settled observation (a exposure in ) revealed a new source relative to the Digital Sky Survey inside the XRT error circle. This source had a magnitude of . The UVOT position of the source is and (J2000), with an internal accuracy of and an absolute astrometric uncertainty of (90% containment). This position is from the reported XRT position (Pagani et al., 2006b). It is inside the XRT error circle and consistent with reported ground-based detections (Levan & Hjorth, 2006; Thöne et al., 2006). Subsequent exposures showed the source to be fading.
We performed photometry on each UVOT exposure using a circular aperture with a radius of 2″ centered on the position of the optical afterglow. This radius is approximately equal to the FWHM of the UVOT PSF. The PSF varies with filter and with spacecraft voltage, so we did not match the extraction aperture to the PSF for each exposure. The PSF FWHM, averaged over the voltage variations, ranges from for the filter to for the UVW2 filter. The background was measured in a sky annulus of inner radius and width 5″ centered on the afterglow.
Aperture corrections were computed for each exposure to convert the 2″ photometry to the standard aperture radii used to define UVOT’s photometric zero points (6″ for and 12″ for the UV filters). The aperture correction procedure also accommodates the variable PSF. Approximately six isolated stars were used to compute the aperture correction for each exposure. The RMS scatter in the mean aperture correction for a single exposure was typically mag. The RMS scatter for each exposure was added in quadrature to the statistical error in the 2″ magnitude to obtain the total error in each point. All detections above the significance level are tabulated in Table 1.
Since the UVOT is a photon-counting device, we have corrected all of our data for coincidence loss; however, the afterglow has , so coincidence losses are negligible, typically less than 0.01 mag. The zero points used to transform the instrumental UVOT magnitudes to Vega magnitudes are listed in Table 2. They are taken from the latest in-orbit measurements as obtained from the HEASARC Swift/UVOT Calibration Database (CalDB)333http://swift.gsfc.nasa.gov/docs/heasarc/caldb/swift/. Color terms were not applied to the photometric calibrations, but preliminary calibrations of on-orbit data suggest that they are negligible.
The UVOT photometry was adjusted to the -band by assuming that the optical spectrum was a power law with the same slope as the X-ray spectrum (). The resultant UVOT photometry is provided in Table 1, Adjusted -band Mag column, and is shown in Figure 4. In addition, the UVOT photometry was also adjusted to the -band assuming the cooling break is between the optical and X-ray bands at . The assumed spectral slope in the optical is . Although the scatter looks slightly less for the case, the RMS residual for both cases is 0.45 mag (see below).
As seen in Figure 4, there appears to be flaring in the UVOT lightcurve between . To determine the statistical significance of these potential flares, the shifted UVOT photometry was fitted with a single power law ( & mag for ; & mag for ). Based on this fit, the fluctuations appear real. If the fluctuations represent flares and a single power law is fit to the bottom of the photometry data (i.e. a line is placed through the lightcurve while ignoring the three flares), the flaring becomes even more significant ( & mag for ). A further check was made to determine if the fluctuations were caused by instrumental or other effects. Light curves for seven comparison stars (which were selected based on similar magnitudes to the afterglow’s) were constructed in each filter after shifting to the -band as described above. For each comparison star a weighted mean magnitude and the residual about the weighted mean was computed. The RMS residual of all the observations of all the stars is 0.09 mag, which is much smaller than the RMS residual about the power law fit to the afterglow’s light curve. We therefore conclude that the comparison stars do not show the same fluctuations as the optical afterglow and that the fluctuations are intrinsic to the afterglow. Although optical flaring has been reported for long bursts (cf. Holland et al., 2002; Jakobsson et al., 2004), this is the first short burst with optical flaring.
2.5 Spectral Analysis
Joint spectral analysis was carried out using the BAT data between 15 and and the KONUS data from 20 to . The spectra were fit by a power law model with an exponential cut off: where is the peak energy of the spectrum and is the photon index. A fit to the Band (GRBM) model was also attempted. No statistically significant high energy power-law tail was established in any fitted spectrum. The time-integrated spectrum is well fit with and (). Using these parameters, the calculated burst fluence is and the peak flux is , as measured from on a timescale. All errors are at the 90% confidence level. Joint fits were also made to the same cut-off power law model for three specific time intervals denoted on Figure 3. The results are summarized in Table 3. Significant spectral evolution in both the low-energy photon index and is evident.
| Prob | |||||
|---|---|---|---|---|---|
| (A) | 1.0 | 0.30 | |||
| 0.45 | |||||
| (B) | 1.0 | 0.20 | |||
| 0.18 | |||||
| (C) | 1.0 | 0.55 | |||
| 0.59 | |||||
| 1.0 | 0.68 | ||||
| 0.68 |
We also constructed a spectral energy distribution (SED) of the optical and UV afterglow for after the trigger. This time was chosen because the lightcurve is relatively well-sampled in the different UVOT bands around that point, requiring the minimum of interpolation in constructing the SED. For the , , and UVW1 bands respectively, a power-law was fitted to the data points between 4000 and and the count rates at were interpolated from the fitted curves. For the , UVM2, and UVW2 bands, for which there was only one point per filter in the time range, an average power-law decay fitted jointly to , , and UVW1 was renormalized to the single points in each of , UVM2, and UVW2. The count rates at in these filters were then determined from these extrapolated curves. The count rates from all six filters were used to make spectral files for fitting with XSPEC using the latest UVOT response matrices (version 102). The errors on the count rates consisted of a sum in quadrature of the photometric error and a 10% systematic error from the calibration uncertainty on the filter effective areas.
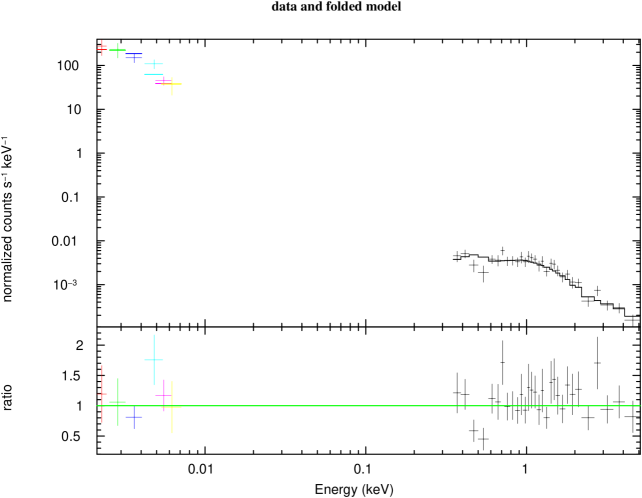
An XRT spectrum for the time interval was extracted for joint fitting with the UVOT, and renormalized to the total count rate expected at 14 ks. Fitted by itself, the XRT spectrum was slightly softer than that obtained from the whole time interval, with a (Galactic absorbed) power-law slope of . The XRT and UVOT spectra were then fitted simultaneously, with a model consisting of power-law absorbed by Galactic gas and dust as well as dust intrinsic to the GRB host.
A good fit was obtained with the power-law with Galactic dust and gas alone; no dust intrinsic to the source was required. Since we cannot fit the redshift of any dust feature we are unable to use the SED fitting to constrain the redshift of the GRB in this case. The full parameters of the joint UVOT-XRT fit are given in Table 4, and the UVOT and XRT spectra are plotted with the model and the ratio of data to the model in Figure 5.
| Component | Parameter Values |
|---|---|
| Power-law () | |
| Normalization | (@ 1 keV) |
| Neutral Galactic gas absorption () | (fixed) |
| Dust type | Milky Way |
| E(B-V) | 0.0625 mag (fixed) |
| z | 0 (fixed) |
| 1.142 (34 dof) |
3 Discussion
3.1 Prompt Gamma-Ray Emission
Although GRB 060313 is the hardest of the Swift bursts (based on the (50-100 keV)/(25-50 keV) ratio), it is just above the average hardness for BATSE short bursts (see Figure 6). Since the BAT lightcurve of GRB 060313 is bright and therefore the statistical significance is high, we can be confident that many of the multi-peaked pulses in the lightcurve are real. Most BATSE short bursts, even when as bright as GRB 060313, did not reveal as much structure as is evident in this burst. The burst fluence as measured in the band was , providing an isotropic gamma-ray energy release of for an assumed burst of redshift 1.
The spectrum during the burst had a positive spectral index during the first of the burst () and the time averaged low energy spectrum was . These spectra can be produced in the synchrotron-self-Compton model for gamma-ray generation (Kumar et al., 2006). The high degree of variability of the gamma-ray lightcurve is probably due to a highly variable outflow from the central explosion.
3.2 Afterglow
The X-ray lightcurve has a profile similar to the canonical profile described in the literature (Zhang et al., 2006) with the exception that segment I (the time immediately after the prompt emission) has a much shallower decay slope ( less than the canonical). This XRT decay slope of beginning after the burst trigger is much less than the early decay slopes seen at similar times for some short bursts: GRBs 050724 (; Barthelmy et al., 2005b), 050813 (; Racusin, 2006), 051210 (; La Parola et al., 2006), and 051227 (; Barbier et al., 2006). The decay slope is more consistent with the short bursts: GRBs 050509B (; Gehrels et al., 2005), 050709 (; Fox et al., 2005), and 051221A (; Capalbi et al., 2005).
The initial XRT lightcurve has flaring in the first after the trigger. The spectrum during this period is harder (photon index of ) than the best spectral fit of the late afterglow (photon index of ). Flares in the early lightcurve of the short GRBs 050724 (Barthelmy et al., 2005b; Campana et al., 2006; Grupe et al., 2006), 051210 (La Parola et al., 2006), and 060121 (Levan et al., 2006) have also been seen. Flaring in GRBs has been attributed to long lasting activity by the central engine with internal shocks continuing for hundreds of seconds (Burrows et al., 2005b; Falcone et al., 2006a, b; Pagani et al., 2006c; Zhang et al., 2006; De Pasquale et al., 2006). Although the decay slope of GRB 060313 is consistent with GRBs 050509B, 050709, and 051221A, no early flaring was seen in these three bursts (Fox et al. (2005) report the possibility of a flare at early times for GRB 050709, however, the fitting of the lightcurve at early times was difficult since only one data point was available in the first day after the burst). Between no data was obtained due to occultation by the Earth; therefore, it is unknown what the lightcurve profile is at this time. However, this region in the lightcurve is consistent with either segment II or V in Zhang et al. (2006), therefore, there is clear evidence that there is some kind of energy injection
The optical and UV lightcurve is the earliest () optical/UV detection of a short GRB to date. The early UVOT decay slope, beginning after the burst trigger, is which is much flatter than the XRT decay slope over the same period. In addition, unlike the XRT, the UVOT lightcurve contains no flaring during this period. At , the UVOT lightcurve is steeper () and includes three flares superimposed on the overall lightcurve while the XRT lightcurve has no flaring. No other short burst has so far been observed to manifest optical flaring at such early times.
The XRT spectrum during the first of the burst was proportional to in the energy band. The spectrum in this entire energy band was a single power-law meaning it did not contain any characteristic synchrotron frequency. During this same period, the XRT lightcurve fell off as signifying that the synchrotron peak frequency was below the XRT band or less than . This indicates that the synchrotron cooling frequency was either less than or above . If the cooling frequency were to be below then the XRT spectrum would be (where is the electron power-law distribution index) giving a value for which is highly unlikely (it is much too small for the X-ray spectrum of GRB afterglows). We therefore conclude that the cooling frequency for was above (cf. Sari, Piran, & Narayan, 1998; Chevalier & Li, 1999; Rol et al., 2005). An X-ray lightcurve due to shocks in a uniform density circum-stellar medium (CSM) is expected to fall off as , for a photon index of 1.53, instead of the observed decay. The observed lightcurve decay is consistent with a wind-like density stratification for the CSM. However, the subsequent decline of the X-ray lightcurve and the spectrum are seriously at odds with this possibility and therefore we do not consider it to be a viable solution. The steeper than expected fall off of the lightcurve could be due to some combination of a structured jet, radiative loss of energy, and decreasing microphysics parameters ( & ; cf. Panaitescu et al., 2006b).
The flux in the band at from the forward shock, assuming the XRT band below the synchrotron cooling frequency and a burst redshift of 1 which provides a luminosity distance () , is (eq. B7 from Panaitescu & Kumar (2000) is used since we assume and a homogeneous external medium)
| (1) |
where is the isotropic equivalent energy in units of , ( is the energy fraction in electrons), is the energy fraction in the magnetic field, is the density of the CSM, and we used as suggested by the early X-ray spectrum444Since , then . The lower bound (1.86) would lead to a negative energy fraction of electrons which is an unphysical event., in calculating the numerical values in the above equation. Note that the error in the burst redshift has a very small effect on the X-ray flux formula given above as has almost a linear dependence on the isotropic burst energy and therefore the effect of uncertainty in distance on and nearly cancel each other. Substituting the observed value of the X-ray flux of in the above formula we find
| (2) |
Moreover, applying the constraint that the cooling frequency is greater than at (because the photon spectral index is 1.53) we obtain
| (3) |
Equation (3) follows from the expression of cooling frequency given in the literature (eq. 27 from Panaitescu & Kumar (2000) assuming ). Combining equations (2) and (3) we find: . Moreover, for the fraction of energy of the shocked fluid in electrons is equal to which cannot be greater than 1, and therefore and . The -ray fluence suggests that the isotropic equivalent energy in photons, assuming , was , which is consistent with the above derived constraint on the energy in the explosion of . Since the radiative efficiency for the prompt -ray emission must be less than 100%, and likely of order a few tens of percent, this suggests , and . Substituting these values in equation (2) we find
| (4) |
We next make use of constraints on the synchrotron injection frequency (the synchrotron frequency at which the bulk of the electrons which are injected by the shock front radiate) which is given by (e.g. eq. 22 in Panaitescu & Kumar, 2000)
| (5) |
Since the XRT lightcurve is falling off as starting from the very first XRT data point at (where ), we conclude that at this time. If , then the XRT lightcurve would be rising with time as (cf. Panaitescu & Kumar, 2000). Using equation (5) for we therefore conclude that ; & were used in this estimation. Moreover, at or , should be greater than since the UVOT lightcurve is flat during the time interval . This constraint, and equation (5), leads to . From these upper and lower limits on it seems reasonable to infer that , which when substituted into equation (4) gives the density of the CSM to be . This is consistent with the combined UVOT/XRT SED which reveals that no intrinsic dust is required to model the environment of the burst. This appears that the burst went off in a low density medium that is usually found in bubbles or the outskirts of galaxies.
If the UVOT band lies below , the lightcurve is expected to rise as (cf. Piran, 1999; Panaitescu & Kumar, 2000). However, the lightcurve seems to be nearly flat for the initial 10 minutes or so, thus, we conclude that is below the UVOT band. It is likely that the same process that caused a steeper fall off of the early X-ray lightcurve, by , could have also flattened the rise of the early UVOT lightcurve from the expected to . The general decline of the optical lightcurve between 10 and is roughly the same as the early X-ray lightcurve and that is consistent with the forward external shock model.
The X-ray lightcurve for is steeper than the early lightcurve by and that is almost certainly a result of the cooling frequency dropping below the XRT band; the spectrum during this stage also became softer as expected for a cooling transition. However, the flux at is larger by a factor compared with the extrapolation of the earlier X-ray lightcurve. This suggests quite a substantial amount of energy being added to the forward shock, almost twice the amount of the initial energy in the explosion, during the time period of 1 to . It is also possible that the enhanced X-ray flux could be due to the GRB ejecta running into a denser shell of CSM.
There are fluctuations in the UVOT lightcurve between 4 and whereas during this period the X-ray lightcurve has a smooth powerlaw decline. This interesting behavior is not expected for energy being added to the decelerating forward shock (due to late time central engine activity, for instance) whereas this is consistent with fluctuations in the density of the CSM. The observed flux at frequencies above the cooling frequnecy () is very insensitive to the CSM density structure and this could explain the smoothly declining XRT lightcurve. The flux at frequencies between and varies with density as (cf. Piran, 1999; Panaitescu & Kumar, 2000), and hence density fluctuations will be reflected in the optical lightcurve if ; the amplitude of the UVOT flux variation corresponds to a factor of about 2 variations in CSM density, and the short timescale for the variability suggests small scale fluctuation in the CSM. We note that the early X-ray lightcurve (), when the XRT band was below , also showed fluctuations, lending additional credence to the interpretation of CSM density fluctuation.
The variations in the XRT and UVOT lightcurve occur on very short timescales (, where is the variability timescale). These small amplitude fluctuations can arise in the external shock with ; for instance, when the shock front crosses a density clump of size much less than ( is the radius of the external shock and is the Lorentz factor) it will increase the observed flux a bit. This increase will last for a time where is determined by the clump size, and the amplitude of fluctuation by its mass.
This short burst offers conflicting evidence as to the nature of the progenitor and its surrounding medium. On the one hand the afterglow data suggests that the burst went off in a low density medium and on the other hand fluctuations in the UVOT lightcurve and a lack of corresponding fluctuation in the X-ray data suggests that the CSM density varied by a factor of order 2 on a length scale of a few times .
The low density of the circum-stellar medium has fluctuations that one normally associates with the surroundings of a massive star and inhomogeneities of a windy medium. However, the prospect of the progenitor being a massive star is unlikely. The mean density of the medium for this burst is small () for a massive star. In addition, although it can not be ruled out, no host galaxy was found at the location of GRB 060313. Instead, a search in the extragalactic databases indicates that there are 12 galaxies within 5′ of GRB 060313, of which 6 are within 2′ and one within 30″ (B042408.28-105721.7). Could this possibly be a galaxy cluster with which the GRB is associated? Currently there are no known redshifts or color information on these galaxies; therefore, it can not be determined for certain. However, if we assume that there is no host galaxy at the position of the GRB and that it is part of this potential galaxy cluster, it is unlikely that a massive star can travel such great distances. Massive stars live for about 10 million years, and their peculiar velocity is not more than a few tens of . Therefore, in their lifetime, a massive star can only travel a distance of less than a few hundred pc.
In contrast, the natal kick of a neutron star () and the typical life times of compact binaries () allow for DNS and NS-BH binaries to travel great distances. Assuming a redshift for GRB 060313 of (for GRB 050709 - the closest measured redshift for a short GRB; Fox et al., 2005), (the average measured redshift for short GRBs; La Parola et al., 2006), (for GRB 051221A - the farthest measured redshift for a short GRB; Soderberg et al., 2006), and (for the UVOT upper redshift limit), a compact binary progenitor could have been associated with a galaxy that is , and away, respectively. These distances are consistent with the distances to some of the galaxies in the potential cluster. Without the early lightcurves, particularly the UV/optical lightcurve, we would have automatically assumed that the progenitor of this GRB was a compact binary merger. However, the data suggests that GRB 060313 may arise from a mechanism other than the established compact binary model.
An alternative possibility is that the rapid variabilities in the UVOT lightcurve are produced by late-time central engine activity similar to those produced in late-time X-ray flares seen in many other GRBs (e.g. Burrows et al., 2005b; Zhang et al., 2006; Levan et al., 2006). Such a possibility has been raised to discuss other rapid optical variabilities of pre-Swift afterglows with (e.g. Ioka, Kobayashi, & Zhang, 2005). In this scenario, no CBM density fluctuation is required. The lack of variability in the X-ray band may be due to the fact that the ’s of these late flares are very low (i.e. in the UV/optical regime), so that their contributions to the X-ray band are negligible compared with the afterglow level. Within the late internal shock scenario, soft flares are in principle possible given the combination of a low luminosity and a large Lorentz factor as a result of less baryon loading at later times (Zhang & Mészáros, 2002). The challenge is how to restart the central engine at very late epochs in short GRBs. The same problem has also been encountered when interpreting the multiple late time flares of GRB 050724 (Barthelmy et al., 2005b), and some suggestions have been made to explain its behavior (e.g. Barthelmy et al., 2005b; Perna, Armitage, & Zhang, 2006; Proga & Zhang, 2006; Dai et al., 2006; Faber et al., 2006).
4 Conclusion
The multi-wavelength lightcurve of the SHB GRB 060313 reveals a multi-peaked structure in the -ray, hard X-ray, X-ray, and UV/Optical bands at different epochs of the prompt and afterglow emissions. The hard X-ray spectrum during the prompt emission had a positive spectral index consistent with the synchrotron-self-Compton model for -ray generation. The large number of peaks in the -ray lightcurve is possibly the result of the central engine generating an extremely variable outflow.
The early () X-ray temporal decay slope () is exceptionally steep for the observed X-ray spectrum and manifests flaring components superimposed on the lightcurve. During the same period the UV/Optical lightcurve reveals a flat decay profile () with no flaring. This behavior can be attributed to a combination of a structured jet, radiative loss of energy, and decreasing microphysics parameters. The X-ray spectrum indicates that the cooling frequency was not much greater than at after the burst. At later times () the UV/Optical lightcurve manifests flaring on top of a decaying profile () while the X-ray exhibits no evidence of flaring on top of a lightcurve that is steeper than at earlier times. An interpretation of the data points to a burst that occurred in a low density medium and that the CSM density varied by a factor of order 2 on a length scale of a few times . Although the collapse of a massive star as the progenitor mechanism is doubtful (though it can not be ruled out), the favored model of a compact binary merger also creates problems in explaining the burst’s behavior. One explanation for this behavior is that at least some short bursts may be the result of a different mechanism other than the traditional compact binary model. An alternate explanation is that late-time central engine activity is injecting energy into the UV/optical regime but not into the X-ray regime.
This is the first short burst that has manifested this kind of behavior. Because the sample size is small, more observations of these objects are needed in order to determine whether GRB 060313 is the norm or anomalous for short GRBs. In addition, more detailed theoretical modeling is needed to establish a clearer picture of the mechanism.
References
- Aptekar et al. (1995) Aptekar, R. L., et al. 1995, Space Sci. Rev., 71, 265
- Arimoto et al. (2006) Arimoto, M., et al. 2006, GCN Circ. 4550
- Barbier et al. (2006) Barbier, L. M., et al. 2006, ApJ, in prep
- Barthelmy et al. (2005a) Barthelmy, S. D., et al. 2005a, Space Sci. Rev., 120, 143
- Barthelmy et al. (2005b) Barthelmy, S. D., et al. 2005b, Nature, 438, 994
- Barthelmy et al. (2006) Barthelmy, S., Cummings, J., Gehrels, N., Krimm, H., Norris, J., Sakamoto, T., & Palmer, D. 2006, GCN Circ. 4879
- Berger et al. (2005) Berger, E., et al. 2005, Nature, 438, 988
- Bloom et al. (2006) Bloom, J. S., et al. 2006, ApJ, 638, 354
- Burrows, Capalbi, & Grupe (2005) Burrows, D. N., Capalbi, M., & Grupe D. 2005, GCN Circ. 4366
- Burrows et al. (2005a) Burrows, D. N., et al. 2005a, Space Sci. Rev., 120, 165
- Burrows et al. (2005b) Burrows, D. N., et al. 2005b, Science, 309, 1833
- Burrows et al. (2006) Burrows, D. N., et al. 2006, ApJ, submitted (astro-ph/0604320)
- Campana et al. (2006) Campana, S., et al. 2006, A&A, 451, 777
- Capalbi et al. (2005) Capalbi, M. Perri, M., Burrows, D. N., Grupe, D., Boyd, P., & Voges, W. 2005, GCN Circ. 4374
- Chevalier & Li (1999) Chevalier, R. A., & Li, Z. -Y. 1999, ApJ, 520, L29
- Cline et al. (2005) Cline, D. B., Czerny, B., Matthey, C., Janiuk, A., & Otwinowski, S. 2005, ApJ, 633, L73
- Covino et al. (2006) Covino, S., et al. 2006, A&A, 447, L5
- Dai et al. (2006) Dai, Z. G., Wang, X. Y., Wu, X. F., & Zhang, B. 2006, Science, 311, 1127
- De Pasquale et al. (2006) De Pasquale, M., et al. 2006, MNRAS, submitted (astro-ph/0605111)
- Dickey & Lockman (1990) Dickey, J. M., & Lockman, F. J. 1990, ARA&A, 28, 215
- Eichler et al. (1989) Eichler, D., Livio, M., Piran, T., & Schramm, D. N. 1989, Nature, 340, 126
- Faber et al. (2006) Faber, J. A., Baumgarte, T. W., Shapiro, S. L., & Taniguchi, K. 2006, ApJ, 641, 93
- Falcone et al. (2006a) Falcone, A. D., et al. 2006a, ApJ, 641, 1010
- Falcone et al. (2006b) Falcone, A. D., et al. 2006b, ApJ, submitted (astro-ph/0602135)
- Fishman et al. (1994) Fishman, G. J., et al. 1994, ApJS, 92, 229
- Fox et al. (2005) Fox, D. B., et al. 2005, Nature, 437, 845
- Fryer, Woosley, & Hartmann (1999) Fryer, C. L., Woosley, S. E., & Hartmann, D. H. 1999, ApJ, 526, 152
- Gehrels et al. (2004) Gehrels, N., et al. 2004, ApJ, 611, 1005
- Gehrels et al. (2005) Gehrels, N., et al. 2005, Nature, 437, 851
- Golenetskii et al. (2006) Golenetskii, S., Aptekar, R., Mazets, E., Pal’shin, V., Frederiks, D., & Cline, T. 2006, GCN Circ. 4881
- Grupe, Burrows, & Patel (2005) Grupe, D., Burrows, D. N., & Patel, S. 2005, GCN Circ. 4389
- Grupe et al. (2006) Grupe, D., Burrows, D. N., Patel, S. K., Kouveliotou, C., Zhang, B., Mészáros, P., Wijers, R. A. M., & Gehrels, N. 2006, ApJ, submitted (astro-ph/0603773)
- Hill et al. (2004) Hill, J. et al. 2004, SPIE, 5165, 217
- Holland et al. (2002) Holland, S. T., et al. 2002, AJ, 124, 639
- Holland et al. (2005) Holland, S. T., Barthelmy, S., Beardmore, A., Gehrels, N., Kennea, J., Page, K., Palmer, D., & Rosen, S. 2005, GCN Circ. 4034
- Horváth (1998) Horváth, I. 1998, ApJ, 508, 757
- Horváth et al. (2006) Horváth, I., Balázs, L. G., Bagoly, Z., Ryde, F., & Mészáros, A. 2006, A&A, 447, 23
- Hurley et al. (2005) Hurley, K., et al. 2005, ApJS, 156, 217
- Ioka, Kobayashi, & Zhang (2005) Ioka, K., Kobayashi, S., & Zhang, B. 2005, ApJ, 631, 429
- Jakobsson et al. (2004) Jakobsson, P., et al. 2004, New Astronomy, 9, 435
- Kouveliotou et al. (1993) Kouveliotou, C., Meegan, C. A., Fishman, G. J., Bhat, N. P., Briggs, M. S., Koshut, T. M., Paciesas, W. S., & Pendleton, G. N. 1993, ApJ, 413, L101
- Krimm et al. (2005) Krimm, H., et al. 2005, GCN Circ. 3926
- Kumar et al. (2006) Kumar, P., McMahon, E., Barthelmy, S. D., Burrows, D., Gehrels, N., Goad, M., Nousek, J., & Tagliaferri, G. 2006, MNRAS, 367, L52
- La Parola et al. (2006) La Parola, V., et al. 2006, A&A, submitted (astro-ph/0602541)
- Lattimer & Schramm (1976) Lattimer, J. M., & Schramm, D. N. 1976, ApJ, 210, 549
- Lee, Ramirez-Ruiz, & Granot (2005) Lee, W. H., Ramirez-Ruiz, E., & Granot, J. 2005, ApJ, 630, L165
- Levan & Hjorth (2006) Levan, A. J., & Hjorth, J. 2006, GCN Circ. 4871
- Levan et al. (2006) Levan, A. J., et al. 2006, ApJ, submitted (astro-ph/0603282)
- Liang et al. (2006) Liang, E. W., et al. 2006, ApJ, 646, 351
- Madau (1995) Madau, P. 1995, ApJ, 441, 18
- Markwardt et al. (2006) Markwardt, C., et al. 2006, GCN Circ. 4873
- Mineo et al. (2005) Mineo, T., et al. 2005, GCN Circ. 4188
- Mochkovitch et al. (1993) Mochkovitch, R., Hernanz, M., Isern, J., & Martin, X. 1993, Nature, 361, 236
- Morris et al. (2005) Morris, D. C., Burrows, D. N., Kennea, J. A., Racusin, J. L., Cucchiara, N., Retter, A., & Gehrels, N. 2005, GCN Circ. 3790
- Mukherjee et al. (1998) Mukherjee, S., Feigelson, E. D., Jogesh Babu, G., Murtagh, F., Fraley, C., & Raftery, A. 1998, ApJ, 508, 314
- Narayan, Paczyński, & Piran (1992) Narayan, R., Paczyński, B., & Piran, T. 1992, ApJ, 395, L83
- Norris & Bonnell (2006) Norris, J. P., & Bonnell, J. T. 2006, ApJ, 643, 266
- Paczyński (1986) Paczyński, B. 1986, ApJ, 308, L43
- Paczyński (1991) Paczyński, B. 1991, Acta Astron., 41, 257
- Pagani et al. (2006a) Pagani, C., et al. 2006a, GCN Circ. 4867
- Pagani et al. (2006b) Pagani, C., Morris, D., Grupe, D., & Burrows, D. 2006b, GCN Circ. 4875
- Pagani et al. (2006c) Pagani, C., et al. 2006c, ApJ, 645, 1315
- Panaitescu (2006a) Panaitescu, A. 2006a, MNRAS, 367, L42
- Panaitescu et al. (2006b) Panaitescu, A., Mészáros, P., Burrows, D. N., Nousek, J. A., Gehrels, N., O’Brien, P., & Willingale, R. 2006b, MNRAS, 369, 2059
- Panaitescu & Kumar (2000) Panaitescu, A., & Kumar, P. 2000, ApJ, 543, 66
- Parsons et al. (2005) Parsons, A., et al. 2005, GCN Circ. 4363
- Perna, Armitage, & Zhang (2006) Perna, R., Armitage, P. J., & Zhang, B. 2006, ApJ, 636, L29
- Piran (1999) Piran, T. 1999, PhR, 314, 575
- Proga & Zhang (2006) Proga, D., & Zhang, B. 2006, MNRAS, 370, 61
- Racusin (2006) Racusin, J. 2006, Private Communication
- Retter et al. (2005) Retter, A., et al. 2005, GCN Circ. 3788
- Rol et al. (2005) Rol, E., Wijers, R. A. M. J., Kouveliotou, C., Kaper, L., & Kaneko, Y. 2005, ApJ, 624, 868
- Roming et al. (2005a) Roming, P., Breeveld, A. A., Marshall, F., Parsons, A., Fink, R., & Ajello, M. 2005a, GCN Circ. 4390
- Roming et al. (2005b) Roming, P. W. A., et al. 2005b, Space Sci. Rev., 120, 95
- Rosswog, Ramirez-Ruiz, & Davies (2003) Rosswog, S., Ramirez-Ruiz, E., & Davies, M. B. 2003, MNRAS, 345, 1077
- Sakamoto et al. (2006) Sakamoto, T., et al. 2006, in AIP Conf. Proc. 836, Gamma-Ray Bursts in the Swift Era, ed. S. S. Holt, N. Gehrels, & J. A. Nousek (Melville: AIP), 43
- Sari, Piran, & Narayan (1998) Sari, R., Piran, T., & Narayan, R. 1998, ApJ, 497, L17
- Soderberg & Frail (2006) Soderberg, A. M., & Frail, D. A. 2006, GCN Circ. 4884
- Soderberg et al. (2006) Soderberg, A. M., et al. 2006, ApJ, submitted (astro-ph/0601455)
- Thöne et al. (2006) Thöne, C., Feron, C., Hjorth, J., & Jensen, B. L. 2006, GCN Circ. 4874
- Tueller et al. (2005) Tueller, J., et al. 2005, GCN Circ. 3005
- Vaughan et al. (2006) Vaughan, S., et al. 2006, ApJ, 639, 323
- Villasenor et al. (2005) Villasenor, J. S., et al. 2005, Nature, 437, 855
- Zhang et al. (2006) Zhang, B., Fan, Y. Z., Dyks, J., Kobayashi, S., Mészáros, P., Burrows, D. N., Nousek, J. A., & Gehrels, N. 2006, ApJ, 642, 354
- Zhang & Mészáros (2002) Zhang, B., & Mészáros, P. 2002, ApJ, 581, 1236