The Central Regions of M31 in the m Wavelength Region 11affiliation: Based on observations obtained at the Gemini Observatory, which is operated by the Association of Universities for Research in Astronomy, Inc., under a co-operative agreement with the NSF on behalf of the Gemini partnership: the National Science Foundation (United States), the Particle Physics and Astronomy Research Council (United Kingdom), the National Research Council of Canada (Canada), CONICYT (Chile), the Australian Research Council (Australia), CNPq (Brazil), and CONICET (Argentina).
Abstract
Images obtained with NIRI on the Gemini North telescope are used to investigate the photometric properties of the central regions of M31 in the m wavelength range. The light distribution in the central arcsecond differs from what is seen in the near-infrared in the sense that the difference in peak brightness between P1 and P2 is larger in than in ; no obvious signature of P3 is detected in . These results can be explained if there is a source of emission that contributes of the peak light of P1, that has an effective temperature of no more than a few hundred K and is located between P1 and P2. Based on the red color of this source, it is suggested that the emission originates in a circumstellar dust shell surrounding a single bright AGB star. Tests of this hypothesis are described. A bright source that is arcsec from the center of the galaxy is also detected in . This object has red colors, and an absolute brightness in that is similar to the most highly evolved AGB stars in the solar neighborhood; hence, it is likely to be a very evolved AGB star embedded in a circumstellar envelope. The band brightness of this star is close to the peak expected for AGB evolution, and an age of only a few hundred million years is estimated, which is comparable to that of the P3 star cluster. Finally, using high angular resolution near-infrared adaptive optics images as a guide, a sample of unblended AGB stars outside of the central few arc seconds is defined in . The color-magnitude diagram of these sources shows a dominant AGB population with a peak brightness and a range of colors that are similar to those of the most luminous M giants in the Galactic bulge.
1 INTRODUCTION
The majority of nearby late-type spiral galaxies harbour distinct nuclei that often show evidence of recent star formation (e.g. Carollo et al. 2001; Boker et al. 2002; Scarlata et al. 2004). Because they are viewed at comparatively high spatial resolutions, the spiral galaxies in the Local Group and the nearest external ensembles, such as the Sculptor, Centaurus, and M81 groups, play a key role in understanding the nature of these nuclei. As the nearest external spiral galaxy, M31 is of particular importance for characterizing galaxy nuclei, and understanding the Galactic Center in the broader context of other systems.
The gross morphological properties of M31 are similar to those of the Milky-Way, and the two galaxies have similar total masses. Nevertheless, aside from these broad similarities there have been significant differences in their evolutionary histories. Some of these differences may have originated during very early epochs; for example, the integrated spectra of M31 globular clusters show enhanced CN absorption when compared with Milky-Way globular clusters, and this may be due to differences in the early enrichment of the protogalactic environment (e.g. Beasley et al. 2004).
Some of the differences in evolutionary histories may also be a consequence of processes that continued to recent epochs, and possibly to the present day. There are indications that M31 is experiencing on-going tidal interactions with its companions (Ferguson et al. 2002, Zucker et al. 2004), and this is expected to have an impact on the global stellar content of the galaxy. Indeed, M31 appears to contain a population of intermediate age globular clusters that has no known counterpart in the Galactic cluster system, and the chemical content and dynamical properties of these clusters suggest an origin that is distinct from that of older M31 clusters (Beasley et al. 2005). There is also a population of stars with a disk-like metallicity that is seen well off of the plane of the M31 disk that appears to have an age of 6 Gyr, and the tidal stirring of the M31 disk and companions are one possible explanation for such a population (Brown et al. 2003). While the Milky-Way has also interacted with its companions (Ibata, Gilmore, & Irwin 1994; Martin et al. 2004), these encounters evidently have not produced a large, intermediate-age, metal-rich extraplanar population. The total star formation rate (SFR) of M31 at the present day is also significantly lower than that of the Milky-Way (0.6 versus 3 to 5 M⊙ year-1; Prantzos & Aubert 1995; Williams 2003), although M31 likely had a higher SFR roughly 1 Gyr in the past (Williams 2002). Renda et al. (2005) investigate the very different chemical evolution histories of the Milky-Way and M31.
Differences between M31 and the Milky-Way are also evident when comparing the innermost regions of these galaxies. The central black hole in M31 is an order of magnitude more massive than that in the Milky-Way (e.g. Ghez et al. 2005; Bender et al. 2005). The central regions of the two galaxies are also morphologically different, in that while M31 contains two sources in the inner arcsec (e.g. Lauer et al. 1993), the center of the Milky-Way would appear as a single source when viewed at the same distance (Davidge et al. 1997b). The brightest of the central sources in M31 at wavelengths longward of m, P1, is spatially extended and offset from the isophotal center of the galaxy. The second source, P2, coincides with the isophotal center of the galaxy, and is more compact than P1. While the spectral energy distribution (SED) of P2 is such that it dominates over P1 in the near-ultraviolet (e. g. Lauer et al. 1998), both sources have similar near-infrared colors (Davidge et al. 1997a; Corbin, O’Neil, & Rieke 2001). The Mgb and Ca triplet indices of P1 and P2 differ only slightly from those of the surrounding bulge (Kormendy & Bender 1998). P1 and P2 thus are not a single object riven by a dust lane, and Tremaine (1995) suggests a dynamical origin for these structures.
Bender et al. (2005) used HST STIS spectra to investigate the stellar content of the central regions of M31, and isolated an A-type spectrum in the center of P2, which they call P3. P1, P2, and P3 appear to be dynamically coupled, consisting of nested disks (Bender et al. 2005). If modelled as a simple stellar system, P3 is a Myr population with a mass of 5200 M⊙. The discovery of P3 is consistent with the analysis of lower angular resolution integrated spectra, which predicted a centrally concentrated young or intermediate age population in M31 (e.g. Bica, Alloin, & Schmidt 1990; Davidge 1997; Sil’chenko, Burenkov, & Vlasyuk 1998). For comparison, the Sgr A complex and its environs are sites of recent ( Myr) star formation (e.g. Cotera et al. 1996; Davidge et al. 1997a; Blum et al. 2003). There is also evidence for previous episodes of star formation in and around Sgr A, indicating that the current activity is not a unique occurence (Blum et al. 2003).
Could the differences in nuclear stellar contents be related to the masses of the central black holes? Heckman et al. (2004) characterized the accretion and SFRs around black holes in a large sample of Type 2 AGNs, and found (1) that black-hole growth in the local Universe is fastest among black holes that have masses M⊙, and (2) that the ratio of SFR to growth rate decreases towards higher black hole masses. Differences in the young stellar populations near the centers of bulges that harbour very large black holes and those of more modest size, such as that in the Galactic Center, might then be expected as part of the overall downsizing trend in the Universe. This being said, the statistics of blue nuclei in nearby galaxies suggest that star formation likely occurs periodically near the centers of late-type spiral galaxies during intervals Gyr (e.g. Davidge & Courteau 2002), and so the age difference between the most recent episodes of star formation in Sgr A and P3 may not be significant.
Additional insights into the stellar content near the center of M31 can be obtained from observations at wavelengths longward of m. This wavelength region probes light from sources with characteristic temperatures K, such as might originate in circumstellar environments. The sources expected to have the strongest circumstellar emission at these wavelengths are very massive and/or highly evolved stars. Objects of this nature are relatively rare, and at wavelengths longward of m the contrast between the objects that show hot circumstellar emission and the main body of stars is greatly increased. Images in the m wavelength interval might thus provide a means of resolving individual stars, albeit those that are highly evolved and hence most difficult to model, in regions that are very crowded at visible and near-infrared wavelengths.
In the current paper, and observations of the central regions of M31, obtained with the NIRI imager on Gemini North, are combined with high angular resolution images that were obtained with the CFHT adaptive optics (AO) system. These data are used (1) to investigate the SED of the central arcsecond of M31 in the m wavelength interval, and (2) to search for bright sources outside of the nuclear regions. The observations and the procedures used to reduce the data are discussed in §2, while the SED of the central arcsecond in the m wavelength interval is investigated in §3. The properties of the brightest circumnuclear sources are discussed in §4, and a summary and discussion of the results follows in §5.
2 OBSERVATIONS & REDUCTION
2.1 NIRI and Short Exposure Observations
The central regions of M31 were observed during the nights of September 3, 4, and 6 2005 as part of the queue-scheduled observing program for NIRI on Gemini North. The program identification number is GN-2005B-Q-59. The instrument was configured with the f/32 camera; the image scale is thus 0.022 arcsec pixel-1 and the total imaged field is arcsec2. The galaxy nucleus was positioned near the center of the NIRI science field.
The data were recorded on all three nights, as a series of on-source/background field pairs. Sixty co-added 0.4 second exposures were recorded of the central regions of M31, and these were followed immediately by a similar set of observations of a background region located roughly 1 arcminute from the nucleus. After this pair of observations was completed, the telescope pointing was returned to the center of M31 to sample the next step in the five point dither pattern. After all five dither positions had been observed the cycle was re-started at the first dither position; the central position of the background field was also offset from that used in the previous observing sequence to facilitate the suppression of bright sources in the background field. The total on-source integration time obtained in this manner is 3500 seconds. A standard star close to M31 on the sky was observed either immediately before or after the observations on each night. The seeing measured from the standard star was 0.4 arcsec FWHM, and the standard deviation in the photometric zeropoints is magnitudes.
Observations of the central regions of M31 in were recorded on the night of September 6, 2005. The total integration time for these data is much shorter than that of the data, due to the lower sky background in . Sixty co-added 0.5 second exposures were recorded at each of 5 different dither positions. As with the observations, a background field located roughly 1 arcmin away was also observed immediately after each dither position. The total on-source integration time is 150 seconds. Only the central pixels of the NIRI detector were read out for these observations. These data will be referred to as the ‘short exposure’ observations. A standard star located close to M31 on the sky was observed immediately before the data were recorded, and the image quality was measured to be 0.5 arcsec FWHM.
While deeper images are available (§2.2), the short exposure data are used in the study of the central arcsec of M31 in §3 because they were recorded during the same epoch as the data. This is an important consideration as the brightest objects at these wavelengths tend to be photometric variables. Moreover, the and short exposure data are subject to the same acquisition and reduction procedures; hence, these data form a homogeneous dataset for probing the nuclear regions of M31.
To reduce the and short-exposure data, the background field observation in each data pair was subtracted from the corresponding observation of the center of M31. The resulting background-subtracted images were found to contain a residual thermal pattern arising from thermal variations between the two positions. A calibration frame to remove this residual emission was constructed by median-combining the background-subtracted data obtained on each night without spatial registration to correct for the dither offsets. While the subtraction of this calibration frame removes the residual thermal signature, the low spatial frequency contributions from the M31 bulge outside of the nuclear regions are also suppressed. The pixels in the resulting data were block averaged in pixel2 groups ( arcsec2) to produce images with angular sampling that better matches the seeing, and these block-averaged images were spatially registered to correct for the dither offsets. A final image was then constructed by median-combining the registered images.
2.2 NIRI Long Exposure Observations
Deep images of M31 were recorded with NIRI on the night of November 2 2003, as part of a study of surface brightness fluctuations at infrared wavelengths in M31 and M32 (Jensen 2006, in preparation). The program identification number is GN-2003B-Q-43. The data were collected using a 512512 subarray and the f/14 camera, so that each image covers 25.6 arcsec on a side with 0.05 arcsec pixel-1 sampling. Two hundred exposures of 0.151 second duration were co-added at each dither position. A similar set of exposures was taken of an empty sky field located 16.5 arcmin northwest of the nucleus immediately after each M31 dither position was observed. The total exposure time was 2748.2 sec, giving a pixel-1 even near the edges of the field of view. Standard stars were observed, and the resulting photometric zero point is consistent with that measured in September 2005.
The sky frames bracketing each M31 observation were averaged, and the result was subtracted from the M31 observation. The sky-subtracted data were then divided by a flat field image, which was constructed by normalizing the average of all the sky images. This flat fielding step was judged to be necessary because the longer exposure time of these data lowered the background noise level to the point where it was comparable to flat field variations; this is not the case in the and short exposure data, where background noise dominates. The flat fielded data were then spatially aligned and averaged to construct the final image. The image quality in the combined frame is 0.35 arcsec FWHM. The final image, which will be referred to as the ‘long exposure’ dataset, is used in §4 to investigate the nature of sources and blends outside of the central few arcsec of M31.
2.3 CFHT Adaptive Optics Observations
Images of the central regions of M31 were recorded through and filters with the CFHT AO system and KIR imager on the night of September 10, 2000. These data were used by Davidge (2001) to investigate the stellar content of the inner regions of the M31 bulge, and additional details of the instrument configuration, the observing procedures, and the reduction of these data can be found in that paper. To facilitate comparisons with the NIRI data, the CFHT images were re-sampled to have the same pixel scale as the NIRI observations. A spatial filter was applied to simulate the removal of low spatial frequency bulge light that occured in the processing of the and short exposure data (see above), and the result was convolved with a gaussian to match the angular resolution of the data.
3 THE CENTRAL ARCSECOND OF M31 IN THE m WAVELENGTH INTERVAL
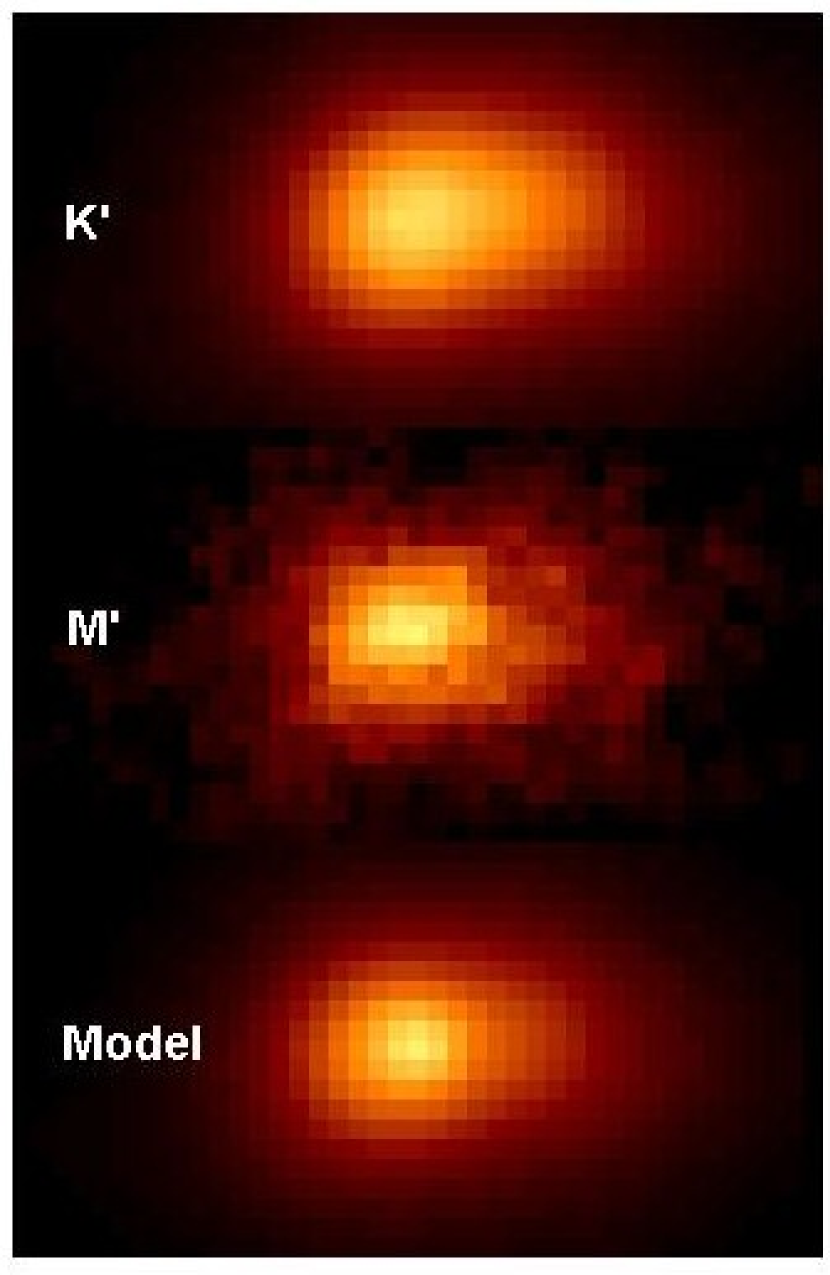
The morphology of the central arcsecond of M31 near 2.1 and m is investigated in Figure 1, where portions of the (top panel) and (middle panel) images are compared. The data have been rotated so that the line connecting P1 and P2 falls along the horizontal axis. The nuclear morphologies at these wavelengths are very different. The brightest source in is P1, and the elongation to the right of P1 due to P2P3 is clearly visible. While P1 also dominates in , the elongation due to P2P3 is much more subtle than in .
A more quantitative comparison of the wavelength dependence of the nuclear properties is conducted in Figure 2, where the light profiles in , , and of a 0.6 arcsec wide strip along the P1 – P2 axis are compared; the light profile is that extracted from the short exposure images. The light profiles in and are almost indistinguishable after being scaled to the same peak P1 brightness; however, the and profiles are very different, in that the profile falls below the profile near P2. The light profile also falls below the profile near P2, although with a much smaller difference than is seen in the top panel.
The differences between the and light profiles in Figure 2 are not due to a mis-match in image quality. Indeed, the image qualities of these data were matched using observations of standard stars that were recorded either before or after the datasets were obtained, and these were checked using a bright source that is 7 arcsec south of the nucleus (§4). Comparisons between the and light profiles in which the image qualities of each were perturbed by 0.1 arcsec with respect to the other indicate that the main result from the top panel of Figure 2, which is that the and light profiles are very different, is robust.
The light profile in Figure 2 can be modelled by combining the profile with a point source that is slightly offset from the center of P1. This is demonstrated in the upper panel of Figure 3, where a scaled version of the PSF, obtained from the standard star observations, has been added to the profile. Initial efforts to combine the profile and a scaled version of the PSF showed that the point source must be offset by arcsec from the center of P1, in the direction towards P2; with this offset, a reasonable match between the and model profiles was found if the point source contributes of the peak light from P1 in . The approximate integrated brightness of the point source is then .
The fit of this model to the data perpendicular to the P1–P2 axis provides an independent check of these results. The result of combining the profile perpendicular to the P1 – P2 axis with a point source that contributes 20% of the peak light from P1 is shown in the lower panel of Figure 3. It was not necessary to displace the point source from the centerline of the P1 – P2 axis, indicating that the source likely falls within a few hundredths of an arc second of the P1 – P2 axis. The model in which 20% of the light comes from a point source provides a reasonably good match to the profile perpendicular to the line connecting P1 and P2.
A two dimensional representation of the model is shown in the lower panel of Figure 1. The simple model that we have considered provides a reasonable match to the observed morphology of the central arcsec of M31 in . Thus, we conclude that there is a source that is offset slightly from P1 that is a major contributor to the light in the central arcsec of M31 near m.
Various color profiles along the P1 – P2 axis are shown in Figure 4. The and colors are roughly constant in the vicinity of P1 and P2, with and , indicating that the integrated light in the m region of both components is dominated by K–M giants (e.g. Bessell & Brett 1988); this is consistent with the visible and near-infrared spectra of P1 and P2 (Kormendy & Bender 1999). However, the color varies along the axis connecting P1 and P2, in the sense that there is a bump that occurs between P1 and P2. The peak color is 0.15 magnitudes redder than the region outside of this bump. The color outside of the bump is roughly consistent with that expected for M giants, while the peak color is redder than expected from a stellar photosphere. The nature of the source that contributes to the thermal emission near P1 is discussed further in §5.1.
The CFHT data have FWHM arcsec in and (Davidge 2001), and so have a markedly better angular resolution than the and data; for comparison, with FWHM arcsec, the angular resolution of the CFHT data is closer to that of the and data. The light and color profiles of the CFHT and images in a 0.2 arcsecond wide strip along the P1 – P2 axis, without smoothing to match the angular resolution of the data at longer wavelengths, are shown in Figure 5. At this angular resolution P1 and P2 have comparable colors. There is also no signature of a red source near P1, indicating that the very red source of thermal emission near the center of P1 does not contribute significantly to the integrated near-infrared light. Finally, there is no evidence in Figure 5 of a distinct component corresponding to P3. This is not surprising given the blue SED expected for such a young population and its modest size, both of which make P3 relatively faint in the near-infrared when compared with its surroundings. Indeed, the diminishing contribution that P3 makes to its surroundings towards longer wavelengths is clearly evident when comparing the F300W and F814W images shown by Lauer et al. (1998).
4 CIRCUMNUCLEAR SOURCES
The analysis in §3 was restricted to the central arcsecond of M31. However, the and observations also sample the inner bulge of M31 to distances in excess of 10 arcsec from the center of the galaxy. In this section we discuss the properties of sources that have been detected outside of the central arcsecond.
4.1 A Bright AGB Star Detected in
One of the legacies of the IRAS Observatory was the discovery of sources with significant infrared emission in the direction of the inner Galaxy (Habing et al. 1985). The majority of these objects had not been detected at visible wavelengths at the time of their discovery with IRAS. The far-infrared flux was found to be variable in many of these sources, and Habing et al. (1985) concluded that they are likely evolved, dust-obscured stars. Subsequent observations found that the vast majority of these sources are Mira variables (e.g. Whitelock, Feast, & Catchpole 1991; Allen, Kleinmann, & Weinberg 1993). While the ages of these stars is a matter of controversy, as it depends on their assumed metallicity (e.g. Whitelock et al. 1991), they are potentially important probes of stellar content in heavily obscured regions, and/or very crowded environments, as they stand out against the background of less evolved objects when observed at thermal infrared wavelengths.
The inner bulge of M31 may harbor a population of obscured AGB stars with photometric properties that are similar to the most evolved stars in the Galactic bulge. However, crowding is an obvious complicating factor when attempting to conduct a search for such objects; not only does crowding affect the faint limit of any photometric survey, but two sources of the same brightness that fall within the same angular resolution element will appear as a single source that is 0.75 mag brighter than either of the stars alone. While all stars detected in crowded environments like the central regions of M31 are blends, in many cases a bright star is blended with a much fainter object, and so the measured photometric properties are essentially those of the brighter star. Nevertheless, the incidence of blending between relatively bright objects is high enough that it has confounded efforts to study the stellar content of the M31 bulge using near-infrared data recorded during mediocre natural seeing conditions (e.g. Figure 15 of Stephens et al. 2003).
The contrast between the relatively rare highly evolved bright red stars and the fainter, but much more numerous, blue objects increases as one moves to progressively longer wavelengths, and so the incidence of blends that have a marked impact on the photometric properties of the brightest red stars is reduced. A related observational consequence is that the amplitude of surface brightness flucuations increases with increasing wavelength, as predicted by models (e.g. Blakeslee, Vazdekis, & Ajhar 2001; Liu, Charlot, & Graham 2000; Jensen, Tonry, & Luppino 1998; Worthey 1993). The contrast between bright stars that are embedded in dusty circumstellar envelopes and the underlying body of unresolved stars is enhanced even further at wavelengths longward of m, as stars in dust shells re-radiate much of their light at thermal infrared wavelengths, whereas the SEDs of stars without such envelopes are on the descending Rayleigh-Jeans side of the Planck distribution.
Four bright candidate AGB stars can be identified in the circumnuclear regions of the observations. The CFHT data, which has the highest angular resolution of the datasets considered here, were used to determine if any of these objects could be associated with a single source, and thereby check that these objects are not the result of blends or noise spikes. Two of these objects are located in dense pockets of stars in the CFHT data, and so can not readily be identified with a single source. Another star did not have a corresponding bright source in the image; this does not mean that this source is a noise event, as it could be a photometric variable that was at the lower end of its light variation when the data were recorded. The remaining object could be identified with a single, isolated source, and the photometric properties of this object are listed in Table 1, along with offsets in right ascension and declination from the center of M31, in the sense that negative entries mean south and east of the nucleus; the color uses the brightness from the long exposure NIRI image (§4.2).
The object listed in Table 1 has and , and so is redder than M giants (e.g. Bessell & Brett 1988); this suggests that the light is a combination of photospheric and thermal components. An important caveat when assessing the and colors are that the , and measurements were recorded during different epochs over a five year period. Very bright AGB stars can be photometrically variable, with amplitudes exceeding 1 magnitude in the m wavelength interval, and so the colors may not be representative of the star at any given light curve phase. Nevertheless, the color listed in Table 1 is based on measurements that were separated from each other by less than an hour, and is redder than what is expected for an M giant, for which is typically . The color is thus also consistent with this star having significant amounts of circumstellar dust. The absolute magnitude is , which is consistent with the mean brightnesses of highly evolved AGB stars (e.g. Le Bertre 1992). Thus, we conclude that the object listed in Table 1 is very likely a highly evolved AGB star. The properties of this star are discussed further in §5.2.
4.2 Circumnuclear Sources Detected in
Crowding is potentially more of an issue in than it is in . There are a number of bright sources in the long exposure image, and some of these are almost certainly blends of bright stars. A sample of objects that are not greatly affected by crowding was defined by examining the impact of degrading the angular resolution of the CFHT image on measured brightness. This was done by convolving the image with a gaussian so that it had the same angular resolution as the long exposure image, and then using tasks in the DAOPHOT (Stetson 1987) and ALLSTAR (Stetson & Harris 1988) packages to measure the brightnesses of sources in both the original and smoothed images. The difference between the brightnesses in the smoothed and unsmoothed images, , is a measure of the impact of blending; stars where blending has a significant impact on the photometry will have , whereas sources that are not greatly affected by blending will have . It should be emphasized that this is a conservative method for identifying blended objects in , as the effects of blending are smaller in than in .
Given the high stellar density in this region of M31, it is not surprising that many of the objects are markedly brighter in the smoothed data than the unsmoothed data. Nevertheless, while is typically magnitudes, there are some stars with , and an inspection of the unsmoothed images shows that the sources with tend to be isolated, in the sense of not having companions of comparable brightness within a few tenths of an arcsecond, and have round image cores. Therefore, sources with magnitudes are identified as not being severly affected by crowding.
The brightnesses of stars in the long exposure image were measured using tasks in DAOPHOT and ALLSTAR, and the CMD of sources with is shown in Figure 6. The majority of stars have and between 0 and 2. The object with M is the AGB star discussed in §4.1; this object has . Points corresponding to luminous M giants in the Galactic bulge, based on the photometry presented in Table 1 of Frogel & Whitford (1987), as well as the Galactic disk C stars studied by Le Bertre (1992), are shown in the right hand panel of Figure 6. 333Frogel & Whitford (1987) used the filter for their observations. A comparison of the and brightnesses of UKIRT bright standard stars (http:/www.jach.hawaii.edu/UKIRT/astronomy/calib/phot_cal/ukirt_stds.html) shows that on average for K and M giants/supergiants, where the quoted uncertainty is the standard error in the mean. Given this small offset, the Frogel & Whitford measurements are assumed to be in the system.
There are three main conclusions that can be reached from Figure 6. First, the majority of unblended stars in our sample have intrinsic brightnesses that agree to within magnitudes with the brightest M giants in the Galactic bulge. This difference is comparable to the uncertainties introduced by depth effects in the Galactic bulge and errors in the photometric calibration and residual blending. Second, the AGB star discussed in §4.1 is clearly brighter than the majority of stars in the Galactic Bulge. Third, the majority of C stars in the Le Bertre (1992) sample have , and hence are redder than the brightest stars in the Galactic bulge and the inner regions of the M31 bulge. The comparison in Figure 6 confirms the notion that the brightest AGB stars in the bulge of M31 and the Milky-Way are similar, both in terms of peak brightness and color (e.g. Davidge 2001).
IRS 7 is the most luminous source in the SgrA complex, and so is an interesting benchmark for stellar content studies of the central regions of other galaxies. The location of IRS 7 on the CMD is shown in Figure 6. The points plotted for IRS 7 are based on photometry given by Blum, Sellgren, & DePoy (1996) and Viehmann et al. (2005). Whereas these two studies find similar magnitudes, they give very different colors, perhaps due to photometric variability (e.g. Blum et al. 1996).
A source as bright as IRS 7 would clearly be seen in our data if it were in an uncrowded environment, and no counterpart is detected. This does not mean that a source as bright as IRS 7 is not present, as sources of this brightness that happen to be close to other bright stars may be rejected as blends in the smoothing analysis used here to identify isolated stars. The source near P1 discussed in §3 likely has a luminosity that is comparable to that of IRS 7, although it is not detected in because it is faint at this wavelength (e.g. Figure 2), and is located in an extremely crowded environment.
5 DISCUSSION & SUMMARY
Images recorded through and filters with NIRI on Gemini North have been used to investigate the central regions of M31. The data have been combined with the high-angular resolution near-infrared images recorded with the CFHT AO system that were discussed previously by Davidge (2001). The m wavelength region is important for stellar content studies since stars with dusty circumstellar envelopes can be identified at these wavelengths in relatively crowded environments. Despite the obvious problems caused by high background levels that plague ground-based observations in the thermal infrared, with large ground-based telescopes it is possible to obtain data with an angular resolution that exceeds what can be achieved with smaller aperture facilities in space.
5.1 The Nuclear Regions of M31
As one moves from visible to infrared wavelengths, the dominant source of light from composite stellar systems shifts from stars near the main sequence turn-off to progressively more evolved objects. One consequence is that age-related differences in stellar content can be more difficult to detect in the infrared than at visible wavelengths, as a much longer period of time is required to produce measurable changes in the properties of – for example – RGB stars than main sequence stars. This is evident in the central regions of M31, where the near-infrared colors of P1 and P2 are similar (Figures 4 and 5), even though there are obvious differences between their SEDs at shorter wavelengths (Lauer et al. 1998), due to the moderately young nuclear star cluster P3.
At wavelengths longward of m the SEDs of composite systems are very insensitive to star formation history, unless there is extremely active star formation (e.g. Hunt, Giovanardi, & Helou 2002); in fact, the SEDs of galaxies covering a diverse mix of morphologies and star-forming histories converge at wavelengths longward of m (e.g. Figure 3a of Boselli et al. 2003). Given this tendency for SEDs to converge at thermal wavelengths, any large-scale differences in the SEDs of stars and stellar systems in the m region will likely be due to the presence of non-photospheric light. Indeed, the SEDs of Virgo cluster galaxies shown in Figure 3 of Boselli et al. (2003) indicate that galaxies with very different morphological types (and stellar contents) have with a type-to-type scatter of only a few hundredths of a magnitude. This is similar to the color that we measure throughout most of P1 and P2. Given the modest scatter in colors, a source that is 0.15 mag redder in than the bulk of the population can not be obtained simply by combining the spectra of ‘normal’ composite stellar systems; rather, a non-photospheric thermal component must be present.
In the case of M31, P1 and P2 might be expected to have different SEDs at wavelengths longward of m if there is emission with characteristic temperatures K from sources in P3. However, even though thermal emission from dust is detected from many sources near Sgr A (Viehmann et al. 2005), the amount of such emission from P3 is expected to be modest. Bender et al. (2005) find that P3 has an age Gyr and a mass 5200 M⊙. While individual stars have not yet been resolved in P3, the simulated CMD shown in their Figure 6 consists mainly of main sequence stars later than B5, with only 7 evolved red giants. Thus, P3 likely lacks the massive main sequence stars or extremely bright AGB stars that are sites of thermal emission near the Galactic Center. Our results are consistent with this expectation, as we do not detect a red bump in the and color profile near P2, suggesting that P3 does not contain a large grouping of bright cool sources. Moreover, in §3 it is shown that the color of P2 P3 is consistent with photospheric light with no thermal emission.
What is the nature of the -bright source near P1? In §3 it is demonstrated that the morphological properties of the central arcsec of M31 in can be modelled by combining the m light profile, where the peak brightnesses of P1 and P2 agree to within a few tenths of a magnitude, with a single bright source, that is offset slightly from the center of P1. The source contributes of the light from P1, and has a brightness M. That this object has only a very minor impact on the light profile in Figure 2 suggests that the emission can be characterised by an effective temperature of only a few hundred K. The emission occurs 0.35 arcsec away from P2, which corresponds to a projected distance of parsecs, and so is likely not associated with the central black hole.
The disk model for P1 and P2 forwarded by Tremaine (1995) has been highly successful in reproducing the dynamical properties of this system (e.g. Bender et al. 2005; Kormendy & Bender 1999), and predicts that P1 and P2 should have similar stellar contents. The results discussed here do not pose a problem for the Tremaine (1995) model, as the emission detected in the data may come from a single star that is extremely bright in . Indeed, the bulge of M31 was detected by IRAS, and the 12 and m fluxes indicate that circumstellar emission from warm dust is present (Soifer et al. 1986); consequently, individual sources with red colors might be expected in suitably deep images. The intrinsic brightness estimated from the models in §3 is consistent with what is seen among heavily obscured, intrinsically luminous AGB stars near the peak of their light curves. Moreover, while the majority of circumstellar shells around AGB stars have effective temperatures close to 1000 K some, such as AFGC 3068, have dust shells that are as cool as 300 K (e.g. Le Bertre 1997).
Do we expect to find a single star of this brightness in the central arcsec of M31? To answer this question, we compute R1AGB, which is the radius that will contain one star in the range of progenitor masses for AGB stars with a brightness like the source near P1. To compute R1AGB it is necessary to make assumptions about the stellar content near the center of M31 and the properties of the AGB population. We assume for the baseline calculation (1) that the stars near the center of M31 have roughly solar metallicities and (2) that the star-forming history near the center of M31 averaged over the past 1 Gyr, which is the approximate maximum age of AGB stars of the brightness we are considering, has been similar to that near the Galactic Center, where Blum et al. (2003) find that of the stellar mass has formed within the past 1 Gyr. We further assume that AGB stars near the center of M31 have colors that are similar to the most highly evolved stars near the Galactic Center. Blum et al. (2003) obtained spectra of a number of bright sources near the Galactic Center, and the brightest spectroscopically confirmed AGB stars in their sample that have photometric measurements in Viehmann et al. (2005) are IRS 9 and IRS 12N. If A magnitudes (Davidge 1998), then IRS 9 and IRS 12N have . The location of these stars on the Herzsprung-Russell diagram suggest that they likely have an age Gyr (Blum et al. 2003). Given that the source near P1 is likely younger than this (see below), and that younger AGB stars will be more massive and so may have redder colors, we adopt the upper value for our baseline calculation.
Given that highly evolved AGB stars may be LPVs with amplitudes magnitude in the infrared, then the source near P1 may have a mean M as low as , which corresponds to M if ; thus, we examine the statistics of AGB stars with M for the baseline model. Moreover, we consider a population with log(tyr) = 8.1 – this is the age at which the AGB phase transition occurs, so that the most luminous AGB stars will be present. While adopting such a favourable age may seem contrived, there is evidence for stars close to this age in the central arcsec of M31 (Bender et al. 2005). With the age and metallicity thus fixed, the isochrones tabulated by Girardi et al. (2002) can be used to find the progenitor masses of AGB stars with M. The fractional contribution that these stars make to the total system mass for a given mass function can then be computed.
We find that a solar metallicity system with an age log(tyr) = 8.1 and a Miller & Scalo (1979) mass function must have a mass of M⊙ to have one star in the required mass range. Adopting (M/L) for a population with this age (Mouhcine & Lancon 2002), then such a system will have M. If this population accounts for 1% of the total mass near the center of M31 then the band surface brightness profile constructed from NIRI data (Jensen 2006, in preparation) indicates that R arcsec; thus, we might expect to find a suitably bright AGB star within the central arcsec of M31.
To be sure, the calculation of R1AGB is fraught with uncertainties. For example, if the intermediate-age component makes up 0.1% of the total mass, rather than 1%, then R arcsec, although there would still be a 10% chance of detecting a suitably bright AGB star in the central arcsec. If an age log(tyr) = 8.2 is adopted then R1AGB grows by 0.5 arcsec. If a redder color is assumed, which is not unreasonable if the stars are younger than IRS 9 and IRS 12N, then R1AGB is also altered and a larger range of ages can be considered. For example, if (roughly midway between the colors of IRS 9 12N and IRS 7) then R1AGB that is computed assuming log(tyr) = 8.2 drops to 1 arcsec. If a Salpeter (1955) mass function is adopted then larger R1AGB values are found, with R arcsec for the baseline assumptions. Finally, there are also uncertainties in the isochrones themselves, which we have not considered. Given the various uncertainties, we feel that the most robust conclusion that can be drawn is that the discovery of a single bright AGB star in the central arcsec of M31 is not unexpected given the wide range of plausible assumptions about the progenitor stars and the contribution that they may make to the total stellar mass.
The model in which a single bright AGB star is responsible for producing the emission near P1 can be tested in three ways. First, low to moderate resolution spectra in the m atmospheric window with sub-arcsecond angular resolution could be used to search for continuum emission from hot dust. The CO fundamental bands, which fall between 4.6 and m, are prominent absorption features in the spectra of late-type stars. Continuum emission from hot dust will veil these features, and so we predict a variation in the integrated CO band strengths along the line connecting P1 and P2. The relative colors of P1 and P2 predict that the fundamental CO bands will be weakest 0.1 arcsec away from P1. While the first overtone CO bands near m occur at wavelengths where the sky background is lower, and hence would be easier to observe, the effective temperature of the thermal emission is such that a detectable thermal continuum is not expected at near-infrared wavelengths.
A second test is to search for changes in the brightness of the source near P1. Many bright AGB stars are photometric variables, with periods on the order of hundreds of days and amplitudes approaching magnitude in . Therefore, if the single star interpretation is correct, then the flux may change with time, with measureable differences expected from year to year. This raises the intriguing possibility that the morphology of the M31 nucleus may change over moderately short time scales.
A third test is to check that the light comes from a point source, rather than from an extended source, such as a dust-enshrouded star cluster. Clusters near the center of the Milky-Way have sizes parsec, and this corresponds to an angular size of arcsec when viewed at the distance of M31. For comparison, the data used here have FWHM arcsec. If images recorded with higher angular resolution find that the source is not extended, then it will place tighter constraints on it being a single object.
5.2 Circumnuclear Sources
Using the CFHT images as a guide, a population of isolated stars has been identified in . The brightest AGB stars in the bulges of the Milky-Way and M31 have similar peak band brightnesses (Davidge 2001; Davidge et al. 2005). The data discussed in the present paper further strengthens the notion that the dominant AGB populations in the bulges of the two galaxies are similar, in that the peak brightnesses of objects in the bulges of the Milky-Way and M31 agree to magnitudes, which is within the uncertainties introduced by the photometric calibration and depth effects in the Galactic bulge.
While a number of sources have been identified in our data, only a single source, which has relatively red and colors, has been detected outside of the nuclear regions of M31 in . The colors listed in Table 1 were computed from data recorded at different epochs, and bright AGB stars can be variable with amplitudes approaching one magnitude in the infrared. This could explain why the color in Table 1 is larger than the color, although there are stars such as IRC –30060 that have (Le Bertre 1992). Nevertheless, near simultaneous and measurements give an color that is consistent with a reddened source. The object is a round point source on the CFHT image, which has an angular resolution of 0.15 arcsec ( parsecs), and so it is unlikely that it is a cluster of very young stars in a common dust envelope. Rather, it is more likely that – like the source found near P1 – it is a star evolving near the peak of the AGB and has a circumstellar envelope. Indeed, with M this star has a m brightness that is typical of the AGB stars observed by Le Bertre (1992). This object is magnitude fainter in than the source detected near P1; nevertheless, a direct comparison of brightness is complicated by photometric variability and possible differences in the optical depth of the circumstellar envelopes.
The star discussed in the previous paragraph has M, and hence is close to the peak brightness expected for AGB stars. In fact, isochrones from Girardi et al. (2002) predict that the brightest AGB stars with solar metallicity have M when the age is 0.13 Gyr, whereas for systems with ages of 1 and 10 Gyr the peak AGB brightnesses are M and –7.5; the predicted peak brightnesses change little if a more metal-rich composition is adopted. Keeping in mind the caveat of stellar variablity, the star detected in may thus belong to a population with an age of a few 100 Myr. This source has a projected distance of 30 parsecs from the center of M31, and it is tempting to associate it with the most recent episode of nuclear star formation, which Bender et al. (2005) suggest occured 200 Myr in the past.
The presence of a luminous intermediate age star with a projected distance of parsecs from the center of M31 might suggest that wide scale star formation occured throughout the inner bulge of M31 a few hundred Myr in the past. However, the star may have formed closer to the nucleus of M31. Indeed, it has been suggested that dynamical interactions with giant molecular clouds and the tidal disruption of young clusters may scatter stars into the Galactic bulge (e.g. Figer et al. 1999; Kim & Morris 2001), and similar processes could be at work near the center of M31. Details of the birthplace of this source notwithstanding, if it belongs to a centrally-concentrated population then stars with a similar luminosity will not be uniformly mixed throughout the M31 bulge, and a larger field survey of the inner regions of M31 in would find that the distribution of objects with similar luminosity does not follow the surface brightness profile of the bulge.
Could this object be a planetary nebulae (PN)? Planetary nebula can have very red colors (e.g. Phillips & Cuesta 1994). However, the object in Table 1 is likely too bright to be a PN. Indeed, the PNe seen towards the Galactic bulge tend to have between 11.5 and 13.0 (MK between –1.5 and –3.0), although PNe as bright as M may also be present (e.g. Ramos Larios & Phillips 2005). For comparison, the object in Table 1 has M. Finally, PNe have (Phillips & Cuesta 1994), which is not the case for the object detected here. Hence, it is likely not a PN.
| (arcsec) | (arcsec) | |||||
| –1 | –8 | 14.5 | 14.3 | 0.2 | 0.5 | 0.8 |
References
- (1)
- (2) Allen, L. E., Kleinmann, S. G., & Weinberg, M. D. 1993, ApJ, 411, 188
- (3)
- (4) Beasley, M. A., Brodie, J. P., Strader, J., Forbes, D. A., Proctor, R. N., Barmby, P., & Huchra, J. P. 2004, AJ, 128, 1623
- (5)
- (6) Beasley, M. A., Brodie, J. P., Strader, J., Forbes, D. A., Proctor, R. N., Barmby, P., & Huchra, J. P. 2005, AJ, 129, 1412
- (7)
- (8) Bender, R. et al. 2005, ApJ, 631, 280
- (9)
- (10) Bessell, M. S., & Brett, J. M. 1988, PASP, 100, 1134
- (11)
- (12) Bica, E., Alloin, D., & Schmidt, A. A. 1990, A&A, 228, 23
- (13)
- (14) Blum, R. D., Sellgren, K., & DePoy, D. L. 1996, ApJ, 470, 864
- (15)
- (16) Blum, R. D., Ramirez, S. V., Sellgren, K., & Olsen, K. 2003, ApJ, 597, 323
- (17)
- (18) Boker, T., Laine, S., van der Marel, R. P., Sarzi, M., Rix, H-W, Ho, L. C., & Shields, J. C. 2002, AJ, 123, 1389
- (19)
- (20) Boselli, A., Gavazzi, G., & Sanvito, G. 2003, A&A, 402, 37
- (21)
- (22) Brown, T. M. et al. 2003, ApJ, 592, L17
- (23)
- (24) Carollo, C. M., Stiavelli, M., de Zeeuw, P. T., Seigar, M., & Dejonghe, H. 2001, ApJ, 546, 216
- (25)
- (26) Corbin, M. R., O’Neil, E., & Rieke, M. J. 2001, AJ, 121, 2549
- (27)
- (28) Cotera, A. S., Erickson, E. F., Colgan, S. W. J., Simpson, J. P., Allen, D. A., & Burton, M. G. 1996, ApJ, 461, 750
- (29)
- (30) Davidge, T. J. 1997, AJ, 113, 985
- (31)
- (32) Davidge, T. J. 1998, AJ, 115, 2374
- (33)
- (34) Davidge, T. J. 2000, AJ, 119, 748
- (35)
- (36) Davidge, T. J. 2001, AJ, 122, 1386
- (37)
- (38) Davidge, T. J., & Courteau, S. 2002, AJ, 123, 1438
- (39)
- (40) Davidge, T. J., Rigaut, F., Doyon, R., & Crampton, D. 1997b, AJ, 113, 2094
- (41)
- (42) Davidge, T. J., Olsen, K. A. G., Blum, R., Stephens, A. W., & Rigaut, F. 2005, AJ, 129, 201
- (43)
- (44) Davidge, T. J., Simons, D. A., Rigaut, F., Doyon, R., & Crampton, D. 1997a, AJ, 114, 2586
- (45)
- (46) Ducati, J. R., Bevilacqua, C. M., Rembold, S. B., & Ribeiro, D. 2001, ApJ, 558, 309
- (47)
- (48) Ferguson, A. M. N., Irwin, M. J., Ibata, R. A., Lewis, G. F., & Tanvir, N. R. 2002, AJ, 124, 1452
- (49)
- (50) Figer, D. F., Kim, S. S., Morris, M., Serabyn, E., Rich, R. M., & McLean, I. S. 1999, ApJ, 525, 750
- (51)
- (52) Frogel, J. A., & Whitford, A. E. 1987, ApJ, 320, 199
- (53)
- (54) Gebhardt, K., et al. 2001, AJ, 122, 2469
- (55)
- (56) Ghez, A. M., Salim, S., Hornstein, S. D., Tanner, A., Lu, J. R., Morris, M., Becklin, E. E., & Duchene, G. 2005, ApJ, 620, 744
- (57)
- (58) Girardi, L., Bertelli, G., Bressan, A., Chiosi, C., Groenewegen, M. A. T., Marigio, P., Salsnich, B., & Weiss, A. 2002, A&A, 391, 195
- (59)
- (60) Habing, H. J., Olnon, F. M., Chester, T., Gillett, F., Rowan-Robinson, M., & Neugebauer, G. 1985, A&A, 152, L1
- (61)
- (62) Heckman, T. M., Kauffmann, G., Brinchmann, J., Charlot, S., Tremonti, C., & White, S. D. M. 2004, ApJ, 613, 109
- (63)
- (64) Hunt, L., Giovanardi, C., & Helou, G. 2002, A&A, 394, 873
- (65)
- (66) Ibata, R. A., Gilmore, G., & Irwin, M. J. 1994, Nature, 370, 194
- (67)
- (68) Jensen, J. B., Tonry, J. L., & Luppino, G. A. 1998, ApJ, 505, 111
- (69)
- (70) Kim, S. S., & Morris, M. 2001, ApJ, 554, 1059
- (71)
- (72) Kormendy, J., & Bender, R. 1999, ApJ, 522, 772
- (73)
- (74) Krabbe, A. et al. 1995, ApJ, 447, L95
- (75)
- (76) Lauer, T. R., et al. 1993, AJ, 106, 1436
- (77)
- (78) Lauer, T. R., Faber, S. M., Ajhar, E. A., Grillmair, C J., & Scowen, P. A. 1998, AJ, 116, 2263
- (79)
- (80) Le Bertre, T. 1992, A&AS, 94, 377
- (81)
- (82) Le Bertre, T. 1997, A&A, 324, 1059
- (83)
- (84) Martin, N. F., Ibata, R. A., Bellazzini, M., Irwin, M. J., Lewis, G. F., & Dehnen, W. 2004, MNRAS, 348, 12
- (85)
- (86) Mouhcine, M., & Lancon, A. 2003, A&A, 402, 425
- (87)
- (88) Pantzos, N., & Aubert, O. 1995, A&A, 302, 69
- (89)
- (90) Phillips, J. P., & Cuesta, L. 1994, A&AS, 104, 169
- (91)
- (92) Ramos Larios, G., & Phillips, J. P. 2005, MNRAS, 357, 732
- (93)
- (94) Renda, A., Kawata, D., Fenner, Y., & Gibson, B. K. 2005, MNRAS, 356, 1071
- (95)
- (96) Rieke, G. H., & Lebofsky, M. J. 1985, ApJ, 288, 618
- (97)
- (98) Salpeter, E. E. 1955, ApJ, 121, 161
- (99)
- (100) Scarlata, C. et al. 2004, AJ, 128, 1124
- (101)
- (102) Sil’chenko, O. K., Burenkov, A. N., & Vlasyuk, V. V. 1998, A&A, 337, 349
- (103)
- (104) Soifer, B. T., Rice, W. L., Mould, J. R., Gillett, F. C., Rowan Robinson, M., & Habing, H. J. 1986, ApJ, 304, 651
- (105)
- (106) Stanek, K. Z., & Garnavich, P. M. 1998, ApJ, 503, L131
- (107)
- (108) Stephens, A. et al. 2003, AJ, 125, 2473
- (109)
- (110) Stetson, P. B. 1987, PASP, 99, 191
- (111)
- (112) Stetson, P. B., & Harris, W. E. 1988, AJ, 96, 909
- (113)
- (114) Tremaine, S. 1995, AJ, 110, 628
- (115)
- (116) Viehmann, T., Eckart, A., Schodel, R., Moultaka, J., Straubmeier, C., & Pott, J-U 2005, A&A, 433, 117
- (117)
- (118) Weiner, J., Hale, D. D. S., & Townes, C. H. 2003, ApJ, 589, 976
- (119)
- (120) Whitelock, P., Feast, M., & Catchpole, R. 1991, MNRAS, 248, 276
- (121)
- (122) Williams, B. F. 2002, MNRAS, 331, 293
- (123)
- (124) Williams, B. F. 2003, AJ, 126, 1312
- (125)
- (126) Worthey, G. 1993, ApJ, 409, 530
- (127)
- (128) Zucker, D. B. et al. 2004, ApJ, 612, L117
- (129)