email: machalsk@oa.uj.edu.pl
The new sample of giant radio sources
II. Update of optical counterparts, further spectroscopy of identified faint
host galaxies, high-frequency radio maps, and polarisation properties of
the sources
Our sample of giant radio-source candidates, published in Paper I, is updated and supplemented with further radio and optical data. In this paper we present: (i) newly detected host galaxies, their photometric magnitude, and redshift estimate for the sample sources not identified yet, (ii) optical spectra and spectroscopic redshift for the host galaxies fainter than about mag taken with the Apache Point Observatory 3.5m telescope, and (iii) the VLA 4.9 GHz total-intensity and polarised-intensity radio maps of the sample members. In a few cases they reveal extremely faint radio cores undetected before, which confirm the previously uncertain optical identifications. The radio maps are analysed and the polarisation properties of the sample sources summarised. A comparison of our updated sample with three samples published by other authors implies that all these four samples probe the same part of the population of extragalactic radio sources. There is no significant difference between the distributions of intrinsic size and radio power among these samples. The median redshift of 0.380.07 in our sample is the highest among the corresponding values in the four samples, indicating that the angular size and flux-density limits in our sample, lower than those for the other three samples, result in effective detections of more distant, giant-size galaxies compared to those detected in the other samples. This sample and a comparison sample of ‘normal’-size radio galaxies will be used in Paper III (this volume) to investigate of a number of trends and correlations in the entire data.
Key Words.:
galaxies: active – galaxies:evolution – radio continuum: galaxies1 Introduction
Existing analytical models of the dynamical evolution of classical double radio sources (e.g. Kaiser et al. 1997; Blundell et al. 1999; Manolakou & Kirk 2002) predict that the largest sources must represent a very late phase of their lifetimes. In fact, the most extended structures are observed at rather low redshifts, confirming the effect of ‘youth-redshift degeneracy’ postulated by Blundell et al. Therefore, a search for ‘giant’ radio sources at high redshifts can reveal environmental conditions in denser, not yet fully virialised, extragalactic medium very likely governing the size evolution. On the other hand, their highest energy content, the large ordered magnetic field structures, the typical absence of strong large-scale shocks, and very low upper limits on their internal thermal plasma densities, make them - according to Kronberg et al. (2004) - ‘prime and unique laboratories for constraining the plasma processes that accelerate relativistic electrons within large extragalactic volumes’.
For proper statistical studies of the above conditions and constraints, numerous complete samples of extended radio sources are necessary. The above idea was followed at the same time by independent teams (Schoenmakers et al. 2001; Lara et al. 2001; Machalski, Jamrozy & Zola 2001 [hereafter Paper I]). All of these three samples were selected from the large radio surveys: WENSS (Rengelink et al. 1997) and NVSS (Condon et al. 1998). Recently another sample of giant-size radio sources, selected from the SUMSS (Bock et al. 1999) survey in the southern sky hemisphere, has been published by Saripalli et al. (2005).
In Paper I we presented a sample of 36 large angular-size, double radio sources, in principle with the FRII-type (Fanaroff & Riley 1974) morphology, selected from the VLA 1.4-GHz sky surveys: NVSS and the first part of FIRST (Becker et al. 1995). These two surveys provide radio maps of the sky with two different angular resolutions (45 and 5, respectively) at the same observing frequency, allowing for (i) effective removal of confusing sources, (ii) reliable recognition of double-source identity and determination of its morphological type, and (iii) (for many of the sample sources) determination of the radio core component necessary for the proper identification of the selected source with its host optical object (mostly a galaxy).
In order not to miss sources larger than 1 Mpc111A conventional lower limit for the projected linear extent of giant radio sources if =50 km s-1Mpc-1 and =0.5 used in most of previously published papers at a redshift above 0.3, the sample candidates were selected according to the following selection criteria: each source lies within the sky area of 0.47 sr, limited by 07h20mRA(2000)17h30m and +285Dec(2000)+410, and also has the FRII (or eventually FRI/II) morphological type and an angular size larger than 3, as well as the 1.4-GHz flux density 30 mJy500 mJy. The last criterion sensibly excluded the already well-known giants lying in the sample area (e.g. B 0854+399, 3C 236, B 1358+305).
In Paper I we presented (i) high-resolution VLA observations at 4.86 and 8.46 GHz, which allowed us to detect very weak radio cores in a number of sample sources undetected during the FIRST survey and to identify them with their optical counterparts, (ii) deep optical detections of 9 faint host galaxies beyond the magnitude limits of the existing data bases (Palomar Observatory Sky Survey [POSS], Digitized Sky Survey [DSS]) and their crude photometry, and (iii) low-resolution optical spectra that provided redshifts for 11 identified host galaxies brighter than about mag (for the other 5 galaxies their redshifts were known prior to our observations). Consequently, there was no radio core detection for 8 sample sources, uncertain optical identification for 6 sources, no identification for 4 sources with a core, and no redshift for 15 identified galaxies with mag.
In this Paper we (i) update the original sample presented in Paper I with the new data. These data include further radio core detections, related to that new identifications with a host optical object (usually a galaxy) and its photometry, spectroscopic redshifts for 4 galaxies with mag, and photometric redshift estimates for the faintest identified galaxies. We also (ii) report new VLA observations and present 4.9 GHz maps of the sample sources taken with the C-array or D-array configurations, and derive the sources’ polarisation parameters.
The detailed procedure and technique of the new optical and radio observations are described in Sect. 2. The deep optical images of the newly detected host galaxies, the long-slit optical spectra, the faint radio cores detected, and the 4.9-GHz total-intensity and polarised-intensity maps are shown in Sect. 3. The updated sample is given in Sect. 4. The radio maps are analysed, and the physical parameters, as well as the polarisation properties of the sample sources, are summarised in Sect. 5. Throughout this paper we use the cosmological constants =71km s-1Mpc-1 and =0.27. The assumption of these constants reduce the conventional giant-size limit of 1 Mpc to about 700 kpc.
2 New observations
2.1 Optical imaging and spectroscopy
Deep optical imaging and -band photometry of objects within three fields comprising a radio core region of the unidentified yet sample sources were conducted using the Asiago Astrophysical Observatory 1.8m telescope at Cima Ekar (Italy). The CCD frames were taken through the -band filter of the Kron-Cousins photometric system (Cousins 1976). Exposures of the two standard fields NGC 2419 and NGC 4147 (Christian et al. 1985) comprising standards up to mag were used for the magnitude calibration.
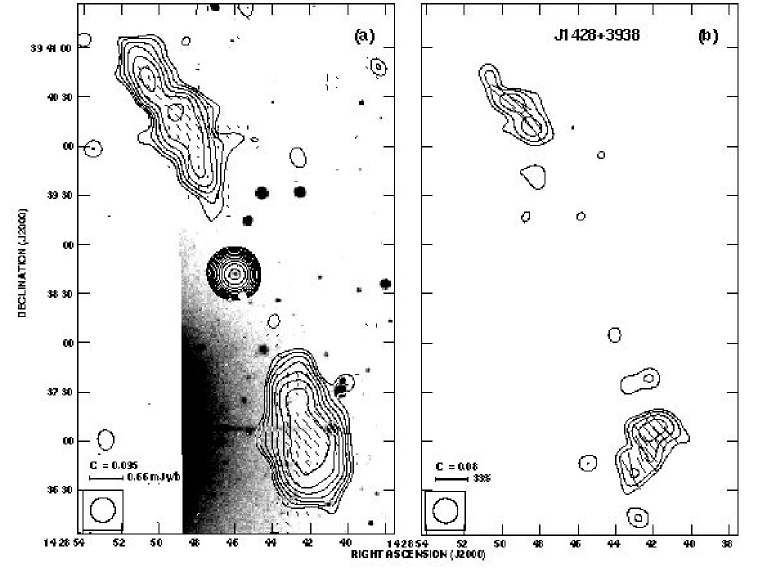
The astrometric calibration was done transforming the instrumental pixel coordinates of stars in the investigated frame into their sky coordinates in the DSS data base. Instrumental magnitudes of objects in the frames, reduced for bias, dark current, and flat field with the ESO MIDAS package, were determined using the aperture method. These instrumental magnitudes were then transformed into Cousins magnitudes, and their errors were determined in the manner described in Paper I. As a result, a host galaxy was detected and its apparent -band magnitude determined for the sources: J0725+3025, J0816+3347, and J1428+3938. These magnitudes and their errors are given in Sect. 3.1., and marked with bold-face in column 8 of Table 3.
To detect optical spectrum and determine redshifts of the identified galaxies that are fainter than about 18.5 mag in the -band, a large effort was made to get observing time at optical telescopes of the 3m class. Only for 6 of the 16 faint host galaxies, spectroscopic observations were conducted with the 3.5m telescope of the Apache Point Observatory (Texas) equipped with low-resolution two-sided spectrograph DIS-II and covering the spectral range of 3750–5600 Å(blue side) and 5500–9000 Å(red side). A wide slit was used, providing the dispersion of 3.15 Å pixel-1 and the spectral resolution of about 7 Å. The wavelength calibration was carried out using exposures to argon/neon/helium tube and flux density calibration by short exposures of a spectroscopic standard star close to the observed galaxy. The limited exposures of about 30 min were taken, which was sufficient to determine a redshift for galaxies with emission lines strong enough to be detected, but not for galaxies only with continuum emission and absorption bands (Chyży et al. (2005). Consequently, it was possible to determine the redshift of the 4 of 6 observed galaxies (cf. Table 3).
All the spectra obtained were reduced in the standard way, i.e. corrected for bias, dark current, and flat field, cleaned of cosmic rays, combined, and calibrated using the longslit package of the IRAF software. One-dimensional spectra were extracted interactively, using the observed intensity profile along the slit to define the apertures and sky-background regions.
2.2 VLA 4.9 GHz mapping and data reduction
Out of 36 sample sources 20 were observed with the VLA in the C-array or D-array at 4860 or 4885 MHz. The observing log is given in Table 1. The primary aim of the C-array observations was to detect faint radio cores. The D-array observations were used to map the extended lobes. For those sample sources with an angular size not exceeding 400, the field of view centred at a midpoint between the lobes was observed using integration times from 20 min up to over 180 min, depending on the average source’s brightness. Lobes of those sources extending more than 400 were observed separately. These integration times allowed us to reach rms noise values from about 20 Jy beam-1 to about 80 Jy beam-1. The interferometric phases were calibrated approximately every 20 min with the phase calibrator nearest to the observed source. The sources 3C 48, 3C 147, and 3C 286 were used as the primary flux density calibrators, with the last also serving as the polarisation calibrator.
The data were edited and calibrated using the NRAO aips software package. Corrections for the instrumental polarisation were determined for each antenna using consecutive observations of the phase calibrators made at several different hour angles. Polarisation position angles were measured relative to that of 3C286. The data were not corrected for ionospheric Faraday rotation, which could not be significant in the band. After completing the continuum and polarisation calibrations, the maps of the Stokes parameters , and were made and initially CLEANed with the task imagr. Usually several self-calibrations were performed to improve their quality. Then the maps were corrected for the primary-beam attenuation. Because of different original beam size, the maps were finally convolved to the common angular resolution of , , or .
The maps of linearly-polarised intensity and fractional polarisation were made by combining the and maps with the task comb. They allow determination of the polarised flux density at 4.9 GHz, , the mean fractional polarisation , and the mean polarisation angle (-vector) in the lobes of the sample sources. The analysis of the errors in the total-intensity and polarised-intensity flux densities, measured on these maps, is given in Sect. 5.2.
| Array | Project | Observation | Sources |
|---|---|---|---|
| date | |||
| D | AJ271 | 2000,Sept30 | J1343+3758(SW lobe) |
| C | AJ282 | 2001,July2 | J1604+3438, J1615+3826 |
| 2001,July13 | J1253+4041, J1330+3850 | ||
| D | AM743 | 2003,Feb20 | J0912+3510 |
| 2003,Feb25 | J1343+3758(NE lobe), | ||
| J1451+3357 | |||
| D | AM794 | 2004,June30 | J1428+3938, J1445+3051, |
| J1525+3345, J1554+3945, | |||
| J1555+3653, J1604+3731, | |||
| J1649+3114, J1712+3558, | |||
| J1725+3923 | |||
| D | 2004,July31 | J0720+2837, J0927+3510, | |
| J1113+4017, J1155+4041 |
3 Observational results
3.1 Deep optical images
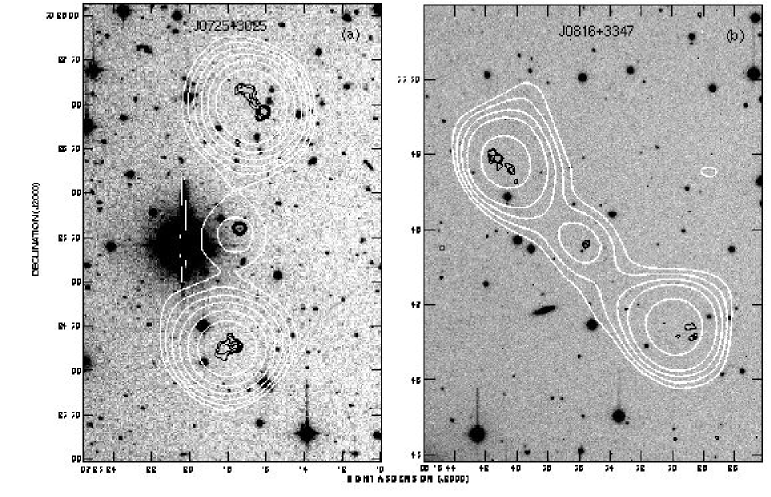
The deep optical images of the field around the sample sources J0725+3025 and J0816+3347 are shown in Figs. 1a, b. In the first of these sources, the =22.560.05 mag galaxy perfectly coincides with the radio core detected in the FIRST survey. The =20.290.04 mag object identified with the core of the second source is described in ‘Notes on individual sources’ in Table 3. The optical field around the source J1428+3938 and its =21.110.07 mag identification is shown in Fig. 10, where the new 4.9 GHz contour map is overlaid on it. In the fields around J0725+3025 and J1428+3938, the faint identified galaxies lie in short angular separation from very bright foreground stars.
3.2 Long-slit spectra
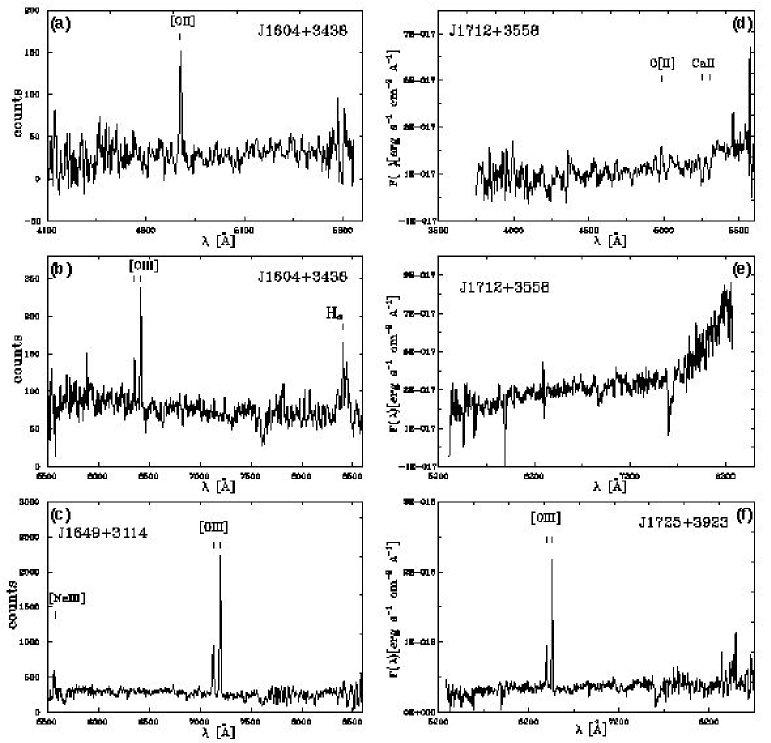
The one-dimensional spectra of the observed sample galaxies are shown in Fig. 2. Three of four spectra exhibit prominent emission lines: [OII]3727 and [OIII]4959 and 5007. The redshift determined for the galaxy J1712+3558 is based both on the absorption lines CaII3934 and 3968, and on a trace of the line [OII]3727. Preliminary spectra for the sources J1330+3850 and J1513+3841 show no emission lines, and their crude redshift (given in Table 3) is estimated from the shape of calibrated continuum compared by eye with the template spectrum of elliptical galaxies given by Kennicutt (1992).
3.3 The faint radio-core detection
| Source | RA(J2000) | Dec(J2000) | Deconv. size | RA | Dec | Notes222given in Sect. 2 | |
|---|---|---|---|---|---|---|---|
| [h m s] | [] | [mJy] | [] | [s] | [] | ||
| J0912+3510 | 09 12 51.95 | +35 10 14.1 | 0.240.04 | 1.01.0 | +0.14 | 2.0 | + |
| J0927+3510 | 09 27 50.13 | +35 10 48.8 | 0.150.06 | 12.01.0 | 0.45 | 1.7 | |
| J1253+4041 | 12 53 12.29 | +40 41 24.5 | 1.000.03 | 1.31.3 | +0.05 | +1.3 | |
| J1330+3050 | 13 30 36.19 | +38 50 19.8 | 0.640.09 | 4.83.9 | 0.14 | 0.1 | |
| J1604+3438 | 16 04 45.88 | +34 38 16.1 | 1.040.06 | 1.20.6 | 0.04 | 0.2 | + |
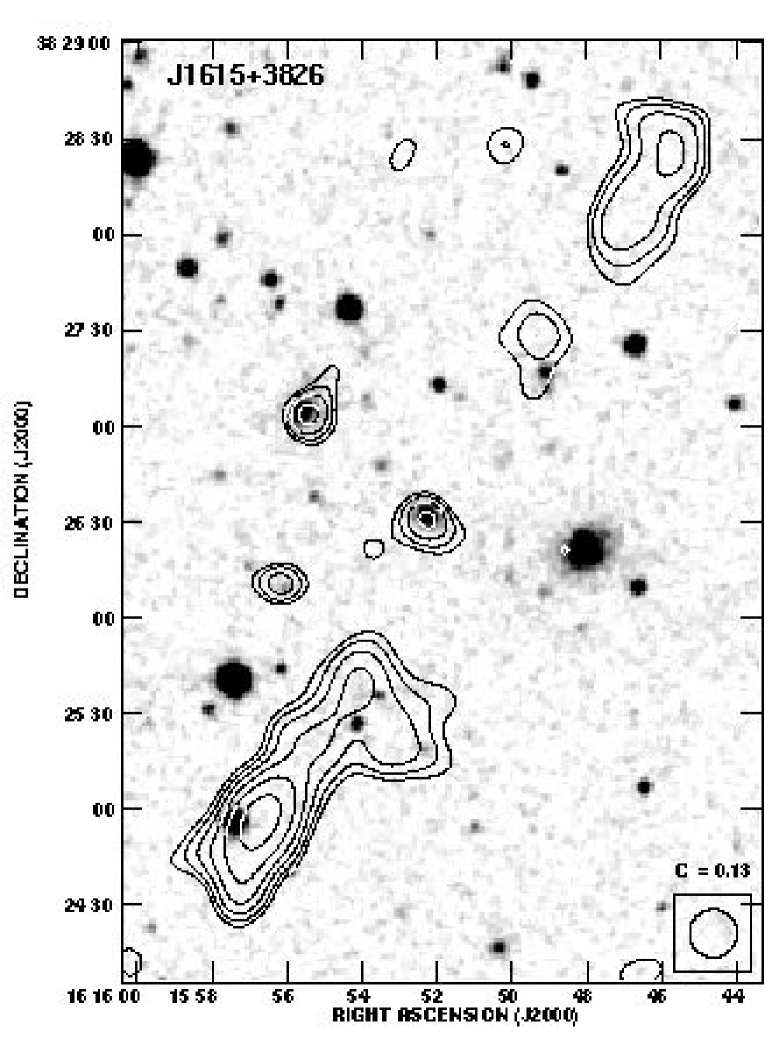
| J1615+3826 | 16 15 52.21 | +38 26 30.9 | 0.400.07 | 0.20.2 | 0.02 | 0.8 |
An effort was made to detect a faint radio core in distant sample sources, which was not achieved in Paper I, particularly for the sources unsuccessfully observed in the years 1997–2000, i.e. J0912+3510 and J0927+3510. The sky coordinates and the integrated flux density of the cores, newly detected in the radio maps presented in the next subsection, are given in Table 2. The RA and Dec give the radio-minus-optical offset with respect to the radio core.
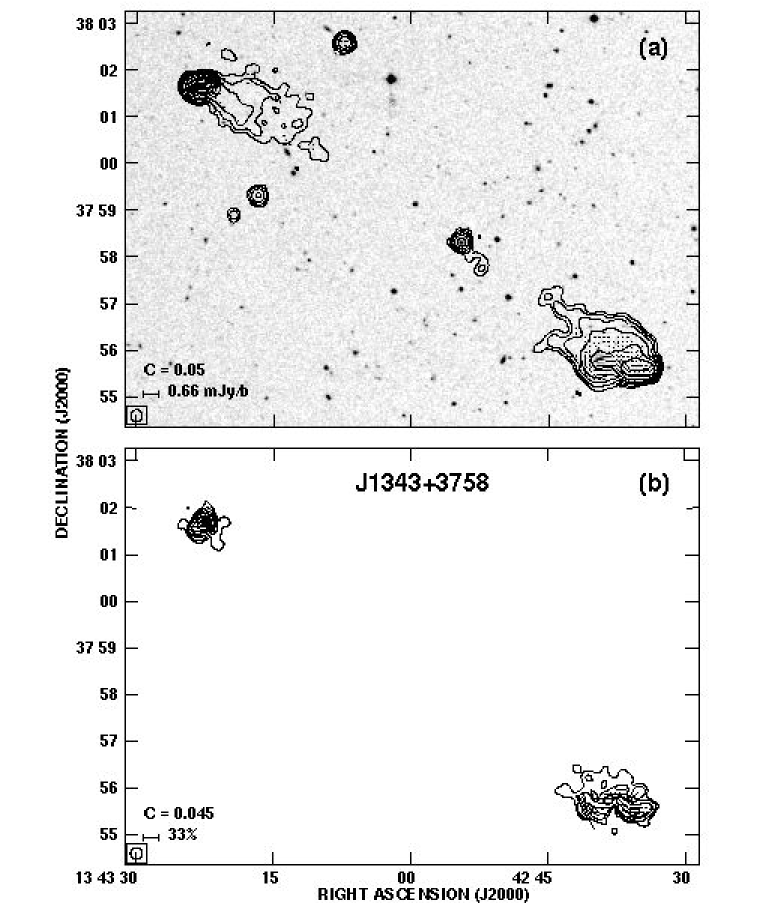
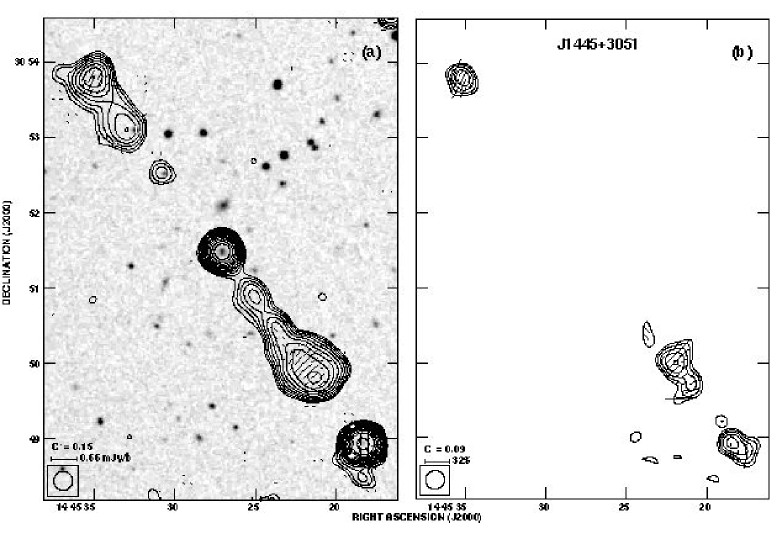
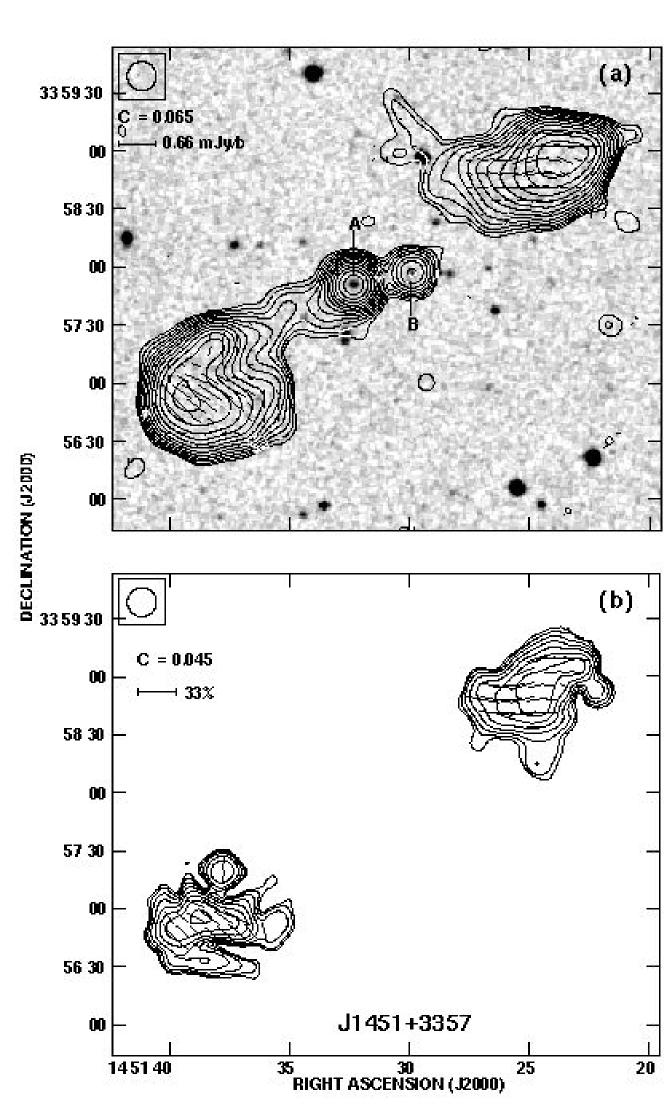
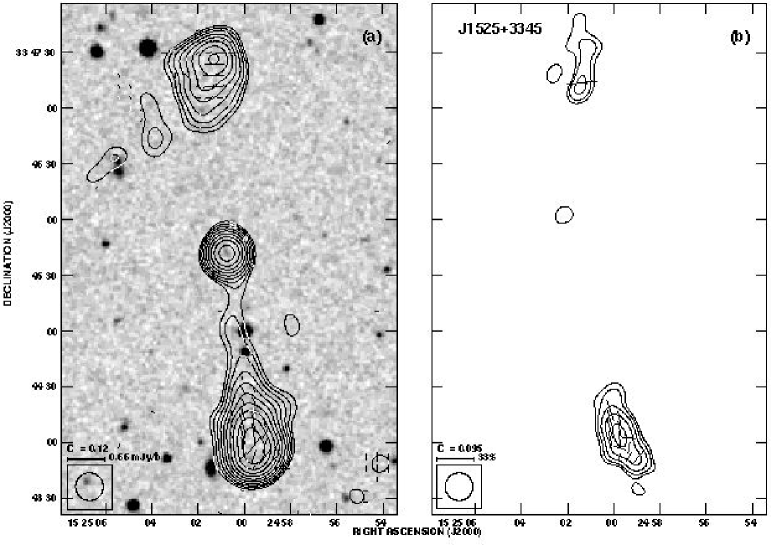
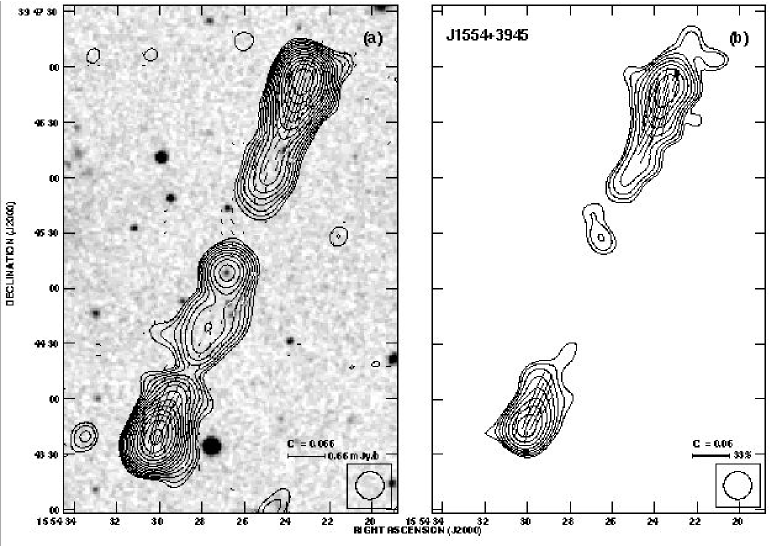
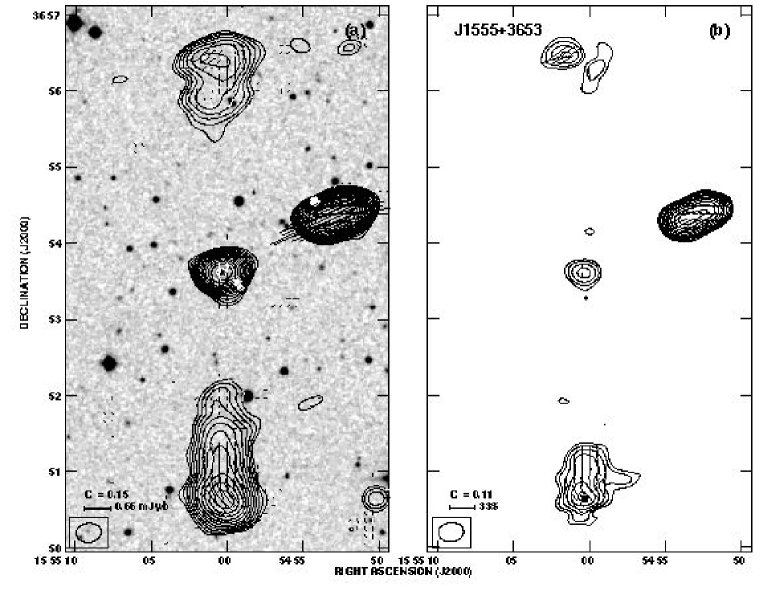
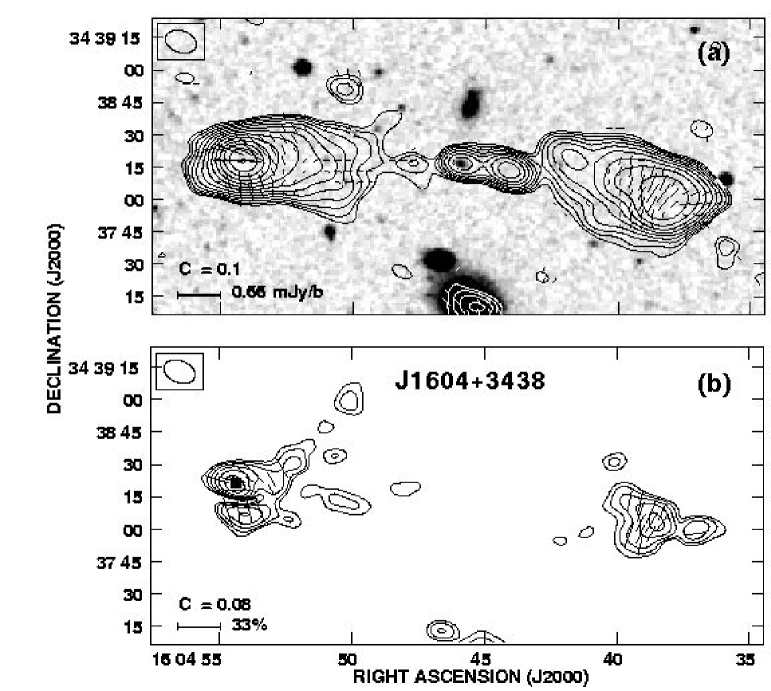
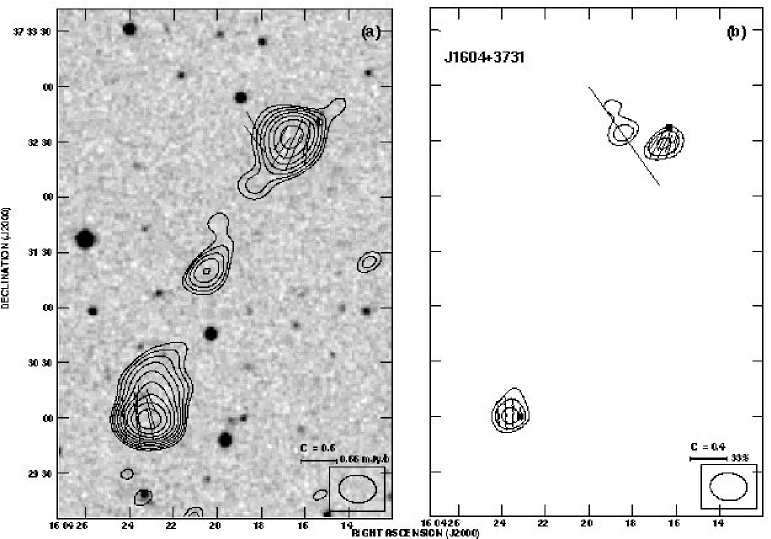
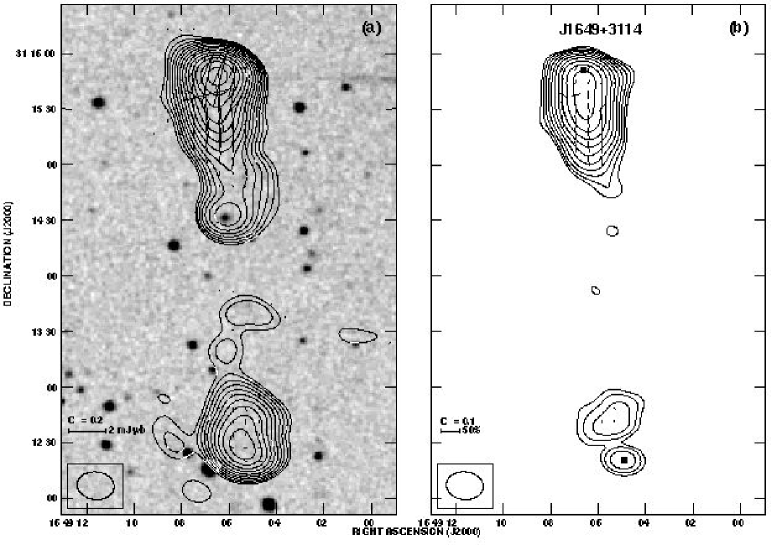
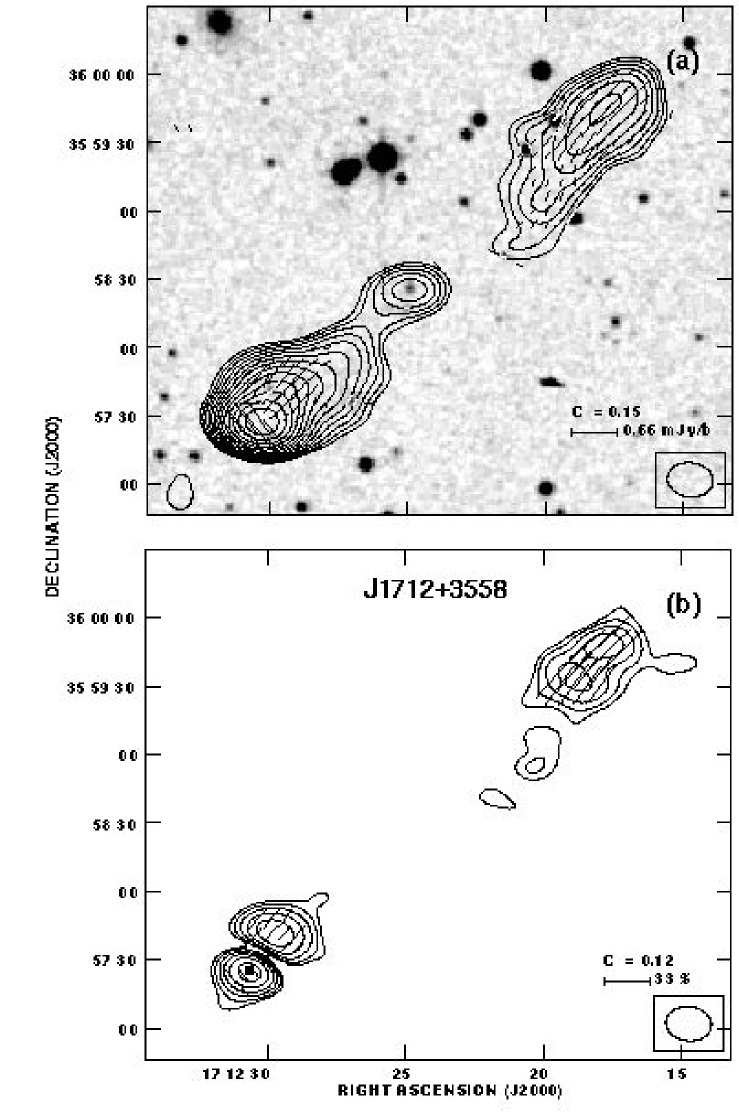
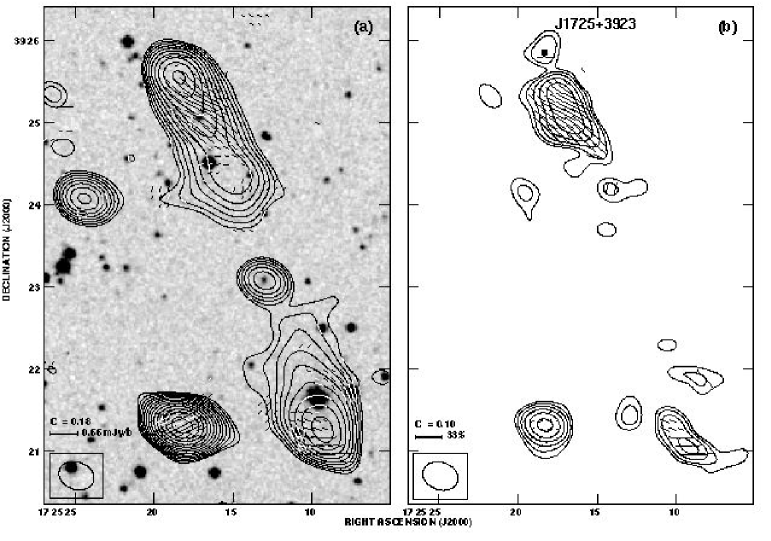
3.4 4.9 GHz total-intensity and polarised-intensity maps
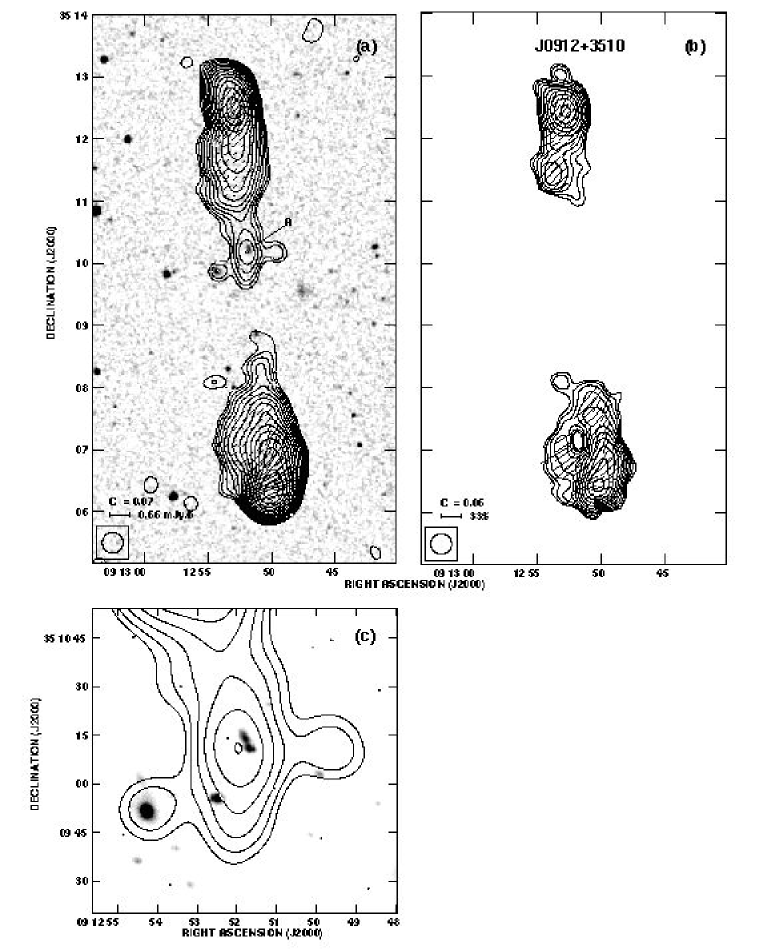
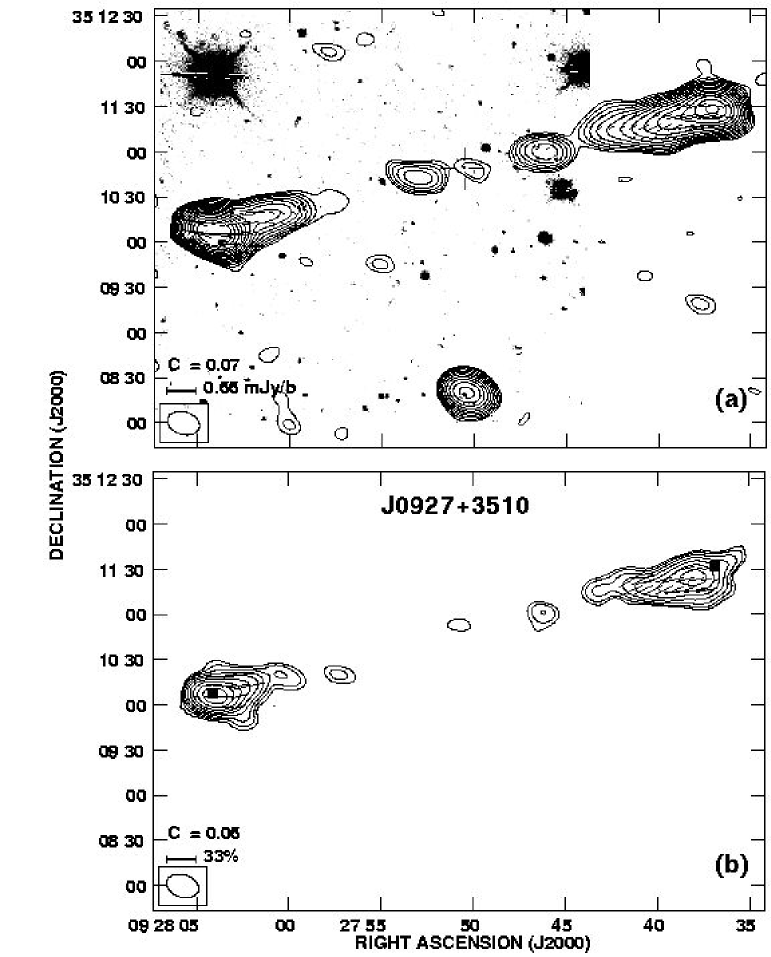
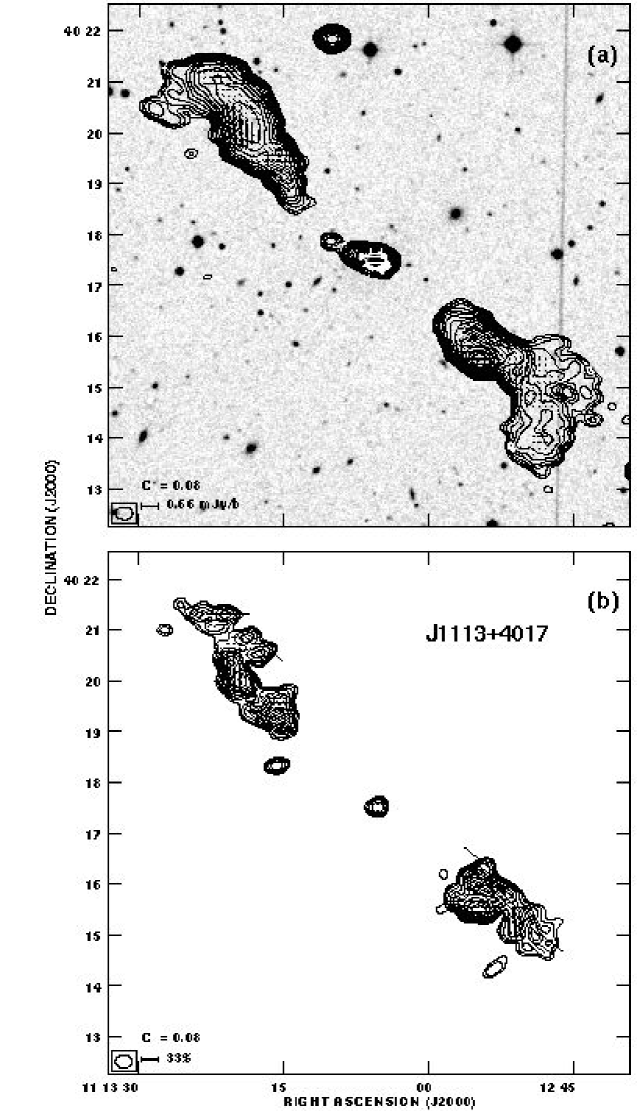
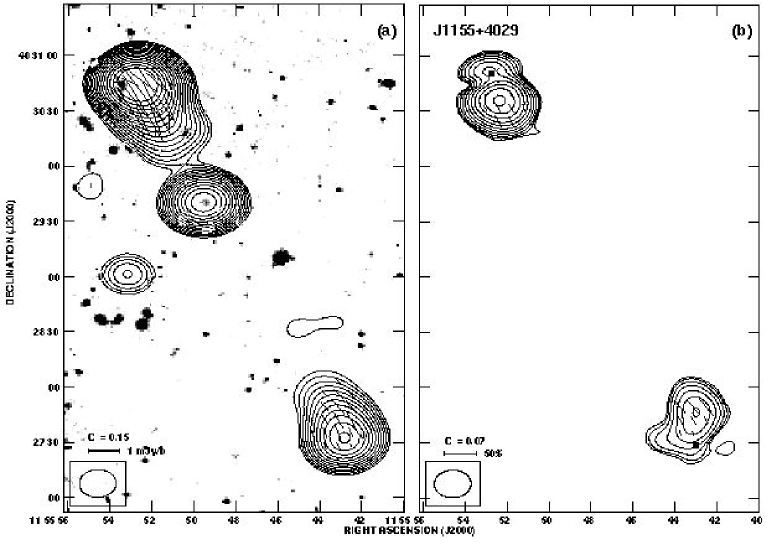
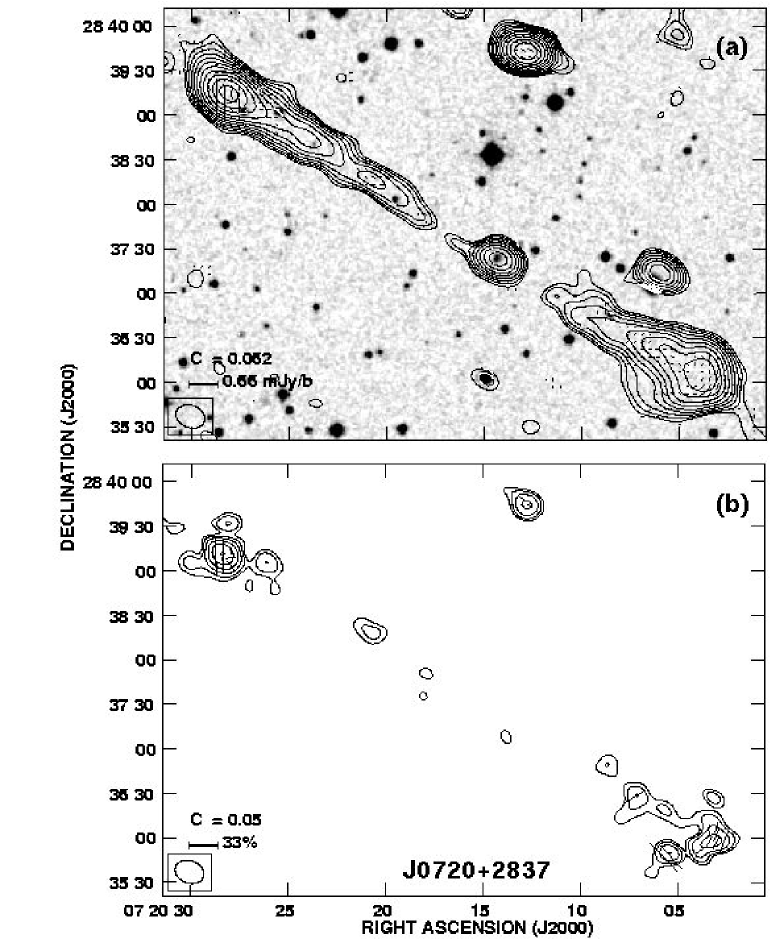
The VLA 4860 or 4885 MHz images of the sample sources observed are presented in Figs. 3 – 20. The total-intensity contour maps shown in panels (a) are overlaid onto the optical field taken either from the DSS data base or our own deep image (e.g. for J0927+3510, J1155+4029, and J1428+3938). Superimposed are -vectors (rotated by 90) of the linearly polarised emission with their length proportional to the polarised intensity . The contour maps of linearly polarised emission with the superimposed vectors of the fractional linear polarisation, , are shown in panels (b). The full squares in polarised-intensity maps indicate the positions of the evident hot spots. In Fig. 20 only the total-intensity map is shown for the source J1615+3826. It is the only sample source for which we could not determine any polarisation due to its very low surface brightness.
| IAU name | FR | LAS | opt. | Ref. | Notes | ||||||
|---|---|---|---|---|---|---|---|---|---|---|---|
| (J2000) | type | [mJy] | [mJy] | [”] | id. | [mag] | |||||
| J0720+2837 | II | 46 | 0.79 | 1.03 | 376 | 8.4 | G | 17.75 | 0.2705 | 1,6 | |
| J0725+3025 | II | 35 | 1.4 | 2.72 | 175 | 6.0 | G | 22.56 | (0.70) | 7 | |
| J0816+3347 | IID | 40 | 0.80 | 1.26 | 210 | 5.8 | ? | 20.29 | (0.42) | 7 | + |
| J0912+3510 | II | 161 | 0.90 | 0.24 | 375 | 9.4 | G | 19.35 | 0.2489 | 1,6 | + |
| J0927+3510 | II | 96 | 0.89 | 0.15 | 345 | 11.5 | G | 21.7 | (0.55) | 6,7 | + |
| J1011+3111 | II | 71 | 0.7 | 1.13 | 285 | 8.1 | G | 21.2 | (0.50) | 6,7 | |
| J1113+4017 | I/II | 249 | 0.75 | 15.2 | 646 | 11.1 | G | 14.56 | 0.0745 | 1,5 | |
| J1155+4029 | II | 323 | 1.00 | 13.7 | 229 | 13.5 | G | 21.5 | (0.53) | 6,7 | + |
| J1200+3449 | II | 227 | 1.01 | 0.36 | 147 | 8.6 | G | 21.2 | (0.50) | 6,7 | |
| J1253+4041 | IID | 52 | 0.6 | 1.00 | 275 | 5.7 | G | 17.27 | 0.2302 | 1,6 | + |
| J1254+2933 | II | 63 | 0.6 | 0.74 | 295 | 12.8 | G | 20.3 | (0.42) | 6,7 | |
| J1330+3850 | IID | 31 | 0.77 | 0.64 | 280 | 8.0 | G | 19.3 | 0.63? | 2,6 | + |
| J1343+3758 | II | 140 | 0.88 | 1.09 | 678 | 12.1 | G | 17.94 | 0.2267 | 1,6 | + |
| J1344+4028 | I/II | 209 | 0.76 | 22.0 | 450 | 6.8 | G | 14.92 | 0.0748 | 1,6 | + |
| J1345+3952 | II | 170 | 1.05 | 1.0 | 192 | 5.1 | G | 15.80 | 0.1611 | 1,6 | |
| J1355+2923 | II | 140 | 1.02 | 1.86 | 263 | 4.4 | G | 20.4 | (0.43) | 6,7 | |
| J1428+2918 | II | 448 | 1.04 | 12.8 | 905 | 7.9 | G | 13.0 | 0.0870 | 5 | |
| J1428+3938 | IID | 90 | 1.23 | 3.46 | 269 | 9.6 | G | 21.11 | (0.50) | 7 | |
| J1445+3051 | II | 97 | 0.90 | 10.9 | 300 | 8.1 | G | 19.0 | 0.42 | 4 | |
| J1451+3357 | II | 142 | 0.91 | 3.89 | 245 | 4.4 | G | 18.7 | 0.3251 | 6 | |
| J1453+3309 | II | 455 | 0.94 | 3.84 | 320 | 7.6 | G | 18.3 | 0.249 | 5 | |
| J1512+3050 | II | 107 | 0.64 | 5.4* | 240 | 5.3 | G | 15.98 | 0.0895 | 1,6 | |
| J1513+3841 | IID | 23 | 0.7 | 1.0 | 267 | 4.8 | G | 19.4 | 0.52? | 2,7 | + |
| J1525+3345 | IID | 51 | 0.83 | 2.41 | 215 | 5.4 | G | 20.9 | (0.47) | 6,7 | |
| J1526+3956 | II | 62 | 1.0 | ? | 536 | ? | … | …. | …. | ||
| J1554+3945 | II | 74 | 0.82 | 0.84 | 220 | 8.2 | G | 19.5 | (0.35) | 6,7 | |
| J1555+3653 | II | 106 | 0.94 | 15.5 | 349 | 8.1 | G | 18.56 | 0.2472 | 1,6 | |
| J1604+3438 | II | 146 | 0.95 | 1.04 | 200 | 5.0 | G | 18.8 | 0.2817 | 1,2 | + |
| J1604+3731 | II | 122 | 1.03 | 2.74 | 182 | 5.2 | G? | …. | 0.814 | 3 | + |
| J1615+3826 | IID | 34 | 0.77 | 0.40 | 264 | 6.9 | G | 17.59 | 0.1853 | 1,6 | + |
| J1632+3433 | II | 28 | 0.9 | 3.9* | 180 | 7.2 | … | …. | …. | ||
| J1635+3608 | I/II | 100 | 0.66 | 3.8* | 320 | 10.7 | G | 17.30 | 0.1655 | 1,6 | |
| J1649+3114 | II | 153 | 0.82 | 2.22 | 209 | 9.1 | G | 19.62 | 0.4373 | 1,2 | |
| J1651+3209 | I/II | 68 | 0.6 | 28.1* | 430 | ? | … | …. | …. | ||
| J1712+3558 | II | 87 | 0.76 | 0.55 | 211 | 7.5 | G | 19.1 | 0.3357 | 1,2 | |
| J1725+3923 | II | 88 | 0.91 | 1.08 | 288 | 6.9 | G | 18.76 | 0.2898 | 1,2 |
| References | |||
| (1) | Digitized Sky Survey (DSS) | (5) | Schoenmakers et al. (2001) |
| (2) | Chyży et al. (2005) | (6) | Paper I |
| (3) | Cotter et al. (1996) | (7) | this paper |
| (4) | Hook et al. (1998) |
4 The updated sample
The update of the sample is presented in Table 3 where the updated entries and new data are marked in bold face. The consecutive columns give:
Column 1: IAU name at epoch J2000.
Column 2: Fanaroff-Riley morphological type. ‘D’ indicates a diffuse morphology of the radio lobes without any detectable hot spot(s).
Column 3: 1.4 GHz total flux density in mJy.
Column 4: Radio spectral index between 325 and 4860 MHz.
Column 5: Flux density of the radio core determined at 5 GHz. The values available only at 1.4 GHz are marked with asterisks.
Column 6: Largest angular size in arcsec.
Column 7: Axial ratio of the source measured as the ratio between the largest angular size (cf. column 6) and the average of the full width of its two lobes. The latter is determined as the deconvolved width of the transversal cross-section through the lobes measured between 3 total-intensity contours half-way between the core and the outer edge of the source.
Column 8: Optical identification.
Column 9: Apparent -band magnitude of the identified host optical object taken from the reference given in Col. 10.
Column 10: Redshift of the host object (galaxy). The value in parenthesis is the photometric redshift estimate based on the assumption that the host optical counterpart is a galaxy with = (cf. Paper I).
Column 11: References to the optical magnitude and redshift.
Column 12: Notes about individual sample sources (given below).
Notes on individual sources in Table 3:
J0816+3347: The radio core coincides with a very blue object in the POSS1 (=; ). Our photometry in March 2000 gave , and in Dec. 2004. The blue colour and a probable optical variability may suggest a QSO, however the diffused radio lobes and the low-brightness bridge evident in the NVSS map (cf. Fig. 1b) are typical for radio galaxies.
J0912+3510: The detected compact core is 2.6 from the identified galaxy (cf. Table 2). This identification and the measured redshift of 0.2489 may not be certain due to a poor coincidence with the radio core and the fact that the object visible in the DSS field (marked with ”A” in Fig. 4a) appears to be a close pair of galaxies that can be unrelated. Figure 4c shows the deep direct image taken with the McDonald 2.1m telescope. The two galaxies are separated by about , while the optical spectrum was measured through the slit (cf. Paper I), therefore there is some doubt as to which galaxy was actually measured due to a limited telescope-pointing accuracy of about 2–3.
J0927+3510: Possibly of a double-double morphology. The two inner components (cf. Fig. 5a) surround the faintest core detected among the sample sources. Their brightness peaks at the positions of ; and ; determined from the VLA 8.46 GHz map. The outer, much brighter lobes are terminated by hot spots clearly visible in that map shown in Paper I.
J1155+4029: Extremely large flux-density ratio between the two lobes measured at four frequencies [325 MHz: WENSS (Rengelink et al. 1997); 408: B3 (Ficarra et al. 1985); 1400 MHz: NVSS (Condon et al. 1998); and 4860 MHz: this paper] and the characteristic inverse ratio of the lobes’ separation may suggest a less than 90 inclination angle of this source to the observer line.
J1253+4041: The detected radio core (cf. Table 2) confirms the optical identification given in Paper I.
J1330+3850: The detected radio core (cf. Table 2) coincides perfectly with the 19.3 mag galaxy, the certain host galaxy of this large source with strongly diffused lobes. Its redshift as suggested by Chyży et al. (2005) remains uncertain because no evident emission lines were detected in the optical spectrum.
J1343+3758: This source has been analysed in detail by Jamrozy et al. (2005) where its synchrotron and dynamical ages are determined, and a number of physical parameters derived.
J1344+4027: This extended double source of FRI/II-type morphology is badly confused by a strong background FRII-type source.
J1513+3841: The redshift is uncertain for the same reason as that in J1330+3850.
J1604+3438: Possibly of a double-double morphology.
J1604+3731: The 613 MH GMRT map of this source has recently been published by Konar et al. (2004).
J1615+3826: The radio core detected (cf. Table 2) confirms the optical identification given in Paper I.
5 Analysis of radio maps
5.1 Physical parameters derived from the data
The NVSS, FIRST, and our VLA maps are used to determine the basic physical parameters of the sample sources. These parameters are given in Table 4; their value, which is less certain because of the preliminary photometric redshift estimate, is marked with asterisk.
| Source | log | log | |||||||
|---|---|---|---|---|---|---|---|---|---|
| [kpc] | [W Hz-1] | [W Hz-1] | [nT] | [J m-3] | [J] | ||||
| J0720+2837 | 24.99 | 23.26 | 0.018 | 0.58 | 0.092 | 0.79 | 0.95 | 5.57 | |
| J0725+3025 | 1246* | 25.9* | 24.5* | 0.045 | 2.88 | 0.190 | 3.34 | 4.09 | 4.84 |
| J0816+3347 | 1155* | 25.4* | 23.7* | 0.024 | 0.91 | 0.155 | 2.24 | 2.36 | 4.13 |
| J0912+3510 | 25.46 | 22.55 | 0.001 | 0.06 | 0.162 | 2.43 | 1.92 | 3.06 | |
| J0927+3510 | 2200* | 26.0* | 23.1* | 0.001 | 0.09 | 0.153 | 2.18 | 4.09 | 4.98 |
| J1011+3111 | 1740* | 25.8* | 23.9* | 0.012 | 0.83 | 0.134 | 1.67 | 3.02 | 5.33 |
| J1113+4017 | 24.49 | 23.2 | 0.058 | 1.01 | 0.113 | 1.18 | 3.05 | 3.25 | |
| J1155+4029 | 1440* | 26.5* | 24.9* | 0.028 | 3.16 | 0.487 | 22.0 | 8.30 | 1.53 |
| J1200+3449 | 890* | 26.3* | 23.3* | 0.001 | 0.10 | 0.473 | 20.8 | 4.57 | 1.51 |
| J1253+4041 | 24.86 | 23.09 | 0.017 | 0.47 | 0.098 | 0.89 | 0.62 | 4.93 | |
| J1254+2933 | 1630* | 25.5* | 23.5* | 0.009 | 0.50 | 0.161 | 2.42 | 1.46 | 3.97 |
| J1330+3850 | 25.67 | 23.80 | 0.014 | 0.79 | 0.148 | 2.03 | 5.10 | 5.71 | |
| J1343+3758 | 25.30 | 23.12 | 0.007 | 0.28 | 0.103 | 0.99 | 2.23 | 4.63 | |
| J1344+4028 | 24.42 | 23.42 | 0.100 | 0.128 | 1.51 | 0.19 | 2.88 | ||
| J1345+3952 | 25.06 | 22.8 | 0.005 | 0.18 | 0.196 | 3.57 | 0.45 | 2.19 | |
| J1355+2923 | 25.97 | 23.94 | 0.009 | 0.72 | 0.152 | 2.15 | 1.98 | 4.27 | |
| J1428+2918 | 24.89 | 23.31 | 0.026 | 0.75 | 0.089 | 0.73 | 0.77 | 4.23 | |
| J1428+3938 | 1630* | 26.0* | 24.4* | 0.023 | 1.99 | 0.272 | 6.84 | 7.46 | 2.64 |
| J1445+3051 | 25.77 | 24.69 | 0.083 | 5.35 | 0.140 | 1.82 | 2.88 | 4.58 | |
| J1451+3357 | 25.68 | 24.00 | 0.021 | 1.24 | 0.143 | 1.89 | 3.44 | 3.92 | |
| J1453+3309 | 25.92 | 23.75 | 0.007 | 0.51 | 0.199 | 3.68 | 2.78 | 2.49 | |
| J1512+3050 | 24.32 | 23.00 | 0.048 | 0.81 | 0.129 | 1.54 | 0.08 | 2.93 | |
| J1513+3841 | 25.33 | 23.8 | 0.032 | 1.26 | 0.096 | 0.85 | 3.90 | 7.69 | |
| J1525+3345 | 1260* | 25.6* | 24.1* | 0.032 | 1.74 | 0.145 | 1.95 | 3.14 | 4.74 |
| J1554+3945 | 1080* | 25.5* | 23.4* | 0.009 | 0.41 | 0.173 | 2.76 | 1.22 | 3.36 |
| J1555+3653 | 25.28 | 24.35 | 0.117 | 4.81 | 0.139 | 1.80 | 1.50 | 3.55 | |
| J1604+3438 | 25.55 | 23.30 | 0.006 | 0.29 | 0.182 | 3.07 | 1.71 | 2.87 | |
| J1604+3731 | 26.59 | 24.67 | 0.012 | 1.64 | 0.272 | 6.85 | 15.2 | 3.85 | |
| J1615+3826 | 24.49 | 22.50 | 0.010 | 0.20 | 0.097 | 0.87 | 0.22 | 4.62 | |
| J1635+3608 | 24.83 | 23.38 | 0.036 | 0.96 | 0.180 | 3.02 | 0.36 | 2.48 | |
| J1649+3114 | 26.00 | 24.03 | 0.011 | 0.85 | 0.278 | 7.19 | 3.30 | 2.36 | |
| J1712+3558 | 25.48 | 23.18 | 0.005 | 0.25 | 0.184 | 3.14 | 1.33 | 3.08 | |
| J1725+3923 | 25.35 | 23.33 | 0.010 | 0.42 | 0.132 | 1.62 | 1.53 | 4.01 |
After the source name (column 1), the subsequent columns are:
Column 2: Projected linear size calculated with =71 km s-1Mpc-1 and =0.27. These values of cosmological constants cause a reduction in size for most sample sources with respect to their value of Mpc determined with =50 km s-1Mpc-1, as used in most previously published papers.
Column 3: Logarithm of total radio power at the emitted frequency of 1.4 GHz calculated using the cosmological constants as in Col. 2.
Column 4: Logarithm of the core power at the emitted frequency of 4.9 GHz.
Column 5: Core prominence defined as .
Column 6: Source axis orientation indicator defined as the ratio between the observed core luminosity, , and its value expected from the statistical relation of Giovannini et al. (2001), scaled here from their original 408 MHz total power to the total power at 1.4 GHz assuming a spectral index of 0.75, and transformed to the cosmological constants adopted in this Paper: .
Column 7: Average magnetic field strength, , calculated using the formula of Miley (1980), i.e. under assumption of energy equipartition, a cylindrical geometry of the extended emission with the base diameter equal to the average width of the lobes, usually measured half-way between the core and the brightest regions, using the prescription of Leahy & Williams (1984), a filling factor of unity, and the equipartition of kinetic energy between relativistic electrons and protons. The total radio luminosity is integrated from 10 MHz to 100 GHz.
Column 8: Minimum energy density, , calculated under the same assumptions.
Column 9: Total energy contained in the source, i.e. the minimum energy density times the volume of the source’s cocoon.
Column 10: Ratio of the equivalent magnetic field strength of the microwave background radiation, =0.318(1+)2[nT], to the equipartition magnetic field .
5.2 Fractional polarisation, depolarisation, and rotation measures
| Source | Lobe closer to the core | Lobe farther to the core |
|---|
| lobe | DP | RM | lobe | DP | RM | |||||
|---|---|---|---|---|---|---|---|---|---|---|
| [%] | [] | [rad m-2] | [%] | [] | [rad m-2] | |||||
| J0720+2837 | SW | 4.72.5 | +3627 | NE | 4.42.1 | 4434 | ||||
| J0912+3510 | N | 18.52.6 | +448 | 1.110.19 | +157 | S | 17.91.6 | +409 | 0.900.11 | +137 |
| J0927+3510 | E | 12.11.6 | 66 | 1.140.21 | +69 | W | 16.12.3 | +118 | 1.340.26 | +128 |
| J1113+4017 | NE | 13.71.0 | 275 | 1.490.15 | +116 | SW | 19.51.2 | 336 | 1.030.12 | +65 |
| J1155+4029 | N | 3.00.4 | 3616 | 1.050.17 | 17 | S | 8.21.9 | 4911 | ||
| J1343+3758 | N | 15.91.4 | 19 | 1.150.21 | +25 | S | 7.10.7 | 57 | 1.870.29 | 08 |
| J1428+3938 | S | 14.72.6 | 4213 | 1.290.25 | 38 | N | 24.04.8 | 4616 | 0.830.22 | 210 |
| J1445+3051 | S | 5.71.3 | +2413 | N | 11.72.8 | +5511 | ||||
| J1451+3357 | SE | 6.51.0 | 327 | 0.960.26 | +29 | NW | 13.01.2 | +127 | 0.960.15 | +37 |
| J1525+3345 | N | 5.35.0 | +1413 | S | 5.82.3 | 4025 | ||||
| J1554+3945 | S | 12.72.0 | +6015 | 1.020.25 | 86 | N | 18.92.2 | +675 | 0.950.18 | 26 |
| J1555+3653 | N | 6.82.6 | 824 | S | 10.01.2 | 3824 | 0.720.24 | +27 | ||
| J1604+3438 | E | 7.92.0 | 1810 | W | 8.12.2 | +3818 | ||||
| J1604+3731 | S | 8.52.9 | 6518 | N | 9.33.6 | +3517 | ||||
| J1649+3114 | N | 16.90.8 | 311 | 1.040.08 | +187 | S | 3.51.7 | 5618 | ||
| J1712+3558 | S | 5.21.1 | 830 | 1.110.32 | +137 | N | 32.65.9 | +459 | 0.780.23 | +148 |
| J1725+3923 | S | 6.42.0 | 1517 | N | 7.61.6 | 1716 | 1.750.49 | 811 |
To determine the crude values of depolarisation and rotation measures for the sample sources whose 4.9 GHz maps are shown in Figs. 3 – 19, we use the commonly available 1.4 GHz NVSS maps of the Stokes parameters. For each of those sources, the areas comprising the detected emission of their two lobes were determined on the Stokes map, and pixels outside the lobe area with the total intensity flux less than 3 were blanked. Because NVSS maps have a lower angular resolution than our maps, we first convolved the original 4.9 GHz VLA maps with the NVSS beam of 45. The 1.4 and 4.9 GHz maps were centred to the same sky position with the task hgeom, and for the sample sources with the compact core detected at both frequencies (at 1.4 GHz: in the FIRST), the alignment was also checked using the core position. Next, for each of the analysed sources, a rectangular area (box) was chosen around its two lobes, and the integrated value of and the mean polarisation angle were measured within each box using the maps of fractional polarisation and polarisation angle, again made with the task comb.
The mean values of the fractional polarisation for each lobe is determined as
and the associated position angle is for =1.4, 4.9 GHz. Note that the primed symbols indicate parameters whose values are determined from the convolved maps. We define the depolarisation measure as the ratio
although this frequently used definition implies an increasing depolarisation if the value decreases. According to the simple models of the ‘Faraday-thin’ screens (e.g. Laing 1984), the resulting low depolarisation of the sample members (; cf. Table 5) implies that the difference between the rotation angles is always less than 90. This allows us to calculate the Faraday rotation measure necessary to determine the intrinsic polarisation angle in the sample sources. The two-point rotation measure is calculated as the ratio
The error in total flux density is calculated as
where is the rms noise of the total-intensity map, and is the integration area in units of the beam solid angle. The value of rms noise for 1.4 GHz, =0.45 mJy beam-1, is taken from Condon et al. (1998), while its value for 4.9 GHz is measured in the particular VLA map. The errors in polarised flux density and fractional polarisation are calculated as
where for . The rms noise in polarised flux density at 1.4 GHz, mJy beam-1, again is taken from Condon et al., and its value for 4.9 GHz is measured in the particular VLA and maps, and
The dispersion of the polarisation angle, , is determined from the original (not convolved) polarisation angle maps by
where the sum is taken over map pixels. A similar formula is used to determine the dispersion of the polarisation angles, and , which are measured in the convolved polarisation angle maps.
The polarisation parameters determined here for the lobe closer to the radio core, and farther off the core of the analysed sources are given in Table 5 as follows:
Column 1: IAU name at epoch J2000.
Columns 2 and 7: Lobe designation.
Columns 3 and 8: Fractional polarisation at 4.9 GHz measured on the original map with its error.
Columns 4 and 9: Mean polarisation angle at 4.9 GHz measured on the original map with its dispersion.
Columns 5 and 10: Depolarisation measure with error.
Columns 6 and 11: Rotation measure with error in rad/m2.
The data in Table 5 show that depolarisation of the lobe emission in the sample sources, in our case the giant radio galaxies, is extremely low. Though some values are formally much greater than unity, their uncertainty is also high due to usually very low flux densities in the polarised-intensity maps. The median value for 20 lobes is 1.040.05; i.e. it is close to unity. Also, the values suggest that the Faraday rotations of the polarisation planes are mild.
The maps in Figs. 3 – 19 show that the dominant position angles of the magnetic fields in the lobes are close to those of the main axes of the sample sources. The only exception to this behaviour can be seen in the sources J0912+3510 and J1445+3051, where the angle between the mean direction of magnetic fields and the source’s axis is larger than 45. In the sources with twisted lobes (e.g. J1113+4017; J1451+3357), the direction, i.e. the magnetic field projected vectors, seems to follow bends in the lobe structures. In most of our maps, the hot spots are not resolved from the lobes, and their emission is strongly depolarised in the beam. However, if they are resolved out (e.g. in J1343+3758; J1712+3558), the mean direction of the magnetic fields tends to be almost transversal to the source’s axes.
6 Comparison with other samples
In this section we compare some statistical characteristics of our sample with relevant characteristics that can be derived for other samples of giant radio sources. The main characteristics are: distributions of the redshift, projected linear size, and monochromatic radio power. A simple one-figure presentation of these distributions is the radio power vs. intrinsic size relation ( diagram). In Fig. 21 we plot this diagram for the sources selected from the samples of Lara et al. (2001), Schoenmakers et al. (2001), Machalski et al. (2001), and Saripalli et al. (2005), i.e. limited to the sample members of FRII-type or FRI/II-type morphology and having spectroscopic redshift, or its reliable photometric estimate. We determine the radio power at the frequency of 1.4 GHz using flux densities published in the original Lara et al.’s and Schoenmakers et al.’s papers (mostly NVSS flux densities), and the ones in Table 3 for our sample. For the Saripalli et al.’s sample, the power is calculated by transforming original 843-MHz flux densities into 1.4 GHz ones, assuming a mean spectral index .
Since our sample was selected in the same way as the samples of Lara et al. and Schoenmakers et al., the selection effects are very similar to those described and discussed in the above papers. The only differences were values of the selection limits for the minimum angular size and minimum of 1.4 GHz flux density. The Saripalli et al.’s sample, though selected at another observing frequency, has a limiting flux density comparable to those for the above two samples. The dashed curved line in Fig. 21 indicates the position of a source with the total flux density of 30 mJy at 1.4 GHz and the angular size of 6 arc min, as a function of the source’s redshift. An area below this curve is the part of the diagram in which sources cannot be selected due to the sensitivity limit of the finding surveys (WENSS, NVSS, SUMSS). The largest giant sources known, e.g. B2147+816, SGRS J0331-7710, and J1343+3758 (in the diagram), as well as 3C236 (out of the diagram), lie within the above area due to their angular sizes being significantly larger than 6 arc min.
The statistical characteristics of the four samples are given in Table 6. They are limited to their members with FRII or FRI/II morphology, with spectroscopic redshift or its photometric estimate, and to those larger than 700 kpc. The consecutive columns give:
Column 1: The sample.
Column 2: Sky area of the sample in sr.
Column 3: Number of sources fulfilling the above restrictions.
Column 4: Angular size limit in arc min.
Column 5: Approximate 1.4-GHz flux density limit in mJy.
Column 6: Median redshift.
Column 7: Redshift mean deviation.
Column 8: Median linear size in Mpc.
Column 9: Size mean deviation in Mpc.
Column 10: Median logarithm of 1.4-GHz power in W Hz-1.
Column 11: Logarithm of power mean deviation in W Hz-1.
| Sample | A | N | Median z | MDz | Median D | MDD | Median log | MDP | ||
|---|---|---|---|---|---|---|---|---|---|---|
| [sr] | [] | [mJy] | [Mpc] | [Mpc] | [W Hz-1] | [W Hz-1] | ||||
| Schoenmakers et al. | – | 22 | 5 | 100 | 0.160.02 | 0.06 | 1.140.10 | 0.32 | 25.180.16 | 0.47 |
| Lara et al. | 0.84 | 29 | 4 | 100 | 0.210.02 | 0.11 | 1.070.08 | 0.64 | 25.590.15 | 0.42 |
| Saripalli et al. | 0.64 | 15 | 5 | 100 | 0.250.03 | 0.08 | 1.520.21 | 0.52 | 25.610.13 | 0.38 |
| our | 0.47 | 31 | 3 | 30 | 0.380.07 | 0.14 | 1.300.09 | 0.30 | 25.520.10 | 0.40 |
The data in Table 6 imply that:
– All the four samples probe a same part of the population of extragalactic radio sources, especially as regards the range of radio power. There is practically no difference in the median deviations of 1.4-GHz power, though the median power in the Schoenmakers et al.’s sample is about 2.5 times lower than those in the remaining three samples.
– The intrinsic size distributions in all the samples are comparable, so the differences in the size mean deviations are not statistically significant.
– The lower limiting angular size and flux density in our sample result in detections of more distant radio sources (the highest median redshift) than those detected in the other samples.
Thus, we conclude that a search for giant candidates, among radio sources smaller than 4 arc min and with the 1.4-GHz flux density lower than 100 mJy, can result in detections of the most distant giant-size sources. In turn, their studies can shed more light on the problems of the intergalactic medium (IGM) homogeneity, its cosmological evolution, voids, etc.
Acknowledgements.
The authors acknowledge (i) the National Radio Astronomy Observatory (NRAO) (Socorro, NM) and Barry Clark for the target-of-opportunity observing time. NRAO is operated by Associated Universities, Inc., and is a facility of the National Science Foundation (NSF), (ii) the Asiago Astrophysical Observatory (Cima Ekar, Italy) and the Apache Point Observatory (TX) for the observing time, and (iii) the Space Telescope Science Institute for the use of the Digitized Sky Surveys (DSS) data base. This work was supported in part by the State with funding for scientific research in years 2005-2007 under contract No. 0425/PO3/2005/29.References
- (1) Becker, R.H., White, R.L., Helfand, D.J., 1995, ApJ, 450, 559 (FIRST)
- (2) Blundell, K.M., Rawlings, S., Willott, C.J., 1999, AJ, 117, 766
- (3) Bock, D.C.J., Large, M.I., Sadler, E.M., 1999, AJ, 117, 1578
- (4) Christian, C.A., Adams, M., Butcher, H., et al., 1985, PASP, 97, 363
- (5) Chyży, K.T., Jamrozy, M., Kleinman, S.J., et al., 2005, Baltic Astr, 14, 358
- (6) Condon, J.J., Cotton, W.D., Greisen, E.W., et al., 1998, AJ, 115, 1693 (NVSS)
- (7) Cotter, G., Rawlings, S., Saunders, R., 1996, MNRAS, 281, 1081
- (8) Cousins, A.W.J., 1976, MNRAS, 81,25
- (9) Fanaroff, B.L. & Riley, J.M., 1974, MNRAS, 167, 31P
- (10) Ficarra, A., Gruef, G., Tomassetti, G., 1985, A&AS, 59, 255
- (11) Giovannini, G., Cotton, W.D., Feretti, L., et al., 2001, ApJ, 552, 508
- (12) Hook, I.M., Becker, R.H., McMahon, R.G., White, R.L., 1998, MNRAS, 297, 1115
- (13) Jamrozy, M., Machalski, J., Mack, K.-H., Klein, U., 2005, A&A, 433, 467
- (14) Kaiser, C.R., Dennett-Thorpe, J. & Alexander, P., 1997, MNRAS, 292, 723
- (15) Kennicutt, R.C., 1992, ApJS, 79, 255
- (16) Konar, C., Saikia, D.J., Ishwara-Chandra, C.H., Kulkarni, V.K., 2004, MNRAS, 355, 845
- (17) Kronberg, P.P., Colgate, S.A., Li, H., Dufton, Q.W., 2004, ApJ, 604, L77
- (18) Laing, R.A., 1984, in ‘Physics of Energy Transport in Extragalactic Radio Sources’, Green Bank (NRAO), eds.: Bridle, A.H. & Eilek, J.A., p. 90
- (19) Lara, L., Cotton, W.D., Feretti, L., et al., 2001, A&A, 370, 409
- (20) Leahy, J.P. & Williams, A.G., 1984, MNRAS, 210, 929
- (21) Machalski, J., Jamrozy, M., Zola, S., 2001, A&A, 371, 445 (Paper I)
- (22) Manolakou, K. & Kirk, J.G., 2002, A&A, 391, 127
- (23) Miley, G.K., 1980, ARA&A, 18, 185
- (24) Rengelink, R.B., Tang, Y., de Bruyn, A.G., et al., 1997, A&AS, 124, 259 (WENSS)
- (25) Saripalli, L., Hunstead, R.W., Subrahmanyan, R., Boyce, E., 2005, AJ, 130, 896
- (26) Schoenmakers, A.P., de Bruyn, A.G., Röttgering, H.J.A., van der Laan, H., 2001, A&A, 374, 861