Evidence for TP-AGB stars in high redshift galaxies, and their effect on deriving stellar population parameters
Abstract
We explore the effects of stellar population models on estimating star formation histories, ages and masses of high redshift galaxies. The focus is on the Thermally-Pulsing Asymptotic Giant Branch (TP-AGB) phase of stellar evolution, whose treatment is a source of major discrepancy among different evolutionary population synthesis. In particular, besides the models usually adopted in the literature, we use models (by Maraston 2005), in which the contribution of the TP-AGB phase is calibrated with local stellar populations and is the dominant source of bolometric and near-IR energy for stellar populations in the age range 0.2 to 2 Gyr. These models also have an underlying different treatment of convective overshooting and Red Giant Branch stars. For our experiment we use a sample of high- () galaxies in the Hubble Ultra Deep Field held to be mostly in passive evolution, with low-resolution UV-spectroscopy and spectroscopic redshifts from GRAPES, and Spitzer IRAC and MIPS photometry from the Great Observatories Origins Deep Survey. We choose these galaxies because their mid-UV spectra exhibit features typical of A- or F-type stars, therefore TP-AGB stars ought to be expected in post-Main Sequence. We find that indeed the TP-AGB phase plays a key role in the interpretation of Spitzer data for high- galaxies, when the rest-frame near-IR is sampled. When fitting without dust reddening, the models with the empirically-calibrated TP-AGB phase always reproduce better the observed spectral energy distributions (SEDs), in terms of a considerably smaller . Allowing for dust reddening improves the fits with literature models in some cases. In both cases, the results from Maraston models imply younger ages by factors up to 6 and lower stellar masses (by on average). The observed strengths of the spectral feature compare better to the predicted ones in the case of the Maraston models, implying a better overall consistency of SED fitting. Finally, we find that photometric redshifts improve significantly using these models on the SEDs extending over the IRAC bands. These results are primarily the consequence of the treatment of the TP-AGB phase in the Maraston models, which produces models with redder rest-frame optical to near-IR colors. This work provides the first direct evidence of TP-AGB stars in the primeval Universe.
Subject headings:
stars: AGB and post-AGB — galaxies: evolution — galaxies: formation — galaxies: high-redshift1. Introduction
Age-dating the stellar populations of galaxies provides us with a cosmic timescale which is independent of cosmological models, and with a mean of reconstructing their star-formation history. Moreover, the same population synthesis tools used for age dating provide also an estimate of the stellar mass of galaxies. Thus, deriving star formation histories and masses for large numbers of galaxies at various redshifts allow us to attempt an empirical reconstruction of the formation epochs and mass-assembly history of galaxies. Theoretical models for galaxy formation and evolution can then be adjusted in order to comply with the galaxy evolution scenario emerging from the observations.
Clearly, the evolutionary population synthesis tools play a critical role in this process, and we must pay as much attention as possible to ensure that they provide ages and masses as accurate as possible. In this paper we focus on the problem of age and mass determinations for galaxies which are dominated by stars in the age range Gyr, because this is a range where different population synthesis tools give quite discrepant results. Moreover, at redshifts beyond 2 (or 3) the universe itself is younger than (or ) Gyr, and galaxies at such high redshift are bound to contain stars younger than Gyr. Hence, the use of an accurate stellar population tool is essential for the correct interpretation of the properties of high redshift galaxies, right at a cosmic time when different renditions of the hierarchical galaxy formation paradigm diverge dramatically (see e.g., Fig. 9 in Fontana et al., 2004).
In stellar populations with ages Gyr, stars in the advanced evolutionary stage known as the thermally-pulsing asymptotic giant branch (TP-AGB) contribute up to of the bolometric light, and up to of the near-IR (Maraston, 1998, hereafter M98). The first appearance of TP-AGB stars in the life of a stellar population has been called the AGB-phase transition (Renzini & Buzzoni, 1986), and its direct effect is a strong increase of the near-IR flux, as TP-AGB stars emit most of their radiation at m. With the advent of the Spitzer Space Telescope (SST), the rest-frame near-IR is now accessible to very high-redshifts, which allows one an improved analysis of the spectral energy distribution (SED) of high redshift galaxies, and makes it even more important than before to dispose of reliable stellar population tools.
The following concrete example illustrates the case. For a sample of high- galaxies with photometric redshifts and with data extending from the rest-frame UV to near-IR (from SST) Yan et al. (2004) estimated an age of 1.5 to 3.5 Gyr for the dominant stellar population ( by mass), with the residual trace of young stars as due to a recent star-formation episode. The Yan et al. result was obtained using the synthetic population tool by Bruzual & Charlot (2003, hereafter BC03). Some of the same galaxies were re-analysed by Maraston (2005, hereafter M05) using her own synthetic stellar populations, obtaining ages Gyr, right in the middle of the epoch when TP-AGB stars dominate. Moreover, the derived stellar masses are smaller when using Maraston models ( versus the typical value of quoted by Yan et al. 2004). Whereas both results may be astrophysically plausible, worth emphasising is that their implications concerning the formation redshift for the bulk of the stars and the galaxy mass assembly are vastly different. The difference is likely the result of the different weight given to the TP-AGB in the two sets of models, with the TP-AGB contribution being systematically lower in the BC03 models compared to the models of Maraston (2005). When using BC03 models a massive contribution of old stars is required in order to match the observed near-IR fluxes, and in the meantime a sprinkle of young stars is necessary to account for the rest-frame near-UV. On the contrary, a two-component stellar population is not required by the M05 models, as a single age (younger) population accounts at once for the SED from the near-UV to the near-IR. It is interesting to note in this context the early result of Lilly (1987), who found for a sample of cluster galaxies that synthetic near-IR colours not including the AGB phase were not red enough to match the data at given optical colour. The problem was cured by adding AGB effects on top of these early models using the fuel consumption theorem.
Besides the treatment of the TP-AGB, the BC03 and M05 models also differ for the set of stellar isochrones used to construct the synthetic populations, which may account for part of the difference in the results.
In this paper we investigate further on the effect of stellar population recipes on the modeling of galaxy SEDs, and we do so by applying the two sets of models to infer the mass and age (or best-fit star-formation histories) to a specific sample of high-redshift galaxies. Note that the results obtained with the BC03 models are representative of what would be obtained with other widely used models, like Pégase (Fioc & Rocca-Volmerange, 1997) and Starburst99 (Vázquez & Leitherer, 2005) due to similar recipes for the TP-AGB phase and identical input stellar evolutionary tracks (M05).
In Section 2 we recall the main differences between the BC03 and the M05 models, whereas Section 3 describes the main observational characteristics of the galaxies selected for this study. In Section 4 we describe the fitting procedure used to estimate the properties of these galaxies and the results are presented and discussed in Section 5. Finally, Section 6 is dedicated to a general discussion of the main results of this investigation. We adopt the current concordance cosmology, with , and equal to 0.7, 0.3 and 0.7, respectively. The age of the best-fit model is required to be lower than the age of the universe at the given spectroscopic redshift.
2. Main differences between the tested stellar population models
The BC03 and the M05 stellar population models differ by the following aspects: i) the stellar evolutionary models used to construct the isochrones; ii) the treatment of the TP-AGB phase; and iii) the procedure used for computing the integrated spectra. This latter point will not be discussed separately here (see M05). For full details on what below, we refer the reader to M05.
Input stellar models. The BC03 models are based on the Padova stellar tracks (e.g., Fagotto et al., 1994), whereas the M05 models are mostly based on the Frascati stellar tracks (e.g., Cassisi et al., 1997). The two set differ mostly for: a) the Padova tracks include a certain amount of convective overshooting on the Main Sequence (MS), whereas the Frascati tracks were constructed assuming no overshooting; b) the temperature distribution of the red giant branch (RGB) phase, that is shifted to cooler temperatures in the Padova tracks for solar metallicity and above, a result of the different calibration of the mixing-length theory used for the modeling of envelope convection.
Convective-core overshooting has two effects on stellar models. First, it prolongs the MS lifetime for given stellar mass, while leaving the effective temperature almost unchanged. This results from the extended convective core ensuring more hydrogen fuel to the central regions where nuclear burning takes place. Thus, for given age of the MS turnoff, isochrones constructed from models with overshooting are hotter, therefore bluer, than those constructed from models without overshooting. Second, overshooting delays the appearance of stars with a degenerate helium core, and the accompanying development of the RGB. For example, the RGB develops at an age of Gyr in the Frascati models, and at an age of Gyr in the Padova models (Ferraro et al., 2004, M05). The development of the RGB makes the SED redder, so in the age range Gyr models with overshooting are bluer, as they lack a well-developed RGB.
The net effect is that theoretical SEDs based on overshooting models are bluer therefore give systematically older ages compared to those based on models without it. Furthermore, by having a reduced contribution by the RGB, population models using stellar tracks with overshooting have lower luminosity for given age and mass in stars, i.e., have higher ratios, hence higher galaxy masses are derived for given luminosity. In summary, the net effect of overshooting is that for a given SED the BC03 models indicate older ages and higher masses compared to M05 models. Of course, this applies to population ages such that MS stars do have a convective core, i.e., for ages younger than a few Gyr.
While it is likely that overshooting makes convective cores somewhat more extended in mass, the size of this extension remains somewhat conjectural. On the one hand there exists no firm prediction from first principles, like in most situations involving turbulence. For stellar populations between and Gyr, the corresponding stellar masses at the MS turnoff range from to , with the mass of the convective core decreasing with decreasing mass, and eventually vanishing for , the precise value depending on composition. Thus, what one would need to know is the amount of convective overshooting (e.g., expressed as a fraction of the mass of the convective core) as a function of the stellar mass. This unknown function can only be empirically constrained by observations. In a recent attempt, based on fitting the shape of the color-magnitude of some open clusters, VandenBerg et al. (2006) concluded that overshooting would amount to of a pressure scale height, of course vanishing as the convective core itself vanishes. An overshooting about this size is also indicated by the asteroseismology of a Cep star (Dupret et al., 2004), and by and large is consistent with the amount assumed in the Padova models. On the other hand, observations of LMC star clusters rule out the late RGB development implied by the Padova tracks (Ferraro et al., 2004). To decide what is the size of overshooting as a function of stellar mass goes well beyond the aims of this paper, and we shall limit ourself to exploring the differences in the results when using different sets of models.
The Temperature of the RGB. Whereas for ages less than Gyr the M05 code gives redder SEDs compared to the BC03 code, after the completion of the RGB phase transition this tendency is reversed and the MO5 SEDs are bluer (Figure 27 in M05). This is due to the warmer RGBs in the Frascati stellar tracks compared to the Padova ones (Figure 9 in M05), which in turn results from different calibrations of the mixing-length parameter used in modeling envelope convection. The ages derived with the M05 models are older than those obtained from the BC03 models.
The TP-AGB phase. The treatment of the TP-AGB phase is perhaps the main difference between the M05 and the BC03 models. The contribution of the TP-AGB stars to the integrated light of a synthetic stellar population critically depends on what is adopted for the stellar mass loss taking place during this phase. The higher the assumed mass loss, the sooner the star loses its envelope, and the sooner the TP-AGB phase is terminated. Once more, there is no theory relating the mass loss rate to the basic stellar parameters, and once more one has to rely on empirical calibrations. BC03 adopt the mass loss calibration by Vassiliadis & Wood (1993), tuned to reproduce the maximum TP-AGB luminosity of a sample of Magellanic Cloud clusters from Frogel et al. (1990). In M05 instead, what is calibrated is the fractional contribution of the TP-AGB to the total bolometric light, and this calibration is made essentially on the same MC clusters using the Frogel et al. data. Sharing basically the same observational calibrating data, the two codes should give consistent results. As shown in M05 they do not, and the effective contribution of the TP-AGB is much larger in M05 compared to BC03. Full illustration of the differences is given in M05, where it is also shown that other population synthesis models, namely Pégase and Starburst99 behave very much like the BC03 ones. Again, rather than tracing the origin of the discrepancy, we focus here on the effects on the study of high redshift galaxies.
Summing up the effects of both overshooting and TP-AGB, the M05 models are brighter and redder than the BC03 models for ages between and Gyr. Here the use of the M05 templates implies the derivation of lower ages and stellar masses. At older ages the M05-templates are instead bluer.
3. Galaxy data and SED Fitting
For the present test we use the sample of seven galaxies in the Hubble Ultra Deep Field (HUDF) which were singled out by the BzK criterion for passively -evolving galaxies (Daddi et al., 2004). These galaxies show early-type morphologies on HUDF images and have spectroscopic redshifts between 1.4 and 2.5 (Daddi et al., 2005b, hereafter D05). Redshifts were determined from the Mg+Fe absorptions at rest-frame Å producing a characteristic shape dubbed feature by D05, on the HST+ACS grism spectra acquired in the framework of the Grism ACS Program for Extra-galactic Science project (GRAPES, Pirzkal et al., 2004). The presence of the feature imply that the UV/optical spectra of these galaxies are consistent with being dominated by A- or F-type stars. Therefore these objects are not dominated by OB type stars like typical star-forming galaxies and are predominantly passive. We choose these particular sample for this study because we might expect that the typical ages of stars in these galaxies are close to the critical 0.2-2 Gyr range where the different evolutionary synthesis models differ by the largest amount. This is therefore an ideal sample of high redshift galaxies to search for direct evidence of the effects from TP-AGB stars.
Three of the seven galaxies were assigned a lower quality (”B” class) redshift by D05, partly for the non perfect agreement with the photometric redshifts. This is now improved in most cases with the addition of the IRAC photometry to the SEDs and the M05 models (see Table 2 and Figure 9).
Stellar population properties for these galaxies were derived in D05 by fitting their SEDs (ten bands from to ) to BC03 templates spanning a wide range of parameters. Reddening was restricted to be and the Calzetti’s law (Calzetti et al., 2000) was adopted. In summary, the galaxies were found to be 1 Gyr old, to be in passive evolution since at least Gyr, to have de Vauculeurs light profiles and large stellar masses (). They were therefore interpreted as progenitors of massive ellipticals. The physical sizes of some of the objects ( kpc) were found to be significantly smaller than objects with similar masses in the local universe, which remained as an open issue in D05.
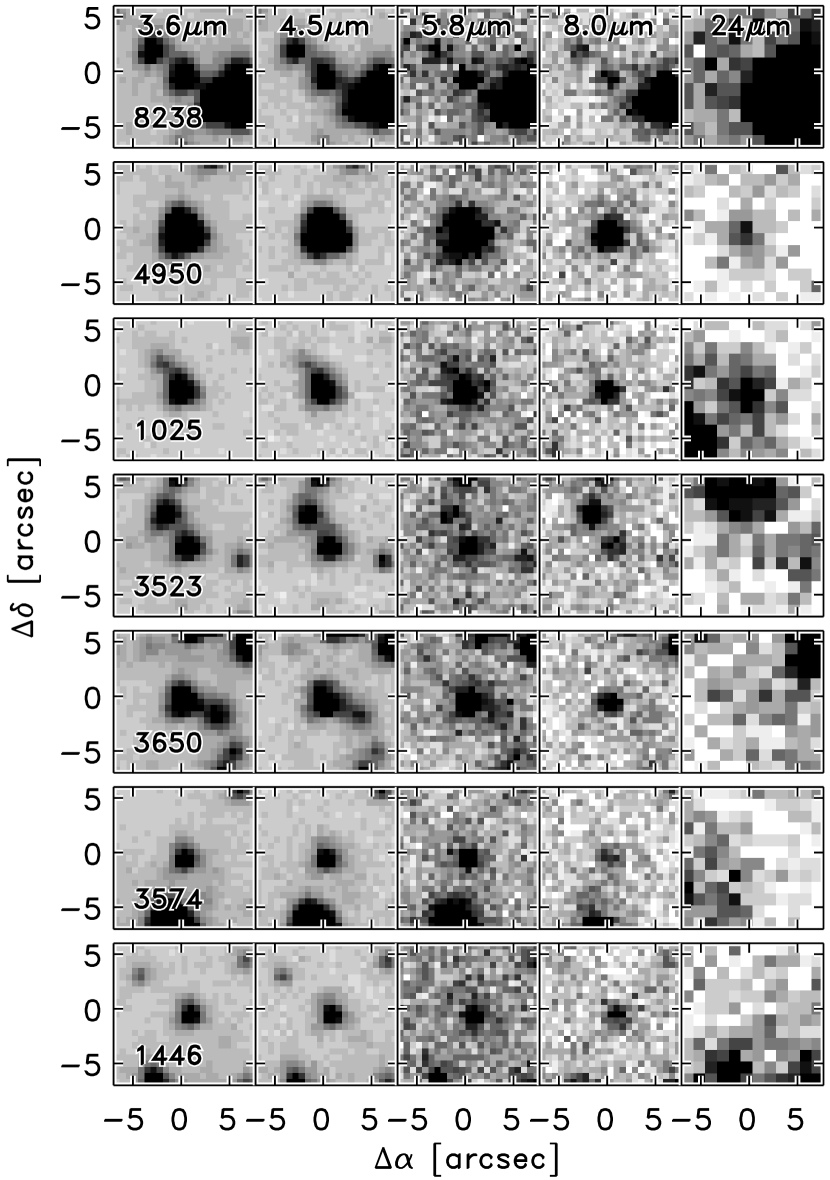
In the following we take advantage of the Spitzer IRAC (and MIPS) imaging obtained over the Ultra Deed Field (UDF) as a part of the Great Observatories Origins Deep Survey (GOODS) survey (Dickinson et al., in preparation and Chary et al., in preparation, respectively). All the seven galaxies were detected with high signal-to-noise in the four IRAC bands (see Figure 1). IRAC photometry was obtained using aperture magnitudes, corrected to total using aperture corrections for unresolved sources. The optical to near-IR SEDs of D05 were based on Sextractor MAG_AUTO apertures. We measured large diameter magnitudes in the -band to account for the flux lost by MAG_AUTO, to perform the match with the IRAC magnitudes. In order to account for the uncertainties in this matching process, and in the IRAC aperture corrections, we added a term of 0.1 mags in quadrature to the errors of the IRAC magnitudes.
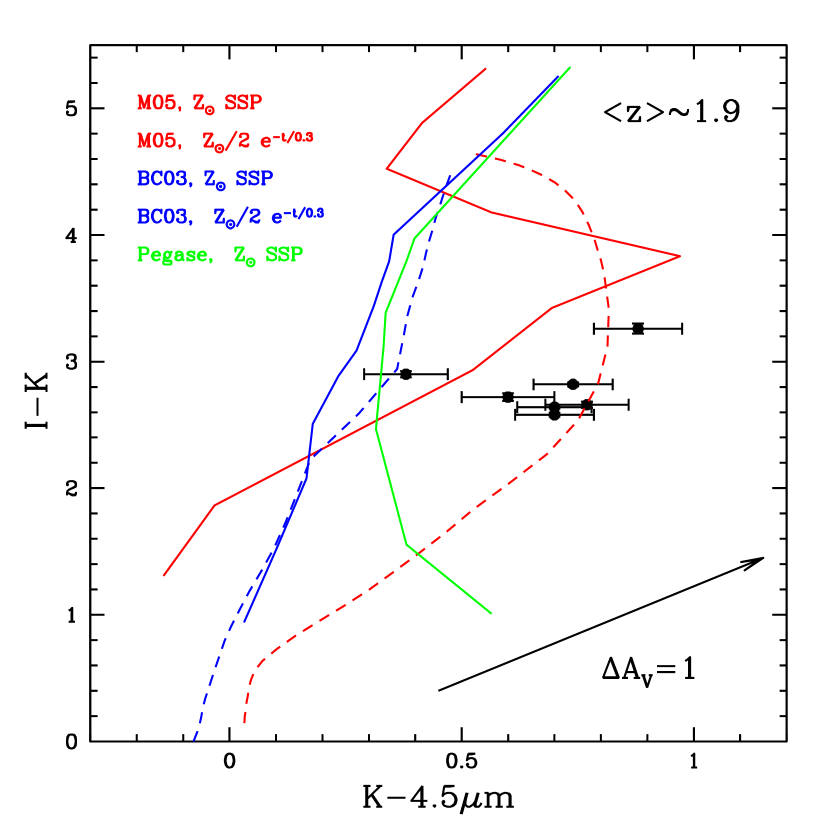
Figure 2 shows the observed vs. colour-colour diagram for our sample. Overplotted are some stellar population models from the M05, BC03 and Pegase libraries, with ages between 0.1 and 3.5 Gyr, in the observed frame at redshift 1.9. Simple Stellar Populations (SSPs) with solar metallicity are indicated by solid lines, while dashed lines display exponentially declining models with e-folding time of 0.3 Gyr (for the Pégase models, only the SSP is shown). As in analogous plots by Labbé et al. (2005) and Papovich et al. (2006), the very red colours displayed by the galaxies are not reached by the BC03 (or Pégase) templates, unless one adds strong dust reddening to the models. The M05 models match instead the observed galaxy colours at the ages corresponding to the AGB phase-transition. The present database (see the Appendix for the photometric data) allows the sampling of the galaxy spectral energy distributions up to the rest-frame -band. The whole wavelength range from the rest-frame to will be analysed in the next Section.
3.1. SED fitting
We use an adapted version of the code Hyper-Z (Bolzonella et al., 2000), kindly made available to us by M. Bolzonella, which performs SED fitting at fixed spectroscopic redshift111For the fitting procedure we use photometric errors of 0.05 if the formal error is smaller than that, to account for systematics in photometry and color matching. The fitting procedure is based on maximum-likelihood algorithms and the goodness of the fit is quantified via statistics (see the Hyper-Z manual for details). The code computes the for a certain number of templates, which differ for star formation (SF) histories, metallicities and ages, and finds the best-fitting template among them. It is important to note that the code does not interpolate on the template grids. This implies that the template set must be densely populated.
We have constructed templates that cover a wide range of stellar population parameters, namely: i) metallicities from to 2 ; ii) ages from 106 yr to 5 Gyr (the maximum possible age for the lowest redshift galaxy)222The spacing in age during the runs is fixed by the Hyper-Z code, see the manual for details.; iii) SF histories as: (a) instantaneous and chemically homogeneous bursts (i.e. Simple Stellar Populations, SSPs); (b) exponentially-declining modes (SFR , or -models, with Gyr); (c) truncated models, where SF is constant for a finite time interval and zero thereafter ( Gyr); constant star formation 333The models are available at www-astro.physics.ox.ac.uk/maraston. These composite templates (with prolonged SF histories) were constructed using the BC03 software package, for consistency with D05 and in order to be able to run the Hyper-Z code. As in D05, we determined 95% confidence ranges for ages and masses following Avni (1976), marginalizing over E(B-V), metallicity and SF history. This implies that the determination of the latter parameters is formally less constrained and the resulting values should be regarded as indicative.
To allow a direct comparison with other works, D05 in particular, the templates refer to a straight Salpeter IMF down to 0.1 . However, several pieces of evidence, from the redshift evolution of the fundamental plane to the of local Es to the metal content of the intergalactic medium strongly favour a Salpeter-like IMF down to 1 but flatter below as required to agree with the dynamically estimated ratios of early-type galaxies (Renzini, 2005). The actual shape of the IMF does not affect appreciably the SED since at any age most of the light is produced by stars in a narrow mass interval around the turnoff mass. However, it impacts on the amount of light emitted per unit mass turned into stars, thereby affecting the stellar ratio. For example, when using the IMF of Kroupa (2001) the ratio is a factor smaller than in the straight-Salpeter case (M05).
For the objects classified of ’Class A redshift’ by D05 the fitting procedure included also the strength of the absorption feature, as defined in D05 and measured on the GRAPES spectra. The difference between observed and model strength was included in the calculation of the when searching for the best-fit model, with the same weight as the photometric data.
Finally, the entire SED fitting was repeated with BC03-based templates spanning the same stellar population parameters as those used for the M05 models.
The output of the procedure includes: the age , i.e., the time since the start of SF; the metallicity ; the star-formation history SFR; the reddening ; and the stellar mass .
The stellar mass is evaluated by comparing the observed and the synthetic SED, which provides the mass that went into stars by the age of the galaxy. This approach was retain in order to allow a comparison with D05. However, such mass overestimates the true stellar mass, as stars die leaving remnants whose mass is smaller than the initial one. Adopting the prescriptions by Renzini & Ciotti (1993) for the initial mass-remnant mass relation, M98 evaluated that the stellar mass of a SSP is reduced by 15 Gyr after formation, most of which happens within the first few Gyrs. For given mass turned into stars, such reduction is smaller in stellar populations with extended star formation histories, due to a relatively higher fraction of living stars.

The actual for some illustrative cases of star-formation histories is given in Figure 3. Tables 1 and 2 give the stellar mass prior of such reduction, thus enabling a direct comparison with other results. Table 2 also reports the mass decrement (in percent) that corresponds to the given SFH and age444Tabular values of for several star formation histories can be found at www-astro.physics.ox.ac.uk/maraston.. This mass decrement should be applied to the masses listed in column 12.
4. Results
4.1. Assuming no reddening,
We first discuss the solutions that are obtained in the assumption of zero reddening. This allows us to single out the effect of stellar population modeling, thus highlighting some interesting differences between the two sets of models.
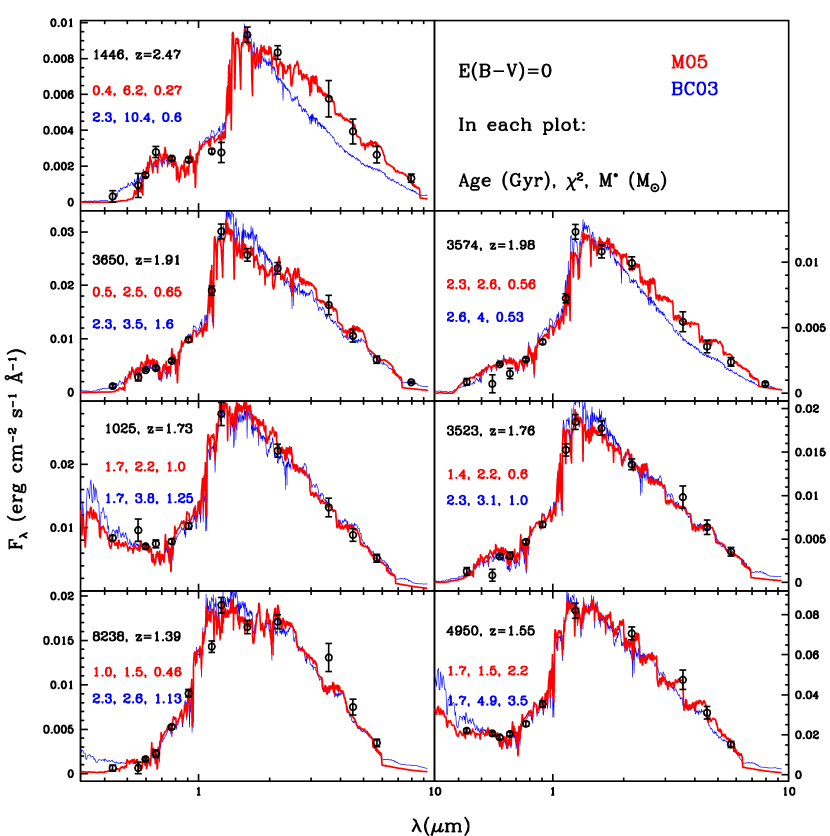
The corresponding best-fit solutions (lowest ) for using the BC03 (blue lines) and the M05 (red line) models are shown in Figure 4. The observed SEDs are shown as solid symbols with errorbars, and information on the individual galaxies and best fit SFHs is given in Table 1. Overall, the M05 models allow for better fits (lower ) for all galaxies, in the rest-frame near-IR as well as in the blue (e.g., the objects at =1.39, 1.55 and 2.47). Given the ages required to fit the observed SEDs, it is likely that the different recipes for the TP-AGB phase are primarily responsible for such effect. For the objects at and none of the BC03-based templates was able to match the near-IR fluxes. In the case of the galaxy not even an age as old as 2.3 Gyr is sufficient to obtain enough near-IR flux. Note also that the SSP solution gives a fairly good fit with M05 models (which are TP-AGB dominated at this age), whereas an extended SF history (constant until ) was required when using the BC03 models. In this case the M05 single-burst models supply both the high optical and the high near-IR fluxes, which come from the warm turnoff and cool TP-AGB stars, respectively. The stellar masses are typically smaller for the M05 models, being on average of those derived with the BC03 models. In part this is a consequence of the lower ages, with the average age of M05 models being also of that derived for the BC03 models. The differences are not as high as they would be in case of single bursts, as the more extended SFHs required by the BC03 models have lower ratios.
The most relevant difference in the results from the two sets of models is about the implied formation redshifts (see Table 1). Using BC03 models the stellar populations form at higher redshifts (sometime at much higher redshifts, see e.g., the object at ) and, since the galaxies are also more massive compared to the case when using M05 models, an appreciably faster mass growth of galaxies is implied.
4.2. as a free parameter
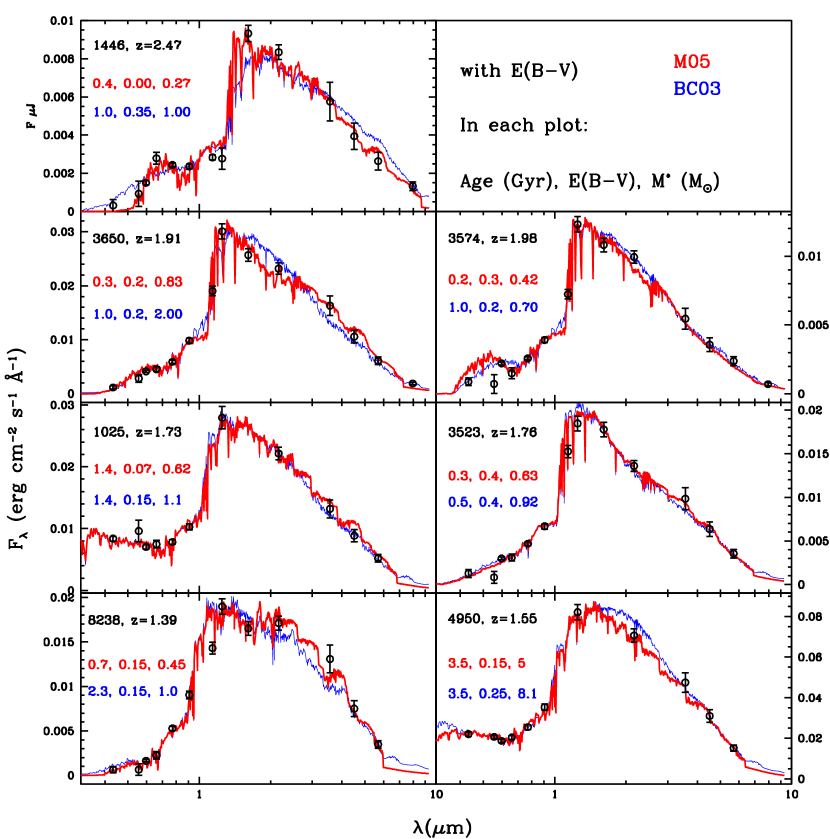
The best-fit solutions when also reddening is treated as a free parameter are displayed in Figure 5, and the parameters of the best-fits are given in Table 2. The reddening was allowed to vary among the options offered in the Hyper-Z package, namely, Milky Way, SMC, LMC and the so-called Calzetti’s law for local starbursts (references in Table 2). All these prescriptions refer to a dust-screen configuration. For this ’reddening’ case, in order to exploit all the available information and to control the degeneracies introduced by the larger number of free parameters, we have additionally included the strength of the feature in the computation of the . This was done only for galaxies with Class A redshift, namely for objects 4950, 1025, 3650, 3574, because for the Class B objects the is a less robust measurement (D05).
By allowing the best-fit procedure to treat as an additional free parameter, and allowing it to choose among four different reddening laws, it is no surprise that solutions with appreciably better are found. However, this does not ensure that such solutions are more likely than those assuming . It is also no surprise that some best-fits require the Calzetti’s law, whereas others prefer the SMC law. In just one case the LMC law was preferred, while in no cases the MW law was chosen. It is worth noting that the best-fit for the -object exhibiting the strongest TP-AGB contribution is reddening-independent for the M05 models.
In general, the inclusion of reddening reduces the ages of the
best-fits obtained with the BC03 models, making them closer to those
obtained with the M05 models. However, reddening
does not help to improve substantially the fits to the IRAC bands,
like in the case of objects 1446 and 3650. TP-AGB effects cannot be
traded with dust or metallicity effects, which helps reducing the
degeneracies in the age determination.
Detailed comments on the fits for individual galaxies are given
in the Appendix.
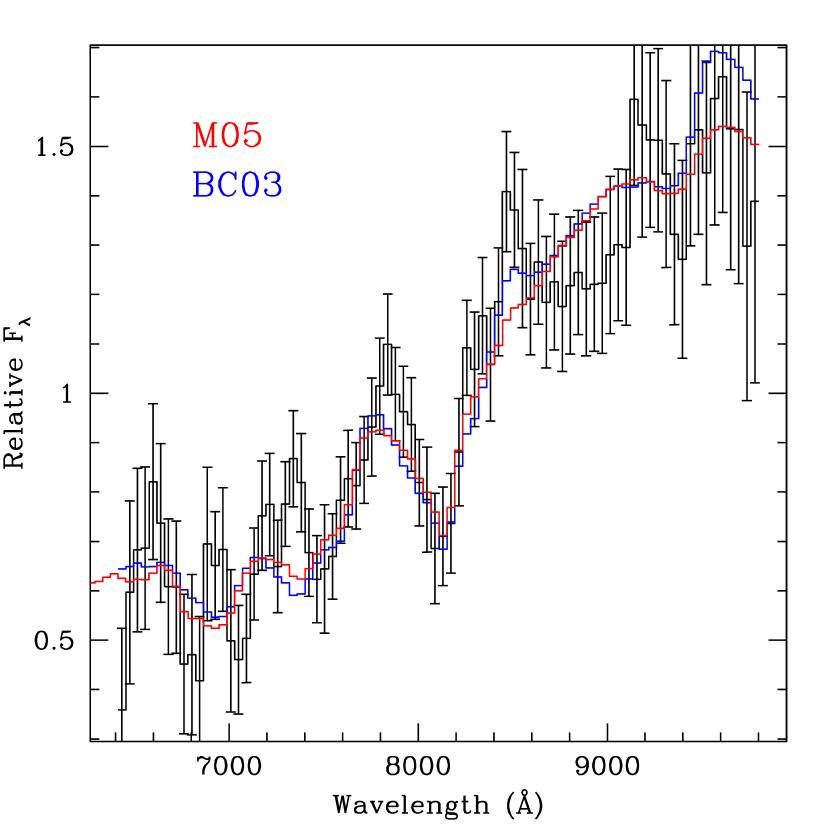
Figure 6 compares the GRAPES HST+ACS spectrum of object 3650 at , with the best-fit solutions corresponding to the BC03 and M05 models (see Table 2). We use this plot for illustrating the effect of the age/metallicity degeneracy that affects the optical, but is alleviated in the near-IR due to the distinctive spectral features of TP-AGB stars. The best-fit solutions recover similarly well the strength of the line and the spectral shape around it, in spite of having different population parameters, namely young and metal-rich for the M05 models and older and metal-poor for the BC03 models. However, the BC03-based solution gives an appreciably poorer fit to the near-IR SED (cf. Figure 5), showing how the inclusion of the near-IR fluxes can help breaking the age/metallicity degeneracy.
However in most cases spectral absorptions and photometric data on a wide spectral range are not available simultaneously. How realistic are then the best-fits obtained from the sole photometry? To get insight on this issue, we have repeated the fitting procedure without including the line when searching the best-fit model. We have then checked how well these ’photometric’ best-fit models recover the observed .

This is shown in Figure 7, in which the strengths predicted by the best-fit ‘photometric’ models are compared to the observed ones. Although based on a very small number of objects, the predicted values from M05 models are somewhat more accurate than those from the BC03 models (variances are 0.04 and 0.08, respectively).

As a final exercise, we have checked the effect on photometric redshifts derived using one or the other set of population models, and of the inclusion of the IRAC fluxes. The results are given in Table 2 and shown in Figure 8. The photometric redshifts obtained with the M05 templates are in better agreement with spectroscopic redshifts than those obtained with the BC03 models. The photometric redshifts obtained with the BC03 models and the IRAC data appear to be more discrepant than those in which only magnitudes up to were used (cf. D05). Also this effect likely originates from the different TP-AGB recipes.
4.3. Stellar Masses

The different star-formation histories derived from the different models have an impact on the derived stellar masses, which is summarised in Figure 9. The upper panels display the effects of the models (i.e., M05 vs BC03) on the derived stellar mass of galaxies, when using only the optical and near-IR bands (left-hand panel) and when also the IRAC 3.5–8 m data are used (right-hand panel). The masses predicted by the M05 templates are lower, which is a consequence of the lower ages. The effect is appreciably more pronounced when the IRAC bands are included, as the TP-AGB phase (the most discrepant ingredient between the two models) has its largest contribution in the rest-frame near-IR. However, lower masses can also be derived when the observed-frame is the reddest band used in the best fit. In fact, for the objects at the band samples the rest-frame , which is already affected by the TP-AGB (M05, Figure 18). In addition, the later onset of the RGB phase in the overshooting tracks adopted by BC03 helps to make the BC03 templates fainter at ages around 0.5 Gyr. The corresponding ratio is higher and a higher is derived (see Section 2). It is embarrassing to realize to which extent the recipes for the convective overshooting impact on the stellar masses that are derived for high- galaxies, and therefore on the implied galaxy formation scenarios.
The lower panels in Figure 9 show the effects (for given stellar population models) of the wavelength range included in the fitting procedure: only up to the band (on the x axis) and with the IRAC bands (on the y axis). The results based on BC03 are not appreciably affected by the inclusion of the IRAC bands (as recently pointed out by Shapley et al., 2005). Instead, for the M05-based solutions, three galaxies are found to have appreciably lower masses when the IRAC fluxes are considered, again the likely effect of the inclusion of the TP-AGB contribution.
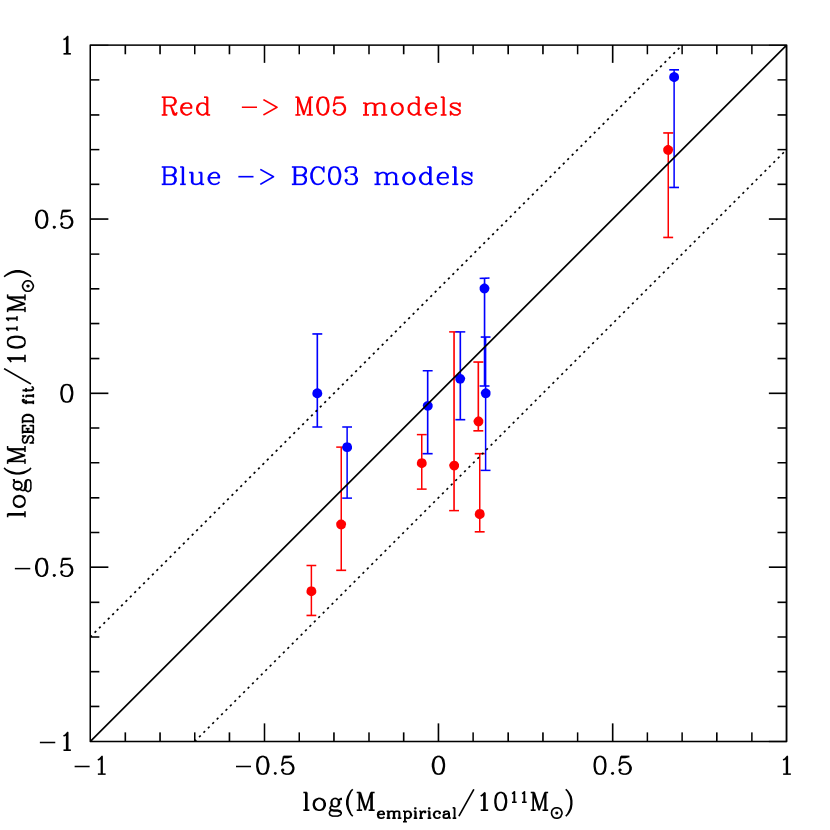
Finally, Figure 10 compares the masses obtained in this paper (including the IRAC data) with the calibration for -selected galaxies proposed by Daddi et al. (2004). This calibration was obtained using the observed -band magnitude and colour only, along with the BC03 templates. The figure shows that the calibration is well consistent with the BC03-based masses derived in this paper, which is no surprise. The M05 models suggest instead a calibration lower by 0.2 dex, on average.
4.4. MIPS detection and ongoing SFR
Only two galaxies are significantly detected with Spitzer+MIPS at 24 (objects 1025 and 4950, Fig. 1). The MIPS 24 fluxes of about 25–30Jy convert to star-formation rates of about 20-30 yr-1 at the redshifts of the sources, using the models from Chary & Elbaz (2001). The two MIPS detections are in fact the galaxies with the bluer UV spectra (see D05) and more extended star formation histories (see Table 2). The MIPS derived SFRs are comparable, given the uncertainties, with the residual ongoing SFRs (of yr) that are obtained through the SED modeling of these 2 galaxies (see also D05). For the rest of the galaxies the 3 limits on the 24 flux imply SFR below 10 yr-1. We recall that typical galaxies with similar K-band fluxes to the sample studied here have much stronger 24 emission, of order of 120Jy (Daddi et al., 2005a). The low MIPS fluxes from these sources underline once again, in agreement with their spectral features, that these objects are predominantly passive.
4.5. The role of AGNs
In obtaining the best-fitting models we have assumed that the observed SEDs are the results of just stars and dust. The possible presence of an AGN would obviously affect stellar population modeling in general. However, differences between the physical properties of galaxies inferred with the M05 or BC03 models remain, as these models have a different ratio of optical to near-IR flux. Therefore, even if at play, AGNs would not alter the sense of this investigation.
More specifically, AGNs probably play a minor role on our analysis. First, no clear AGN features are observed in the spectra of these objects. Also, the shape of the SED over IRAC is clearly stellar with a secure identification of the peak emission at 1.6 . Two of the galaxies (1025 and 1446) have -ray detections, but as discussed in D05 these are extremely hard and absorbed. Coupled to the evidence of the faintness of the galaxies at 24 , we conclude that the AGN should not influence appreciably the photometry from the UV to the near-IR rest-frame. For example, if we adopt the SED shapes of NGC1068 or MRK231 and normalise them to the 24 photometry of the sources, the contribution of the AGN to the optical to near-IR light of the galaxies would be entirely negligible. Similarly, from the narrow -band to -ray flux correlation of AGN shown by Brusa et al. (2005), we conclude that possible AGN in our sources are expected to provide a negligible contribution to the -band light of our galaxies.
Finally, the overall good agreement between predicted and observed line-strengths (Figure 7) and the good match between spectroscopic and photometric redshifts (Figure 8) suggest that a significant AGN contribution is highly unlikely.
5. Discussion
The aim of this paper is to explore how much the star formation histories of high- galaxies, that are derived by fitting observed to synthetic spectral energy distributions depend on the adopted stellar population models. In particular, we focused on the TP-AGB evolutionary phase, because TP-AGB stars are the dominant bolometric and near-IR contributors in stellar populations with ages 1 Gyr (M98; M05). Therefore, such phase must be of primary importance at high-, when the universe itself was just a few Gyrs old (Maraston, 2004, 2005; Renzini, 1992), and especially in the interpretation of Spitzer data for high- objects. The recipes for the TP-AGB phase are found to differ significantly among the various models, which has motivated us to check the robustness of the results obtained for high- galaxies.
To this aim we have analysed a sample of mostly passively evolving high- () galaxies with optical and Spitzer/IRAC photometry, modeling the whole spectral energy distribution from the rest-frame to . The analysis was performed with two libraries of stellar models: the M05 models in which the TP-AGB phase is calibrated on Magellanic Cloud globular clusters, and the BC03 models in which, like in most other models in the literature (e.g. Pegase, Starburst99) the energy contribution from the TP-AGB phase is significantly lower than in the Maraston models. Furthermore, the two models adopt stellar evolutionary tracks, in which the onset of the Red Giant Branch is predicted at different ages, which also impact on the time evolution of the synthetic spectral energy distribution. The differences between stellar population models are widely discussed in M05 and recalled in Section 2.
Besides the 14 photometric bands spanning from rest-frame to , the procedure introduced in this paper also includes the strength of a near-UV absorption feature (the at 2800 Å, see D05) for searching the best-fit galaxy models. In this way the effect of the age/metallicity degeneracy is substantially reduced. We have also checked that even without using the spectroscopic information, but only with the photometric SED, the best-fits obtained with the M05 models recover well the strength of the feature, hence provide consistent models for distant galaxies.
We then show to which extent the derived star-formation histories of the sample galaxies are model dependent. The M05 models typically match the rest-frame near-IR and optical very well, without invoking strong reddening and without violating the constraint set by the age of the universe. The BC03-based solutions exhibit in some cases near-IR fluxes that are significantly lower than the data, which requires the addition of old stellar populations or dust reddening or a combination of the two. This is reminiscent of recent results on high- galaxies in which Spitzer/IRAC data are interpreted with the BC models (e.g., Yan et al., 2004) or the Pegase models (e.g., Villar-Martín et al., 2006). The young solutions required to match the blue side of the SED could not match the rest-frame near-IR, which led the authors to assume an underlying old population to be responsible for the near-IR fluxes. While a two-component model is not implausible in itself, the proportions by mass of the young and old component (1 vs. 99 %) as well as the age of the old component, comparable to the age of the Universe, make the star formation history contrived.
The lower masses derived from the M05 models may help understanding the origin of an apparent discrepancy noted by D05 and concerning the relationship between the physical sizes and the masses of the galaxies in the present sample. The galaxies were found to be too small for the given masses in comparison to local objects. The lower masses derived here already help in alleviating the discrepancy. In particular, the object, with a stellar mass around , is more likely the precursor of a bulge rather than a massive elliptical. Its rather small size ( kpc, D05) supports this conclusion, as it can be inferred from comparisons with local samples (Bender et al., 1992). Also its formation redshift and metallicity compares well with similar estimates of bulges in the local universe (Thomas & Davies, 2006; Sarajedini & Jablonka, 2005). According to the BC03 models, three galaxies have rather low metallicities () and at the same time high masses (). Such objects do not match local relationships, even taking metallicity gradients into account. Only one such object is found with the M05 models.
Finally, we find that the stellar population templates impact on photometric redshift determination. The use of IRAC bands and M05 templates give photometric redshifts that are in excellent agreement with the spectroscopic ones. Again, we ascribe this effect to the prescriptions for the TP-AGB phase.
In this work we have focused on high- galaxies, where the stellar populations are young therefore TP-AGB stars must exist. Our spectral fitting represents the first direct evidence for such stars in the early universe. Going to even higher redshifts might reveal further interesting aspects of galaxy evolution, a scope we are pursuing in the future. However, TP-AGB stars may matter at any redshift depending on the specific star formation history. For example, van der Wel et al. (2005) measured the evolution of the rest-frame -band Fundamental Plane from to the present, by using IRAC imaging of a sample of early-type galaxies. They find that the -band luminosities of the low-mass objects are too large (at given luminosity), or the colours too red, with respect to the prediction of the BC03 or Vazdekis et al. (1996) models. The M05 models were found to provide a better match the data. This effect, which is correctly attributed to the treatment of the TP-AGB phase, implies that those low-mass early-type galaxies experienced a burst of star formation at redshift close to one.
In conclusion, the recipe for the stellar population modeling plays a central part in the derivation of the star formation histories of high- galaxies, which should be kept in mind when the derived parameters are used to constrain galaxy formation.
References
- Avni (1976) Avni, Y. 1976, ApJ, 210, 642
- Bender et al. (1992) Bender, R., Burstein, D., & Faber, S. M. 1992, ApJ, 399, 462
- Bolzonella et al. (2000) Bolzonella, M., Miralles, J.-M., & Pelló, R. 2000, A&A, 363, 476
- Bouchet et al. (1985) Bouchet, P., Lequeux, J., Maurice, E., Prevot, L., & Prevot-Burnichon, M. L. 1985, A&A, 149, 330
- Brusa et al. (2005) Brusa, M., et al. 2005, A&A, 432, 69
- Bruzual & Charlot (2003) Bruzual, G., & Charlot, S. 2003, MNRAS, 344, 1000
- Calzetti et al. (2000) Calzetti, D., Armus, L., Bohlin, R. C., Kinney, A. L., Koornneef, J., & Storchi-Bergmann, T. 2000, ApJ, 533, 682
- Cassisi et al. (1997) Cassisi, S., Castellani, M., & Castellani, V. 1997, A&A, 317, 108
- Chary & Elbaz (2001) Chary, R., & Elbaz, D. 2001, ApJ, 556, 562
- Daddi et al. (2004) Daddi, E., Cimatti, A., Renzini, A., Fontana, A., Mignoli, M., Pozzetti, L., Tozzi, P., & Zamorani, G. 2004, ApJ, 617, 746
- Daddi et al. (2005a) Daddi, E., et al. 2005a, ApJ, 631, L13
- Daddi et al. (2005b) Daddi, E., et al. 2005b, ApJ, 626, 680
- Dupret et al. (2004) Dupret, M.-A., Thoul, A., Scuflaire, R., Daszyńska-Daszkiewicz, J., Aerts, C., Bourge, P.-O., Waelkens, C., & Noels, A. 2004, A&A, 415, 251
- Fagotto et al. (1994) Fagotto, F., Bressan, A., Bertelli, G., & Chiosi, C. 1994, A&AS, 104, 365
- Ferraro et al. (2004) Ferraro, F. R., Origlia, L., Testa, V., & Maraston, C. 2004, ApJ, 608, 772
- Fioc & Rocca-Volmerange (1997) Fioc, M., & Rocca-Volmerange, B. 1997, A&A, 326, 950
- Fitzpatrick (1986) Fitzpatrick, E. L. 1986, AJ, 92, 1068
- Fontana et al. (2004) Fontana, A., et al. 2004, A&A, 424, 23
- Frogel et al. (1990) Frogel, J. A., Mould, J., & Blanco, V. M. 1990, ApJ, 352, 96
- Kroupa (2001) Kroupa, P. 2001, MNRAS, 322, 231
- Labbé et al. (2005) Labbé, I., et al. 2005, ApJ, 624, L81
- Lilly (1987) Lilly, S. J. 1987, MNRAS, 229, 573
- Maraston (1998) Maraston, C. 1998, MNRAS, 300, 872
- Maraston (2004) Maraston, C. 2004, in Multiwavelength Mapping of Galaxy Formation and Evolution, eds. R. Bender & A. Renzini, p. 10
- Maraston (2005) Maraston, C. 2005, MNRAS, 362, 799
- Papovich et al. (2006) Papovich, C., et al. 2006, ApJ, 640, 92
- Pirzkal et al. (2004) Pirzkal, N., et al. 2004, ApJS, 154, 501
- Prevot et al. (1984) Prevot, M. L., Lequeux, J., Prevot, L., Maurice, E., & Rocca-Volmerange, B. 1984, A&A, 132, 389
- Renzini (1992) Renzini, A. 1992, in IAU Symp. 149: The Stellar Populations of Galaxies, p. 325
- Renzini (2005) Renzini, A. 2005, in The Initial Mass Function 50 Years Later, ed. E. Corbelli, F. Palla & H. Zinnecker, Dordrecht:Springer, p. 221
- Renzini & Buzzoni (1986) Renzini, A., & Buzzoni, A. 1986, in ASSL Vol. 122: Spectral Evolution of Galaxies, p. 195
- Renzini & Ciotti (1993) Renzini, A., & Ciotti, L. 1993, ApJ, 416, L49
- Sarajedini & Jablonka (2005) Sarajedini, A., & Jablonka, P. 2005, AJ, 130, 1627
- Shapley et al. (2005) Shapley, A. E., Steidel, C. C., Erb, D. K., Reddy, N. A., Adelberger, K. L., Pettini, M., Barmby, P., & Huang, J. 2005, ApJ, 626, 698
- Thomas & Davies (2006) Thomas, D., & Davies, R. L. 2006, MNRAS, 366, 510
- van der Wel et al. (2005) van der Wel, A., Franx, M., van Dokkum, P. G., Huang, J., Rix, H. ., & Illingworth, G. D. 2005, ArXiv Astrophysics e-prints
- VandenBerg et al. (2006) VandenBerg, D. A., Bergbusch, P. A., & Dowler, P. D. 2006, ApJS, 162, 375
- Vassiliadis & Wood (1993) Vassiliadis, E., & Wood, P. R. 1993, ApJ, 413, 641
- Vazdekis et al. (1996) Vazdekis, A., Casuso, E., Peletier, R. F., & Beckman, J. E. 1996, ApJS, 106, 307
- Vázquez & Leitherer (2005) Vázquez, G. A., & Leitherer, C. 2005, ApJ, 621, 695
- Villar-Martín et al. (2006) Villar-Martín, M., et al. 2006, MNRAS, 366, L1
- Yan et al. (2004) Yan, H., et al. 2004, ApJ, 616, 63
| IDaaGalaxy ID as in Daddi et al. 2005 | mod | t | SFH | bbThe mass is obtained from normalisation of the SED. Ranges refer to the 95% confidence level. Note that the total magnitudes are defined from the values obtained from Sérsic profile fitting given in D05, Table 1. | ||||
|---|---|---|---|---|---|---|---|---|
| Gyr | ||||||||
| 8238 | 1.39 | M05 | 1.0 | 1.8 | 2 | 1.5 | ||
| BC03 | 2.3 | 2.9 | 2.5 | 2.6 | ||||
| 4950 | 1.55 | M05 | 1.7 | 2.7 | 1.5 | |||
| BC03 | 1.7 | 2.7 | 2.5 | 4.9 | ||||
| 1025 | 1.73 | M05 | 1.7 | 3.2 | 2.2 | |||
| BC03 | 1.7 | 3.2 | 2.5 | 3.8 | ||||
| 3523 | 1.76 | M05 | 1.4 | 2.9 | Gyr | 2.2 | ||
| BC03 | 2.3 | 4.6 | 2.5 | Gyr | 3.1 | |||
| 3650 | 1.91 | M05 | 0.5 | 2.2 | 2 | Gyr | 2.5 | |
| BC03 | 2.3 | 5.5 | 2.5 | Gyr | 3.5 | |||
| 3574 | 1.98 | M05 | 2.3 | 6 | Gyr | 2.6 | ||
| BC03 | 2.6 | 8.2 | 0.4 | Gyr | 4.0 | |||
| 1446 | 2.47 | M05 | 0.4 | 2.8 | 2 | SSP | 6.2 | |
| BC03 | 2.3 | 15 | Gyr | 10.4 |
Note. — The variable is the temporal distance from the beginning of star-formation. The formation redshift refers to , thereby indicating, in case of extended star formation histories, the epoch at which the galaxy started to form. The last IRAC filter was excluded for objects up to z=1.76, for which this filter samples rest-frame wavelengths 2.5 microns, that is the limit where the empirical TP-AGB star spectra are defined in the M05 models. The same filter configuration was used when the BC03 models were employed. We use the following conversion between AB and Vega magnitudes in the - and -band: , .
| IDaaGalaxy ID as in Daddi et al. 2005 | mod | t | SFH | E(B-V) | eeThrough and | ffSee note (b) to Table 1 | ggFrom Daddi et al. 2005 | hhThis column gives the percentage of mass decrement due to stellar mass loss. It should be applied to values in Column 11 (labelled f) | |||||
|---|---|---|---|---|---|---|---|---|---|---|---|---|---|
| Gyr | |||||||||||||
| 8238 | 1.39 | 1.39 | M05 | 0.7 | 1.7 | 2 | Gyr | 0.15bbSMC reddening law as in Prevot et al. (1984) and Bouchet et al. (1985) | 1.1 | 0.250.47 | 12.4 | 21 | |
| 1.30 | BC03 | 2.3 | 2.9 | 2.5 | Gyr | 0.15ccReddening law as in Calzetti et al. (2000) | 2. | ||||||
| 4950 | 1.55 | 1.55 | M05 | 3.5 | 7.5 | 0.15bbSMC reddening law as in Prevot et al. (1984) and Bouchet et al. (1985) | 0.6 | 2.85.6 | 2.97.3 | 26 | |||
| 1.67 | BC03 | 3.5 | 7.5 | 0.25ccReddening law as in Calzetti et al. (2000) | 0.94 | ||||||||
| 1025 | 1.73 | 1.72 | M05 | 1.4 | 3.1 | 0.07bbSMC reddening law as in Prevot et al. (1984) and Bouchet et al. (1985) | 1.1 | 0.30.4 | 11.8 | 20 | |||
| 1.77 | BC03 | 1.4 | 3.1 | 0.15ccReddening law as in Calzetti et al. (2000) | 0.64 | ||||||||
| 3523 | 1.76 | 1.68 | M05 | 0.3 | 1.9 | /5 | Gyr | 0.4bbSMC reddening law as in Prevot et al. (1984) and Bouchet et al. (1985) | 1.2 | 0.40.6 | 11.5 | 18 | |
| 1.63 | BC03 | 0.5 | 2.1 | 0.4bbSMC reddening law as in Prevot et al. (1984) and Bouchet et al. (1985) | 1.2 | ||||||||
| 3650 | 1.91 | 1.88 | M05 | 0.3 | 2.1 | 2 | SSP | 0.2bbSMC reddening law as in Prevot et al. (1984) and Bouchet et al. (1985) | 1.3 | 0.33-0.85 | 1.32 | 19 | |
| 1.81 | BC03 | 1.0 | 2.7 | /5 | SSP | 0.2ccReddening law as in Calzetti et al. (2000) | 1.9 | ||||||
| 3574 | 1.98 | 1.94 | M05 | 0.2 | 2.1 | 2 | SSP | 0.3hhThis column gives the percentage of mass decrement due to stellar mass loss. It should be applied to values in Column 11 (labelled f) | 2.5 | 0.20.4 | 0.50.9 | 18 | |
| 1.94 | BC03 | 1.0 | 2.9 | Gyr | ccReddening law as in Calzetti et al. (2000) | 2. | |||||||
| 1446 | 2.47 | 2.74 | M05 | 0.4 | 2.8 | 2 | SSP | 0.00 | 3.1iiFor this object the were computed without the photometric data in the Nicmos filter. This point is off but has a small errorbar, which drives the to the misleading values of 6.2 and 5.8, in case of the M05 and BC03, respectively. | 0.270.2 | 0.71.1 | 20 | |
| 2.86 | BC03 | 1.0 | 3.8 | 0.35ccReddening law as in Calzetti et al. (2000) | 4.7iiFor this object the were computed without the photometric data in the Nicmos filter. This point is off but has a small errorbar, which drives the to the misleading values of 6.2 and 5.8, in case of the M05 and BC03, respectively. |
Note. — The best-fit parameters and refer to the model obtained using the spectroscopic redshift . The values are given for comparison. See Table 1 for other notes.
Here we comment in more details on the best-fits obtained for individual objects for the reddening case (cfr. Table 2).
8238, z=1.39. The line was not included in the Ṫhe object is Gyr old, metal-rich and in passive evolution since 0.4 Gyr. The reddening follows an SMC-like law. The stellar mass is with small dispersion. For the BC03 models, the best solution has a worse , a significantly older age and a significantly longer formation timescale. The stellar mass is a factor 2.2 larger and consistent with what obtained in D05 from fitting the sole optical bands.
It is interesting to note that the same, smaller stellar mass would
have been derived by fitting the M05 models up the sole observed-frame
(see Figure 9). This is due to two effects. First, at
redshift the observed samples into the rest-frame ,
which is already affected by the TP-AGB prescriptions (M05). Second,
as pointed out in Section 2, another important difference between the
two sets of models exist, namely the energetics of the different input
stellar evolutionary tracks. The M05 models are based on tracks in
which the RGB phase starts developing at younger ages with respect to
the Padova tracks used in BC03. The delay in the latter is due to the
overshooting (see discussion in M05). The result is that the M05 SSP
models are brighter around 1 Gyr (cf. M05, Fig. 7), which implies a
lower stellar mass, an effect anticipated in M05. It should be noted
that the earlier onset of the RGB phase compares very well with the
observed RGB contribution in Magellanic Cloud globular clusters
(Ferraro
et al., 2004), while the predictions based on the Padova tracks
display a severe discrepancy with the data.
4950, z=1.55. The line was included in the Ṫhe
best-fit solution is 3.5 Gyr old, is forming stars according to a tau model with e-folding time of 1 Gyr, the metallicity is half-solar
and (SMC law). The extended star formation history is
consistent with the irregularities and blobs in the -band image and
with its spiral-like morphology (D05). This galaxy has a huge De
Vauculeurs bulge and turned out to be the most massive object of the
sample. The observed is remarkably well reproduced by this
model. is large and very well constrained. It is consistent
with both the value of D05 and that derived here with the BC03
models. The best solution obtained with the BC03 models has similar
overall parameters, but the reddening is larger and the is
worse.
1025, z=1.73. The line was included in the
Ṫhe best-fit is 1.4 Gyr old, still forming stars at
a very modest rate ( model, with Gyr). The stellar
mass is . The solution obtained with the BC03 model
has a lower metallicity and a larger mass.
3523, z=1.76. The line was not included in the
Ṫhe for this galaxy is very small (
Å), which implies either very young ages or very low
metallicities. The solution allowing for the best comparison to the
observed line turned out to be young and rather metal-poor. Its is 1.07. The galaxy is passively evolving since 0.2 Gyr. The solution
obtained with the BC03 models allows a worse match to the line
(1.14 Å) because of the higher metallicity. A higher metallicity is
found because it provides more flux to the near-IR.
3650, z=1.91. The line was included in the Ṫhe
galaxy is young and metal-rich, and in passive evolution for the M05
models. It has formed stars at a remarkable rate as is
. The spectrum displays a nice near-IR excess
that is very well fitted. The match to is remarkable good (1.25
Å versus the observed 1.25 Å). The solution obtained with the
BC03 models is older and significantly more metal-poor, though the
stellar mass of the galaxy if higher (). This
mass is too large for a metallicity in comparison with what
found in the local universe. This solution matches worse to the
observed SED.
3574, z=1.98. The line was included in the
Ṫhe best-fit is young, metal-rich, and rather highly
reddened. The model is passively evolving. The best-solution obtained
with the BC03 models is older and metal-poor.
1446, z=2.47. The line was not included in the
Ṫhis is perhaps the strongest case of AGB-dominated
object. The fit requires a super-solar metallicity. However, the
amount of TP-AGB in the M05 models at this metallicity was even
slightly too low around the J band with respect to the
observations. Since the TP-AGB fuel and spectral-types at super-solar
metallicities are not well constrained given the absence of local GCs
as calibrators (see discussion in M05), we could accept to modify the
model. An excellent fit is obtained when the fuel is augmented by 30%
and the O-rich stars have a slightly warmer temperature. Both changes
are certainly inside the uncertainties of the TP-AGB phase at
high-metallicity. Noteworthy, this fit does not require any
reddening. The stellar mass is less than 1/3 the lower bound of the
D05 solution. The BC03-based solution is older and highly reddened,
yet the match to the observed SED is not satisfactory, in the near-IR
as well as in the optical. We have verified that older ages (2.6 Gyr)
would provide a better fit, but these ages are above the limit set by
the age of the Universe.
Note that the visual quality of the fit did not correspond to the values when the F110 band was included in the Ṫhis is due to this photometric data having a very small error, which drives the Ẇhile the best-fit model was found using all bands for consistency with the other galaxies, the values given in Table 2 were computed by excluding the F110 band.
The data in F110 and J bands are off the models and are responsible for the significantly higher values of that are obtained in case of this galaxy with respect to the other objects. We have noted that significantly better values of () are obtained when the redshift is higher than the spectroscopic value and close to the redshift estimated photometrically with the M05 models (2.74, cf. Figure 8). In this case, the best-fit model, that has similar overall parameters as that presented in Figure 5, did not require any modification of the fuel consumption in the TP-AGB phase.
| ID | |||||||
|---|---|---|---|---|---|---|---|
| 8238 | |||||||
| 4650 | |||||||
| 1025 | |||||||
| 3523 | |||||||
| 3650 | |||||||
| 3574 | |||||||
| 1446 |
| m() | m() | m() | m() | ||||
|---|---|---|---|---|---|---|---|