AD Mensae: a dwarf nova in the period gap ††thanks: Based on observations collected at the European Southern Observatory, La Silla, Chile and at the NOAO Cerro Tololo Interamerican Observatory, Chile.
Abstract
Aims. AD Men has been classified as a probable long–period dwarf nova based on its long–term variability. Recent spectroscopic data instead suggested a short–period system. With the here presented observations we aim at clarifying its nature.
Methods. Time–resolved photometry and spectroscopy has been used to get information on the orbital period of this system.
Results. The light curve shows the typical flickering and a clear hump–like periodic modulation with an average amplitude of 0.3 mag and a period of h. The radial velocity measurements of the H emission line confirm this value as the orbital period.
Conclusions. AD Men is thus located at the lower end of, but clearly inside, the gap of the period distribution of cataclysmic variables, making it one of only 11 dwarf novae in this important period range.
Key Words.:
stars: dwarf novae – stars: individual: AD Men1 Introduction
Dwarf novae (DNe) are a subtype of cataclysmic variables (CVs) and as such are close, interacting binary systems, comprising a white dwarf receiving mass from a Roche–lobe–filling late–type star. In DNe, mass transfer from the secondary star to the primary takes place via an accretion disc, whose semi-regular long-term brightness variations are observed as “outbursts”. Several groups of DNe are distinguished according to their outburst behaviour, the most prominent ones being the SS Cyg (or U Gem)- and SU UMa subtypes. See Warner (warn95 (1995)) for a thorough introduction to these objects.
The evolutionary progress of a CV is reflected by the change of its orbital period. Consequently, the period distribution of CVs represents the observational testbed for theoretical models of CV evolution. One of the most striking features of the observed distribution is a dearth of systems with orbital periods between roughly 2 and 3 h, the so-called period gap. Generally, this gap divides the systems with higher mass transfer rate, which are located at longer orbital periods, from the low mass transfer rate systems situated below the gap.
AD Men has first been mentioned by Payne-Gaposchkin (payn71 (1971)) as a possible CV of SS Cyg subtype, i.e. as a dwarf nova with an orbital period usually longer than 3 h.
There was some confusion regarding the identity of the object, as incorrect coordinates and finding charts were given in the old versions of the ”Catalog and Atlas of Cataclysmic Variables” (Downes & Shara down+93 (1993); Downes et al. down+97 (1997)). Thus, also the wrong star was observed by Zwitter & Munari zwit+95 (1995). However, the online edition of this catalogue (Downes et al. down+01 (2001)) now contains the correct finding chart and coordinates. Recently, spectroscopic data taken by Tappert & Schmidtobreick (tapp+05 (2005)) confirmed the dwarf nova classification for AD Men, although several spectral characteristics suggested a period below the gap.
To clarify this apparent discrepancy, we have conducted time–resolved photometric and spectroscopic observations, in order to determine the orbital period of AD Men.
2 The photometry
2.1 Observation and data reduction
The photometric data were taken as part of a backup program in three nights on 2004-12-27/29/30 using an R filter in front of a 512x512 CCD mounted at the 1.0 m SMARTS/CTIO telescope. The data reduction included the usual steps of bias subtraction and division by skyflats.
Aperture photometry for all stars on the CCD field was computed using the daophot package in IRAF and the standalone daomatch and daomaster programs (Stetson stet92 (1992)). Differential light curves were established with respect to an average light curve including a total of 19 comparison stars which were checked to be non–variable.
In this way we additionally discovered another, previously unknown, variable star in the field at R.A. = 06:04:51.4 and DEC = 71:23:24 (2000.0) as measured from the Digitized Sky Survey (DSS). This object appears to be a long–periodic variable, showing a smooth variation with an amplitude within our observations of 0.6 mag.
Although our photometric data were not calibrated, a comparison with the red DSS data, where AD Men clearly is caught during a bright state, shows the target to be much fainter during our observations, i.e. at least close to its recorded quiescence value.
2.2 Results


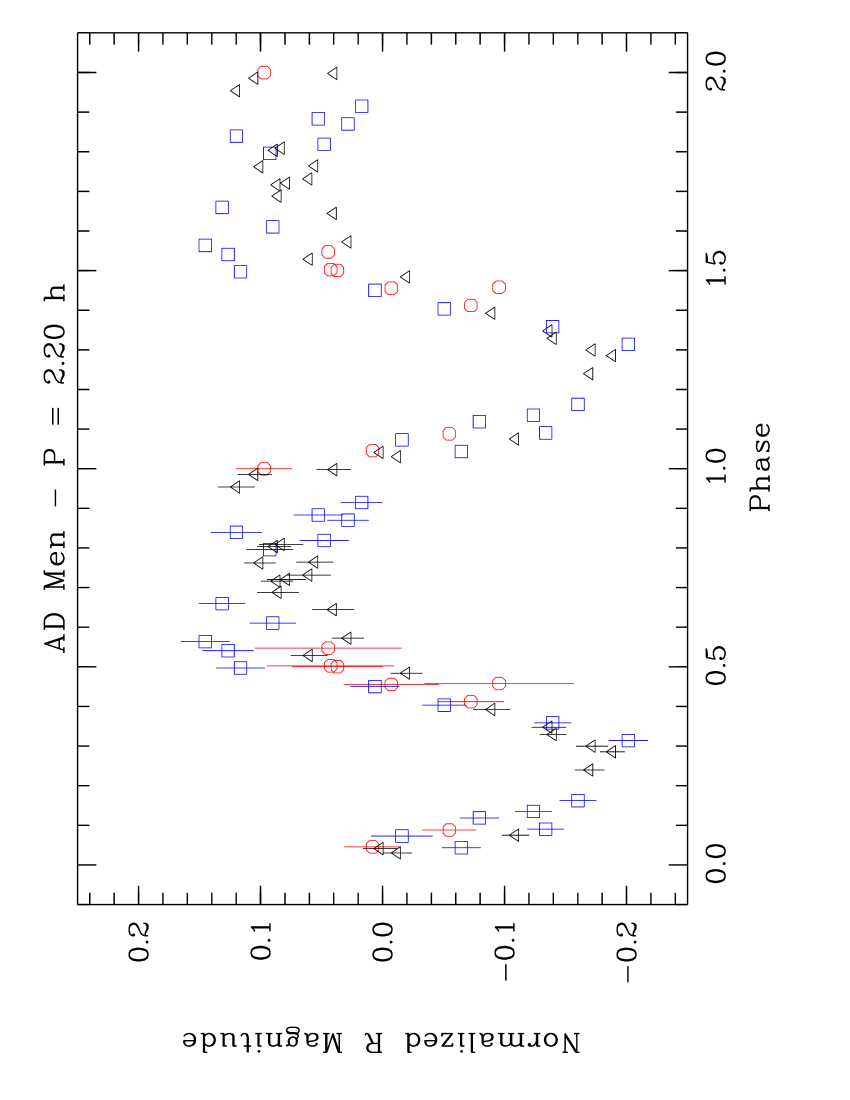
The resulting light curve for AD Men is given in Fig. 1. It clearly shows the presence of a periodic feature in the form of a hump with an amplitude of 0.3 mag. From this photometric variability, we can already confirm the assumption that AD Men is a system at rather high inclination (Tappert & Schmidtobreick, tapp+05 (2005)). However a suspected inclination as high as can be ruled out due to the absence of eclipses in the light curves.
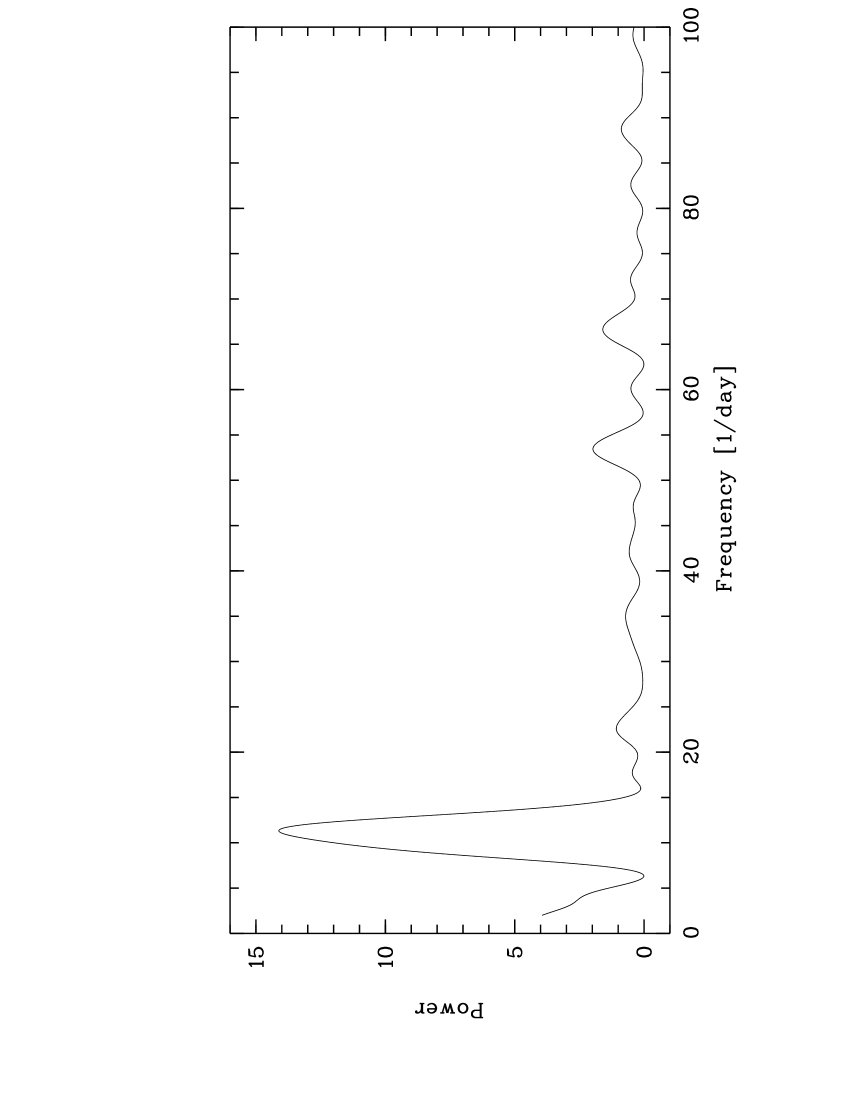
In order to examine the periodicity, the nightly average magnitude was subtracted from the individual light curves, and the resulting normalised data set was analysed with the Scargle and analysis-of-variance (AOV) algorithms implemented in MIDAS (Scargle scar82 (1982), Schwarzenberg-Czerny schwa89 (1989)). Both methods agree on exactly the same period (Fig. 2). The uncertainties in these values were estimated by approximating the peak in the Scargle periodogram by a Gauss function and calculating . Fig. 3 shows the normalised light curve folded with this period. While the width of the hump is very similar for all three nights, its shape shows nightly variations, probably due to flickering.
There are two principal explanations for the periodic variation:
(1) The hump is caused by the bright spot, i.e. the impact site of the mass stream from the secondary star on the accretion disc. In this case, represents the orbital period, placing the system inside the period gap. Note that, although it is also possible that the periodic variation is due to the superhump phenomenon, we consider this as very unlikely, since the system was at least close to quiescence during our observations, and neither the spectroscopic data nor the long-term behaviour indicate a high mass-transfer CV.
(2) The light curve is the result of an ellipsoidal modulation due to a deformed, elongated secondary, which gives a maximum in the light curve when seen along the minor axis and a minimum when seen along the major axis. In this picture, the orbital period would result as twice the photometric one: h.
The presence of flickering somewhat favours the first possibility, since the light from an accretion disc usually dominates the contribution from the secondary star. Furthermore, following the method described by McClintock et al. (mccl+83 (1983)) with the limb-darkening values of Claret (clar98 (1998)), we find that a very late–type secondary (M5 or later) would be needed, if the observed light variation with an amplitude of mag was interpreted as being due to ellipsoidal variation.
Such a secondary is rather unlikely for a system with h where slightly earlier spectral types are expected (Beuermann et al. beue+98 (1998), Harrison et al. 2005a , and others herein). Besides, a secondary star that dominates the orbital light curve should also be easily visible in the optical spectrum. This, however, is clearly not the case (Tappert & Schmidtobreick tapp+05 (2005)).
All evidence therefore points to the observed hump being caused by the bright spot, and the orbital period resulting to h. However, since this places the system at an extraordinary position in the period distribution of CVs, i.e. inside the sparsely populated period gap, one would prefer a spectroscopic confirmation of this interpretation.
3 The spectroscopy
We performed follow–up spectroscopic observations with the aim of determining the variation in radial velocities of the H emission line. As these trace unambiguously the orbital motion of the emission–line source, they will confirm either of the two values for the orbital period.
3.1 Observation and data reduction
The observations were performed on 2005-01-27 using EMMI on the NTT at La Silla, Chile. A total of 54 spectra has been taken with an individual exposure time of 300 s. Thus, a time span of about 5 h has been covered, allowing to distinguish between the two possibilities that are suggested by the light curves.
The standard reduction of the data has been performed using IRAF. The overscan has been subtracted and the data have been divided by a flat field, which was normalised by fitting Chebyshev functions of high order. The spectra have been optimally extracted (Horne horn86 (1986)). Wavelength calibration yielded a final resolution of 0.39 nm FWHM.
For all further analysis, the MIDAS package and routines written by the authors have been used.
3.2 The radial velocity curve
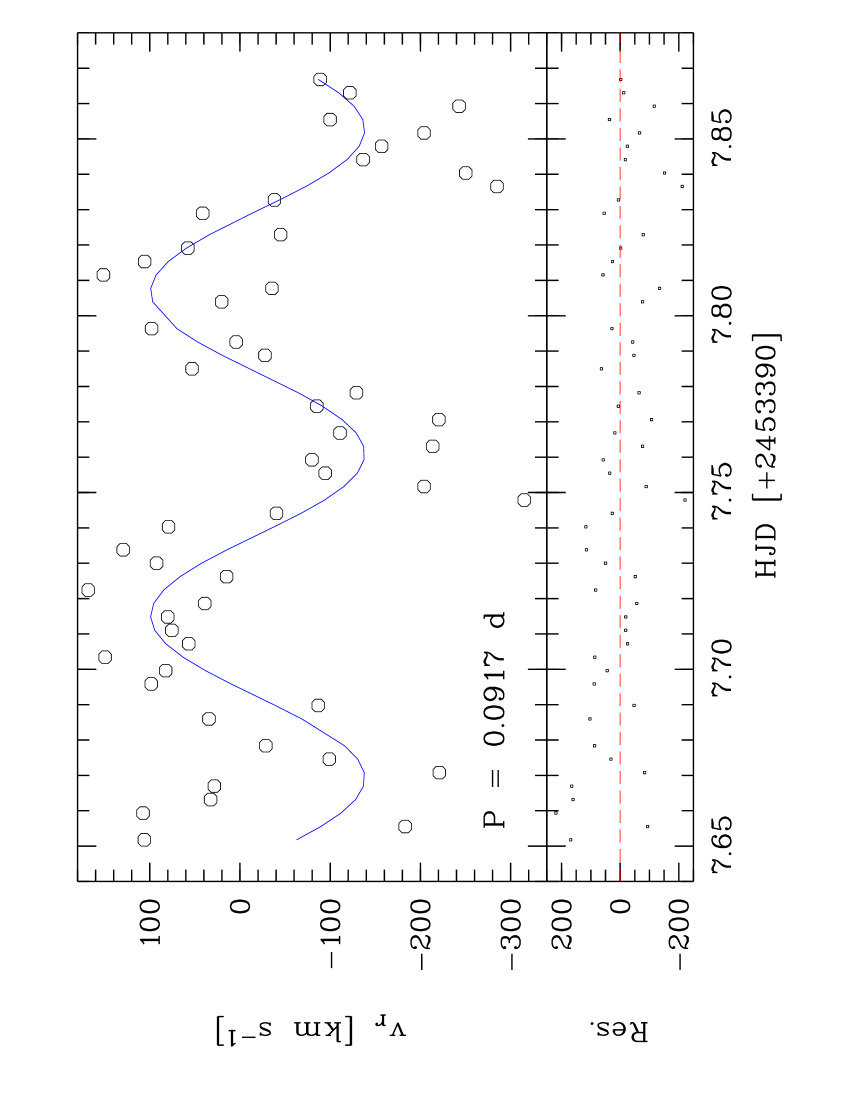
Since the original data mostly have very poor S/N due to variable weather conditions, the spectra were smoothed by a continuous averaging over 7 pixels. Radial velocities have then been determined by fitting a broad Gaussian to the H line. The resulting values are presented in Fig. 4.
Time-series analysis was performed using the Scargle and AOV algorithms implemented in MIDAS. As expected for data that cover one or two orbits within a single night, the periodograms show a broad maximum, in both cases centred on a frequency corresponding to h. Within the errors, this value corresponds well with h, and we have therefore used this latter, more precise, value to fold the data. The best fit to the data was computed using a minimum-of-variance method on the sine function
| (1) |
where is the measured radial velocity and the phase with respect to . The fitting parameters are the system velocity , the semi-amplitude of the radial velocity, and the phase shift for the red-to-blue crossing on the velocity curve with respect to the first data point (HJD = 2 453 397.6518).
The stability of the fit has been tested using Monte-Carlo simulations which also yield the uncertainties of the individual quantities. We thus derive the following parameters: km/s, km/s, and . Note that Tappert & Schmidtobreick (tapp+05 (2005)) derived a lower limit of km/s from spectra covering about 0.6 h, in excellent agreement with the here obtained value.
The residuals corresponding to the fit show a slight linear slope over the observed time range (Fig. 4), which is probably due to the variation in airmass during the observations. Correcting for this slope yields h, and thus does not cause a significant change of the derived period within its accuracy.
4 Conclusion
| Object | Subtype | [d] | [h] |
|---|---|---|---|
| BX Pup | Z Cam | 0.127 | 3.05 |
| V478 Her | SU UMa | 0.120 * | 2.88 |
| TU Men | SU UMa | 0.117 | 2.81 |
| V405 Vul | SU UMa | 0.112 * | 2.69 |
| AX Cap | SU UMa | 0.110 * | 2.64 |
| MN Dra | ER UMa | 0.104 | 2.50 |
| J1702+3229 | 0.104 | 2.50 | |
| NY Ser | SU UMa | 0.098 | 2.35 |
| V725 Aql | SU UMa | 0.094 * | 2.26 |
| AD Men | 0.092 | 2.20 | |
| V589 Her | SU UMa | 0.091 * | 2.18 |
*: the orbital period has been estimated from the observed superhump period using the empirical relation given by Stolz & Schoembs (stol+84 (1984)).
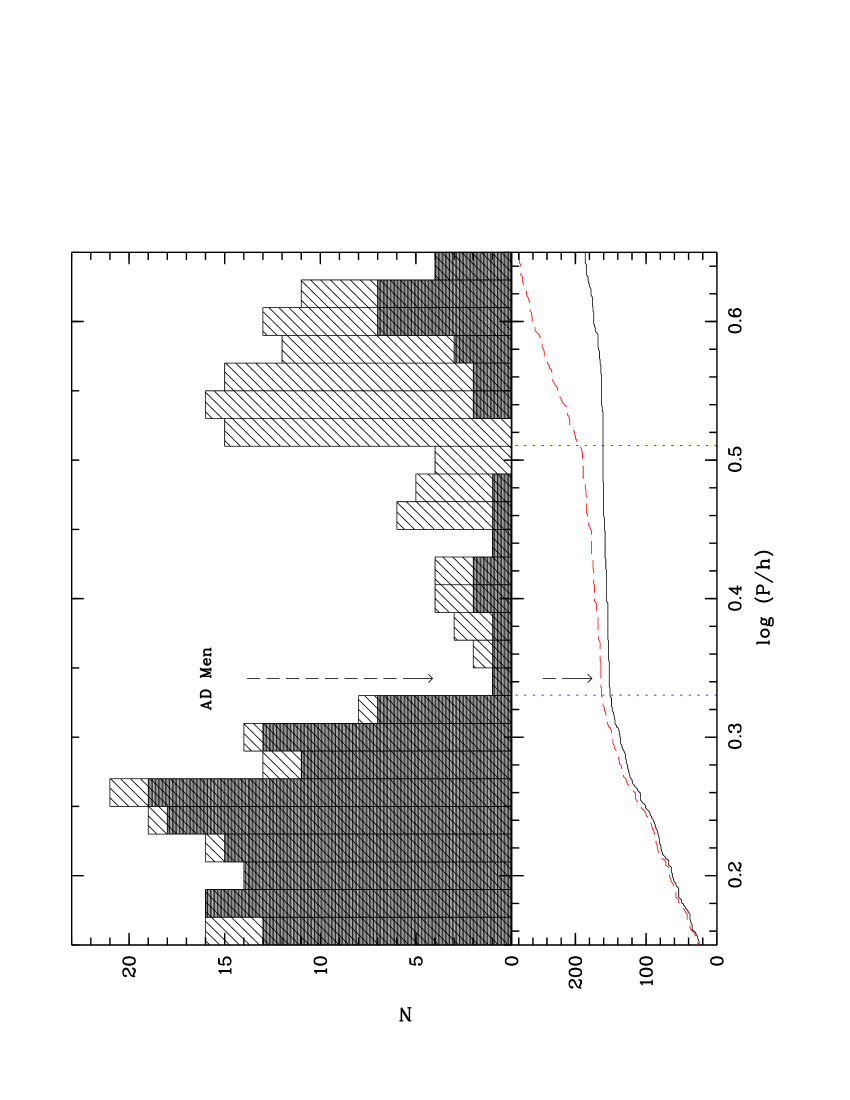
The photometric and the spectroscopic data show variations that are modulated with periods h and h, respectively. The uncertainty in the spectroscopic period is such that it still leaves some ambiguity with respect to the interpretation of the photometric modulation. In principle, this modulation could be due to the occurrence of superhumps from a precessing disc, and the orbital period would then result a few percent shorter than (e.g., Patterson patt98 (1998)). However, since the data do not provide further supporting evidence for this assumption, we here take as the orbital period.
Either case places AD Men at the lower edge of, but clearly within, the period gap of CVs (Fig. 6). We here have defined the period gap from the Ritter & Kolb (ritt+03 (2003)) data on the long period end via the general increase of CVs at an orbital period of 3.24 h, and on the lower side at 2.14 h. The gap appears broader for dwarf novae, reaching up to about 3.4 h, with this upper limit not being well defined due to the low number of dwarf novae above the gap. AD Men now increases the number of known dwarf novae in the period gap to 11 (Table 1), being one of the six systems that have their orbital period measured directly. For the remaining five, this parameter has been derived from the observed superhump period, using the empirical relation given by Stolz & Schoembs (stol+84 (1984)).
5 Discussion
The general assumption is that the systems in the period gap have formed there, i.e. they have reached their CV configuration at an orbital period close to the present one. Their secondary stars have not undergone the structural changes that are supposed to lead to the cessation of mass transfer, and thus to the existence of the period gap (Rappaport et al. rapp+83 (1983), Spruit & Ritter spruritt83 (1983)).
Instead, they probably have been acting as donors for shorter times than secondaries outside the gap. Furthermore, they are supposed to be fully convective, thus a mixing between the inner and outer layers of the star takes place. Secondaries of CVs born above the period gap instead have undergone a stripping of the outer material, and expose peculiar abundances as the inner layers become visible. Such abundances have been observed in non–magnetic CVs above the gap (e.g. Harrison et al. 2004a ; Harrison et al. 2004b ; Harrison et al. 2005a ). For systems with an orbital period below 3 h, such observations have been restricted to magnetic CVs (e.g. Harrison et al. 2005a ), where indeed no peculiarities are observed. However, this might be due to the magnetic nature of the stars (see Harrison et al. 2005b for a discussion).
Detailed observations of the secondary stars in non–magnetic, gap-born CVs are still missing, basically due to the general difficulties in disentangling this component from the other light sources in CVs but there is hope that with the growing number of CVs in the gap, one or the other will qualify for a more thorough research.
Acknowledgements.
We are grateful to Jorge Melnik for granting the time for the spectroscopic follow–up observations and to Valentin Ivanov for conducting them in service mode. We acknowledge the intense use of the SIMBAD database operated at CDS, Strasbourg, France. This work has been partly supported by FONDECYT grant 1051078. We would also like to thank the referee, Hans Ritter, for valuable comments.References
- (1) Beuermann, K., Baraffe, I., Kolb, U., Weichhold, M. 1998, A&A 339, 518
- (2) Claret, A. 1998, A&A 335, 647
- (3) Downes, R.A., Shara, M.M. 1993, PASP 105, 127
- (4) Downes, R.A., Webbink, R.F., Shara, M.M. 1997, PASP 109, 345
- (5) Downes, R.A., Webbink, R.F., Shara, M.M., Ritter, H., Kolb, U., Duerbeck, H.W. 2001, PASP 113, 764, living edition
- (6) Harrison, T.E., Howell, S.B., Johnson, J.J., Osborne, H.L., Homeier, D., 2004a, RevMexAA 20, 249
- (7) Harrison, T.E.,Osborne, H.L., Howell, S.B. 2004b, AJ 127, 3493
- (8) Harrison, T.E.,Osborne, H.L., Howell, S.B. 2005a, AJ 129, 2004
- (9) Harrison, T.E., Howell, S.B., Szkody, P., Cordova, F.A., 2005b, ApJ 632, L123
- (10) Horne, K. 1986, PASP 98, 609
- (11) McClintock, J.E., Petro, L.D., Remillard, R.A., Ricker, G.R. 1983, ApJ 266, L27
- (12) Patterson, J. 1998, PASP, 110, 1132
- (13) Payne-Gaposchkin, C.H. 1971, The variable stars of the Large Magellanic Cloud, Smithsonian Contributions to Astrophysics, Washington
- (14) Rappaport, S., Joss, P. C., Verbunt, F. 1983, ApJ, 275, 713
- (15) Ritter, H., Kolb, U. 2003, A&A, 404, 301 (update RKcat7.4)
- (16) Scargle, J.D. 1982, ApJ 263, 835
- (17) Schwarzenberg-Czerny, A. 1989, MNRAS 241, 153
- (18) Spruit, H. C. & Ritter, H. 1983, A&A, 124, 267
- (19) Stetson, P.B. 1992, in: Astronomical Data Analysis Software and Systems I, ed. D.M. Worrall, C. Biemesderfer & J. Barnes, ASP Conf. Ser., 25, p.291
- (20) Stolz, B., Schoembs, R. 1984, A&A 132, 187
- (21) Tappert, C., Schmidtobreick, L. 2005, IBVS 5587
- (22) Warner, B. 1995, Cataclysmic Variable Stars, Cambridge University Press
- (23) Zwitter, T., Munari, U. 1995, A&AS 114, 575