ACCRETION COLUMN STRUCTURE OF MAGNETIC CATACLYSMIC VARIABLES FROM X-RAY SPECTROSCOPY
Abstract
Using Chandra HETG data we present light curves for individual spectral lines of Mg XI and Mg XII for EX Hydrae, an intermediate-polar type cataclysmic variable. The Mg XI light curve, folded on the white dwarf spin period, shows two spikes that are not seen in the Mg XII or broad-band light curves. Occultation of the accretion column by the body of the white dwarf would produce such spikes for an angle between the rotation axis and the accretion columns of and a height of the Mg XI emission above the white dwarf surface of white dwarf radii or km. The absence of spikes in the Mg XII and broad-band light curves could then be explained if the bulk of its emission forms at much larger height, white dwarf radii or km, above the white dwarf surface, although this is not consistent with the predictions of the standard Aizu model of the accretion column.
1 Introduction
In magnetic cataclysmic variables (CVs) the primary is a highly magnetized (–100 MG) white dwarf whose field controls the accretion flow close to the white dwarf, leading to a shock and accretion columns that radiate mainly in X-rays. Unfortunately, the size scales associated with these shocks and subsequent cooling flows are small, on the order of the white dwarf radius or smaller and hence impossible to resolve spatially with any instrumentation available today. This is unfortunate, because measurements of the density and temperature structure in accretion columns would provide valuable data with which to test our understanding of accretion models and the many physical processes involved. Through eclipse mapping (Horne, 1985), Doppler tomography (Marsh & Horne, 1988), Stokes imaging (Potter et al., 1998), and Roche tomography (Dhillon & Watson, 2001) the companion, accretion disk/stream/curtain, and magnetic foot points have all been mapped. A similar treatment of the accretion column has not been possible until now.
EX Hydrae is the brightest intermediate polar (IP) type CV in the sky, with a reliable inclination (, Beuermann et al., 2003; Hoogerwerf et al., 2004) determined from the partial eclipse in its light curve. The X-ray light curves of EX Hya, folded on the white dwarf spin period, 68 min, show a sinusoidal modulation of increasing amplitude with wavelength. Two models have been suggested for this modulation. The first is the accretion curtain model (Rosen et al., 1988), in which the pre-shock material absorbs the emission created in the post-shock region. Since the pre-shock material is confined by the magnetic field, its projected column density changes as the white dwarf rotates, hence changing the amount of absorption (see figures 7 and 8 of Rosen et al., 1988). The second is the occultation model (e.g., Allan et al., 1998; Mukai, 1999), in which the modulation is due to occultation of the emission by the body of the white dwarf. Unfortunately, using broadband light curves, as has been done in the past, it is impossible to distinguish between the two models.
Using individual spectral-line light curves can break the degeneracy between the accretion curtain model and the occultation model. In this letter, the X-ray light curve of individual spectral lines of He-like Mg XI is used, in the context of the occultation model, to determine the angle of the accretion column and the height above the white dwarf surface of the emission region. With increased signal-to-noise ratio (SNR), this new diagnostic technique could be applied to lines that form at different temperatures and densities. Such an analysis would enable a mapping of the distribution of line emissivities, and hence the temperature and density structure, along the accretion column.
2 Observations, Reduction, and Light Curves
EX Hya was observed by Chandra using the High Energy Transmission Grating (HETG) in combination with the Advanced CCD Imaging Spectrometer in its spectroscopy layout (ACIS-S) on 2000 May 18 for 60 ks (ObsID 1706). The observation was continuous and covers 10 orbital revolutions of the binary system and 15 white dwarf revolutions. We reduced the data using the Chandra Interactive Analysis of Observations (CIAO version 3.0) software package111http://cxc.harvard.edu/ciao/.
Light curves were constructed using the CIAO tool dmextract. We generated three first-order Medium Energy Grating (MEG) light curves: (1) a Mg XII light curve, (2) a Mg XI light curve, and (3) a continuum light curve extracted from regions near the Mg lines that are free of spectral lines. The exact wavelength ranges used to create the light curves are 8.3962–8.4476 Å for Mg XII, 9.1457–9.1917 and 9.2052–9.2542 for Mg XI, and 8.0190–8.0674 and 8.4476–8.5060 for the continuum.
Figure 1 shows light curves for Mg XII, Mg XI, and the line-free continuum as a function of the white dwarf spin phase, using the optical ephemeris of Hellier & Sproats (1992). The times corresponding to the partial eclipses in the binary light curve (Hoogerwerf et al., 2005) have been removed from these light curves. Furthermore, the light curves are plotted in flux units to facilitate direct comparison. All three light curves show the sinusoidal behavior noted in earlier studies (e.g., Rosen et al., 1988; Allan et al., 1998) and usually explained as due to either the accretion curtain or occultation (see § 1).
In addition to the broad modulation, the Mg XI light curve shows two sharp spikes near spin phases and that have not been reported before. The spike at is significant at 2.9 and the spike at is significant at 3.6 . Light curves for other He-like spectral lines, most notably S, Si, and Ne, also show spikes at the same spin phases but at lower () significance levels.
We note that none of the Mg XII, Mg XI, or continuum light curves are centered around , the expected spin maximum from the Hellier & Sproats (1992) optical ephemeris. This discrepancy could indicate either a difference in the variations in optical and X-ray emission (see, e.g., Belle et al., 2005) or that the ephemeris needs to be updated. It is unclear from this dataset which explanation is the more likely cause of the disagreement. In the remainder of the letter, we assume that the maximum of the sinusoidal modulation occurs when the upper accretion column points away from the observer, consistent with the predictions of both the accretion curtain and occultation models.
This is not the first time that light curve information for individual spectral lines has been used to determine physical properties of the accretion column of a magnetic CV. Terada et al. (2001), using ASCA data for the polar V834 Cen, showed that the high optical depth in the Fe K line resulted in anisotropic radiation transfer through the accretion column, collimating the Fe K emission. This collimation was detected as a rotational modulation in V834 Cen Fe K light curve.
3 Occultation Model
To explain the spikes in the Mg XI light curve and the absence of spikes in the Mg XII light curve requires that we consider the specific conditions, chiefly the temperature () and density () of the emitting plasma, under which a spectral line is produced. In the remainder of this letter we assume that (1) the X-ray emitting plasma is contained within the two accretion columns of EX Hya, (2) the two accretion columns point radially away from the white dwarf at an angle to the white dwarf spin axis, (3) the plasma is heated to keV (Fujimoto & Ishida, 1997) by a stand-off shock at some distance above the surface of the white dwarf, and subsequently cools while settling onto the surface of the white dwarf, and (4) the accretion columns are optically thin in the continuum and lines.
In the standard model for accretion onto a white dwarf, the Aizu (1973) model, the hot, fully ionized, shocked plasma cools by thermal Bremsstrahlung alone. However, other cooling processes, e.g., cooling by line emission or thermal conduction, also act on the plasma and will result in deviations in the temperature profile from the standard model. While the plasma cools and flows down towards the white dwarf surface it recombines, producing a stratified ionization state distribution with height. Given that spectral lines form under specific physical conditions, i.e., temperature, density, and ionization state, we can assume that each spectral line is formed at a specific height, or a range of heights, above the white dwarf surface. Combining this assumption with the fact that spectral lines formed near the surface are more likely to be occulted by the white dwarf as it rotates than lines that are formed high above the surface, we naturally expect variations in the shape of spectral-line light curves with height above the white dwarf.
To develop the occultation model, we begin with the simplifying assumption that all emission originates from an infinitesimally small point in space. To calculate the light curves produced by sources of emission above the surface of the white dwarf, we assume that (a) the white dwarf is represented by a sphere and is viewed at an inclination , where coincides with a viewing angle perpendicular to the rotation axis of the white dwarf and (b) the emission is located at a height , expressed in white dwarf radii , above the surface at a latitude and longitude . For this situation, the source of emission will be visible to an observer at white dwarf spin phase when the following condition is satisfied:
| (1) |
In the remainder of the letter we use the inclination appropriate to EX Hya (Beuermann et al., 2003; Hoogerwerf et al., 2004). We also assume that the accretion columns are represented by cylinders that are perpendicular to the white dwarf surface and that the diameters of the cylinders are very small compared to the white dwarf radius. Furthermore, we assume that the angle represents the misalignment between the white dwarf’s rotation axis and the accretion region, i.e., represents the latitudes of the accretion column and , where is the dipole offset and is the the magnetic colatitude (see e.g., Allan et al., 1998). We ignore the effects of absorption by the accretion curtains, which produces the broad sinusoidal variation seen in Figure 1.
With these assumptions, the emission from the lower accretion column is occulted by the white dwarf for most of the time and is visible only around , i.e., when the lower column points towards the observer. The emission from the upper column behaves in the opposite manner. There are two limiting cases: one where the emission is on the surface () and the other where the emission is far above the surface (). In the former case, only one of the emitting spots is visible at any time; the moment one spot disappears from view the other appears. This will result in a flat light curve. In the latter case, both spots of emission will be visible at all times (except in the case of ), also resulting in a flat light curve, but at twice the flux level as compared to the case, since both columns are visible at all times.
There are two critical heights in this model. First is the height above the surface below which occultation occurs for the upper accretion column: . Emission at will not produce double-spiked light curves since the upper accretion column is visible at all times. Second is the height above the surface below which occultation occurs for the lower accretion column: . Using similar arguments as above, emission at will produce completely flat light curves since . For emission at , two spikes will be visible in the light curve. To illustrate the model, we show how the upper and lower accretion columns are visible/occulted and how each contributes to the total light curve.
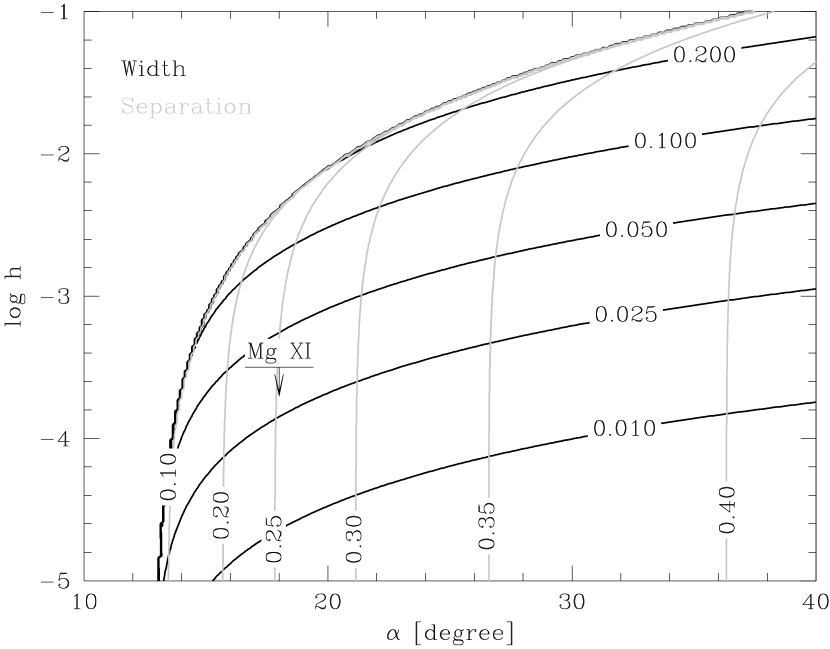
Figure 2 shows the light curve for two spots of emission: one located in the upper accretion column at , , and and the other located in the lower accretion column at , , and , i.e., (these values correspond to the results presented later in this letter). With this configuration, the upper accretion column points away from the observer at , as predicted by both the accretion curtain and occultation models. In Fig. 2 we have denoted as the width of one of the spikes (both spikes are identical due to reasons of symmetry) and as the separation between the two spikes. In the limit that tends to 0 we find that while in the limit that tends to we find that , i.e., increases monotonically with . The details of the relationship between and depends on the inclination, but will also increase monotonically with .
Figure 3 shows contours of equal (black) and equal (gray) as a function of and for the inclination of EX Hya. By measuring the width (this is an upper limit since the whole spike fits in one phase bin) and separation of the spikes in Fig. 1, we are able to determine (1) the angle between the rotation axis and accretion columns and (2) the height of the emission above the white dwarf surface or km for a white dwarf radius of cm (Beuermann et al., 2003; Hoogerwerf et al., 2004). We can directly compare to (dipole offset plus magnetic colatitude) from Allan et al. (1998), who find that this angle can not be larger than , consistent with our result. Furthermore, the absence of spikes in the Mg XII light curves suggests that the Mg XII emission in at least one of the accretion columns is not occulted by the body of the white dwarf. Consequently, most of the Mg XII emission must originate above .
4 Discussion and Conclusions
In realistic accretion column models, the emission from a spectral line does not originate from a point, but is distributed over a range of heights in the column depending on the particulars of the density and temperature profile. Hence, a spectral-line light curve can be calculated by convolving the point source occultation model with the line intensity vs. height profile, calculated from the temperature and density profile in the accretion column as , where is the emissivity of the line in .
The simplest model for and for radial accretion onto a white dwarf is presented by Aizu (1973). The model assumes that the shock height is small compared to the white dwarf radius so that gravity can be assumed to be constant, and considers cooling only by thermal Bremsstrahlung. The line intensity curves for the Aizu model are presented in Figure 4 of Fujimoto & Ishida (1997). They show that the He-like ion line intensity curves peak below those of the H-like ions, and that the H-like ion line intensity curves have long tails that extend to large heights above the white dwarf surface. Both features tend to produce H-like line light curves that are more featureless than the He-like line light curves, but the difference is not sufficient to explain the Chandra observations of the Mg line light curves: assuming that the Aizu model describes the run of and in the accretion column, we find that the occultation model predicts that both He-like and H-like line light curves will show spikes. Given that we found that the He-like Mg XI line light curve shows spikes, but that the H-like Mg XII does not, we tentatively conclude that the Aizu model does not produce the and profiles in the accretion column of EX Hya, and that modifications to the Aizu model must be considered.
Several improvements to the Aizu model have been made in recent years. Wu et al. (1994) extended the model by including the effects of cyclotron cooling, but these effects should be insignificant in EX Hya because of its weak magnetic field (0.2 MG; Eisenbart et al., 2002). Cropper et al. (1999) included the effects of gravity on the accretion column structure, finding lower shock temperatures and flatter temperature profiles. Such a model may apply to EX Hya, which other evidence suggests may have tall shocks (Allan et al., 1998). If so, EX Hya may have more hot material at large heights above the white dwarf surface, which could increase the Mg XII for large and thereby reduce the spikes in its light curve. Wu & Cropper (2001) calculated the effects on the accretion column structure due to heating by the stellar surface and mass leakage at the base of the column. Changes to the integrated X-ray spectra were neglible unless the thickness of the mass leakage region approaches or exceeds 1% of the shock height, but large variations are produced in the and profiles at heights where the Mg line emissivities nominally peak. Canalle et al. (2005) included the influence of the curvature of the magnetic field on the and profiles, finding that compressional heating due to the field geometry is as important as radiative cooling and gravity in determinning the structure of the post-shock flow. All the papers above employ the same closed integral-form solution to solve the differential equations that describe the accretion column structure. Other processes that influence the and profiles such as electron-ion equilibration (Saxton et al., 2005) and thermal conduction (Spitzer, 1962) can be included in hydrodynamical simulations. All these improvements to the Aizu model change the temperature and density profiles and hence change the spectral-line light curves, making it possible, provided sufficient SNR, to use these light curves to constrain the run of and and hence test the importance of various processes in the model.
We presented, for the first time, white dwarf spin phase resolved light curves for individual spectral lines for the bright IP EX Hya. The light curves for Mg XI show spikes never seen before; two spikes around the maximum of the light curve. The width and separation of Mg XI light curve spikes allows for a determination of (1) the angle between the rotation axis and the accretion columns , (2) the height at which the Mg XI emission formed, , or km for a white dwarf radius of cm. Since each spectral line is formed at a different temperature and density and hence at a different height, this type of light curve analysis can be used to map the distribution of line emissivities, and hence the temperature and density structure, along the accretion column of magnetic cataclysmic variables. Such a detailed analysis of the accretion column of EX Hya is feasible today with Chandra, but requires a long dedicated (500 ks) observation to acquire sufficient photons to make high SNR, high time-resolution light curves for many spectral lines spanning a wide range of formation temperatures. The high spectral resolution of Chandra is critical, since it dramatically reduces (1) the contribution of the continuum to the spectral-line light curves and (2) the effects of blending, especially blending of lines formed at different temperatures. Future X-ray missions, such as Constellation-X, which have an order-of-magnitude larger collecting area and similar or better spectral resolution compared to the HETG instrument on Chandra, will be ideally suited to apply spectral-line light curves techniques to a large sample of magnetic CVs. An independent measurement of the temperature and density structure of accretion column of magnetic CVs will be a valuable tool in the study of shock physics and accretion onto compact objects in general.
References
- Aizu (1973) Aizu, K., 1973, Prog. Theor. Phys., 49, 1184
- Allan et al. (1998) Allan, A., Hellier, C. H., & Beardmore, A., 1998, MNRAS, 295, 167
- Belle et al. (2005) Belle, K. E., Howell, S. B., Mukai, K., Szkody, P., Nishikida, K., Ciardi, D. R., Fried, R. E., & Oliver, J. P., 2005, AJ, 129, 1985
- Beuermann et al. (2003) Beuermann, K., Harrison, T. E., McArthur, B. E., Benedict, G. F., & Gänsicke, B. T., 2003, A&A, 412, 821
- Canalle et al. (2005) Canalle, J. B. G., Saxton, C. J., Wu, K., Cropper, M., & Ramsay, G., 2005, A&A, 440, 185
- Cropper et al. (1999) Cropper, M., Wu, K., Ramsay, G., & Kocabiyik, A., 1999, MNRAS, 306, 684
- Dhillon & Watson (2001) Dhillon, V. S., & Watson, C. A., 2001, in LNP, 573, Astrotomography, Indirect Imaging Methods in Observational Astronomy, ed. H. Boffin, & D. Steeghs (Springer, Berlin), 94
- Eisenbart et al. (2002) Eisenbart, S., Beuermann, K., Reinsch, K., & Gänsicke, B. T., 2002, A&A, 382, 984
- Fujimoto & Ishida (1997) Fujimoto, R., & Ishida, M., 1997, ApJ, 474, 774
- Hellier & Sproats (1992) Hellier, C., & Sproats, L. N., 1992, IBVS, 3724, 1
- Hoogerwerf et al. (2004) Hoogerwerf, R., Brickhouse, N. S., & Mauche, C. W., 2004, ApJ, 610, 411
- Hoogerwerf et al. (2005) Hoogerwerf, R., Brickhouse, N. S., & Mauche, C. W., 2005, ApJ, 628, 946
- Horne (1985) Horne, K., 1985, MNRAS, 213, 129
- Marsh & Horne (1988) Marsh, T. R., & Horne, K., 1988, MNRAS, 235, 269
- Mukai (1999) Mukai, K., 1999, in ASP Conf. Ser., 157, Annapolis Workshop on Magnetic Cataclysmic Variables, ed. C. Hellier, & K. Mukai (San Fransisco: ASP),33
- Potter et al. (1998) Potter, S. B., Hakala, P. J., & Cropper, M., 1998, MNRAS, 297, 1261
- Rosen et al. (1988) Rosen, S. R., Mason, K. O., & Córdova, F. A., 1988, MNRAS, 231, 549
- Saxton et al. (2005) Saxton, C. J., Wu, K., Cropper, M., & Ramsay, G., 2005, MNRAS, 360, 1091
- Spitzer (1962) Spitzer, L., 1962, Physics of Fully Ionized Gases, 2nd edn. (New York: Interscience)
- Terada et al. (2001) Terada, Y., Ishida, M., Makishima, K., Imanari, T., Fujimoto, R., Matsuzaki, K., & Kaneda, H., 2001, MNRAS, 328, 112
- Wu et al. (1994) Wu, K., Chanmugam, G., & Shaviv, G., 1994, ApJ, 426, 664
- Wu & Cropper (2001) Wu, K., & Cropper, M., 2001, MNRAS, 326, 686