Mapping Global Star Formation in the Interacting Galaxy Pair ARP 32
Abstract
A multi-wavelength set of photometric data including UV (GALEX), optical, near-IR, infrared (Spitzer) and radio (VLA 20cm) images and spectroscopic observations are used to map the dust-obscured and unobscured star formation in the galaxy pair ARP 32. The system consists of an actively star-forming galaxy and another one with depressed star formation. The most active galaxy has disrupted morphology and different sites of star formation. Spectroscopic data show hints of nuclear activity in its core, intense star formation in limited regions of the galaxy as well as an underlying population of stars witnessing a past episode of star formation. Current star formation rates are estimated from UV and bolometric IR luminosities.
Spitzer Science Center, California Institute of Technology, MC 220-6, Pasadena, CA 91125
1. Introduction
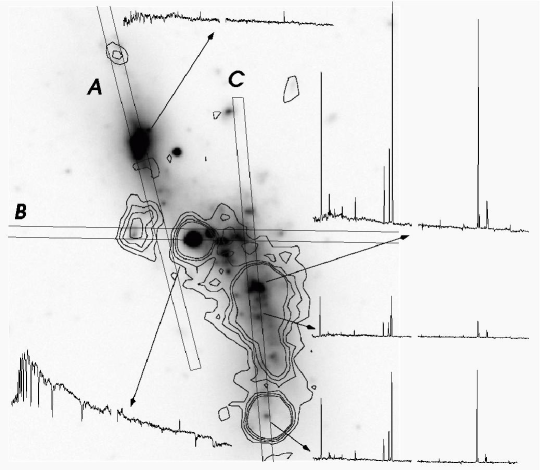
The ARP 32 object (, distance Mpc) consists of two interacting galaxies separated by 40′′ ( Kpc). The system lies in the field observed with Spitzer, VLA, SDSS and GALEX known as First-Look Survey (see, e.g., Fadda et al.2004). Further ancillary data were obtained with the Palomar 200” telescope: J and Ks images with WIRC and long-slit spectra with Double-spec. Finally, a Spitzer observation at 16 m, taken with the IRS blue peak-up array for calibration purposes, was used. Our extended photometric dataset (UV at 1528 Å and 2271 Å, u’,g’,r’,i’,z’, J, Ks, 3.6, 4.5, 5.8 and 8.0 m IRAC, 16 m IRS, 24, 70 and 160 m MIPS and 20 cm VLA) allows us to map the star formation in the system with different techniques. A detailed R image (KPNO-4m, Fadda et al.2004, Fig. 1) was used to identify the knots of infrared emission and to program the spectroscopic observations. The object was observed at three different position angles: P.A. = 14∘ (slit A), P.A. = 88.5∘ (slit B) and P.A. = 4∘ (slit C), with a 2′′ slit to get spectra of all the emission knots visible in the R-band image (Fig. 1). We reduced the spectra with the IRAF packages twodspec and ccdred and extracted apertures corresponding to each knot of emission. The spectra cover the range 3000-8000 Å with dispersions 1.07 Å pixel-1 and 2.45 Å pixel-1 for the blue and the red arm, respectively.
2. Spectroscopy
We measured emission and absorption line fluxes simultaneously using an IDL code to obtain emission line fluxes corrected for the underlying stellar absorption. This mainly affects Balmer lines of the lower companion and, if uncorrected, can lead to big errors in the evaluation of reddening and star formation densities. All line fluxes were measured using multi-Gaussian profile fitting. That enabled us to deblend the H-N II6548,6563 triplet and the S II6716,6731 doublet, which are present in all the extracted spectra. In order to ensure reliable flux measurements, we considered only absorption and emission lines with signal-to-noise ratios (SNR) greater than 3.
Measured fluxes of the emission lines were corrected for dust reddening (i.e., internal extinction) based on the H/H flux ratio (Calzetti 2001). When H fluxes could not be reliably measured, we estimated 3- upper limits from the continuum SNR at 4800 Å assuming a width similar to that of H in other spectra of the same slit.

The measured H/H ratio results in negative values for the broad-band color excess, , in some of the infrared knots. Most of these values are only lower limits since H fluxes could not be reliably measured, but in the nucleus of the lower companion both lines were detected with high SNR values obtaining a negative value. Whenever reddening coefficients were determined to be negative, we assumed the Galactic interstellar extinction to compute reddening-corrected line flux densities (). Corrected line flux densities were used to build Veilleux-Osterbrock (VO) diagnostic diagrams O III 5007/H versus O I 6300/H, NII 6583/H and S II(6716+6731)/H (Kewley et al. 2001), in order to study the nature of ionizing sources in emission-line regions. All emission knots lie in the area of the diagrams occupied by the H II-like regions, except for the nucleus of the lower companion which shows AGN-like features (Fig. 2). Line flux densities were also used to estimate the metallicity of the emission knots, following the algorithm given in Kewley & Dopita (2002). The fact that the nuclear part of the lower galaxy is metal-poor (log(O/H)) could possibly explain the negative values of the broad-band color excess (e.g., Gronwall et al. 2004). Deep Balmer absorption lines are detected in the upper region of the lower galaxy (see Fig. 1) which witness a past episode of star formation.
3. Photometry
Aperture photometry was used to measure the fluxes in all the available passbands for both galaxies. We corrected the obtained fluxes for Galactic extinction and use them to build galaxies’ spectral energy distributions (SED) presented in Figure 3 . In order to compute star formation rates (SFR) based on IR luminosities, we fitted infrared SEDs with Chary & Elbaz (2001) templates. The UV, optical and near-IR part were fitted with the PEGASE (Fioc & Rocca-Volmerange 1997) models. The best fitted model for the upper galaxy corresponds to an elliptical galaxy with older stellar population (5 Gyr) and additional 10-30% of stars younger than 1 Gyr, while the lower galaxy is best fitted with SO galaxy templates with a young (0.5 -1 Gyr) stellar population. Following the equations given in Kennicutt (1998), we used the measured far-UV and IR fluxes to estimate the SFRs in both galaxies. The upper companion seems less active with a SFR value of 0.028 M yr-1 according to its FUV flux and 0.046 M yr-1 based on the integrated 8-1000 m flux from the Chary & Elbaz (2001) best-fit template. The latter value is overestimated since no template fits well the data. SFR values for the lower galaxy are 0.12 M yr-1 and 1 M yr-1 based on FUV flux and integrated IR flux, respectively, showing therefore a large amount of obscured star formation.

References
- Calzetti (2001) Calzetti, C. 2001, PASP, 113, 1449
- Chary & Elbaz (2001) Chary, R., & Elbaz, D. 2001, A&A, 556, 562
- Fadda et al. (2004) Fadda, D., Jannuzi, B. T., Ford, A., Storrie-Lombardi, L. J., 2004, AJ, 128, 1
- Fioc & Rocca-Volmerange (1997) Fioc, M., & Rocca-Volmerange, B. 1997, A&A, 326, 950
- Gronwall et al. (2004) Gronwall, C., Jangren, A., Salzer, J. J., et al., 2004, ApJ, 128, 644
- Kennicutt (1998) Kennicutt, R. 1998, ARA&A, 36, 189
- Kewley et al. (2001) Kewley, L. J., Dopita, M. A., Sutherland, R. S., et al., 2001, ApJ, 556, 121
- Kewley & Dopita (2002) Kewley, L. J., & Dopita, M. A. 2002, ApJS, 142, 35