Galactic Warp in the overdensity of the Canis Major Region
Abstract
Bellazzini et al. (2006b) claim that López-Corredoira et al.’s (2002) warp model is totally unable to reproduce the Canis Major structure in the red clump stars. However, slight variations in the azimuth of the López-Corredoira et al. (2002) warp model, justified by the uncertainties in the parameter as well as the local irregularities with respect to the average model, derive a result much closer to the observations of the overdensity south/north. The bump of red clump stars with –13.5 around , and the depth of the Canis Major structure are also explainable in terms of the warp with an appropriate extrapolation of constant height between galactocentric radii of 13 and 16 kpc, as observed roughly in the southern warp, instead of a monotonically increasing height like the northern warp; and the observed velocity distribution of stars cannot exclude the warp possibility. A warp model is therefore still a possible explanation of the Canis Major overdensity, and the hypothesis of the existence of a dwarf galaxy is unnecessary, although still a possibility too.
keywords:
Galaxy: structure – galaxies: dwarf1 Introduction
Bellazzini et al. (2006b, hereafter B06b)111 I was the referee of this paper for MNRAS and accepted it for publication after a pair of revisions because I considered that the authors had done an interesting analysis which should be known, even though I did not agree with some points. I had recommended the authors to analyze some weak points but they did not follow my advice, so I perform here the analysis of these weak points (§2.1 and 2.2) and some others (§2.3 and 2.4) which I thought of after the acceptance of Bellazzini et al. (2006b). have claimed that the excess of red clump stars in southern with respect to northern galactic latitudes between and 280∘ is most probably associated with a new dwarf galaxy, namely the Canis Major (CMa) galaxy, so that it is far from being explained in terms of the known characteristics of the Galactic warp model derived from the parameters given by López-Corredoira et al. (2002, hereafter L02); they conclude that the warp “is totally unable to reproduce the CMa structure”. Previous papers (e.g. Martin et al. 2004, Martínez-Delgado et al. 2005a) have presented other proofs in favour of the existence of the dwarf galaxy and against the warp possibility. The discussion on the validity of the proofs is a topic of heated debate nowadays, with authors like Momany et al. (2004, 2006[hereafter M06]) arguing that these proofs can also be reproduced by the Galactic warp+flare.
Here, I also want to contribute to the debate showing that slight variations in L02 warp model derive a result much closer to the observations of the overdensity (§2.1). The bump of red clump stars with –13.5 around , (§2.2) and the depth of the Canis Major structure (§2.3) are also explainable in terms of the warp. I shall make a few comments about the velocity distribution of its stars (§2.4).
2 Galactic warp vs. dwarf galaxy hypothesis
2.1 Canis Major overdensity
The height of the L02 warp over the plane defined by the central disc as a function of the galactocentric distance and azimuth is
| (1) |
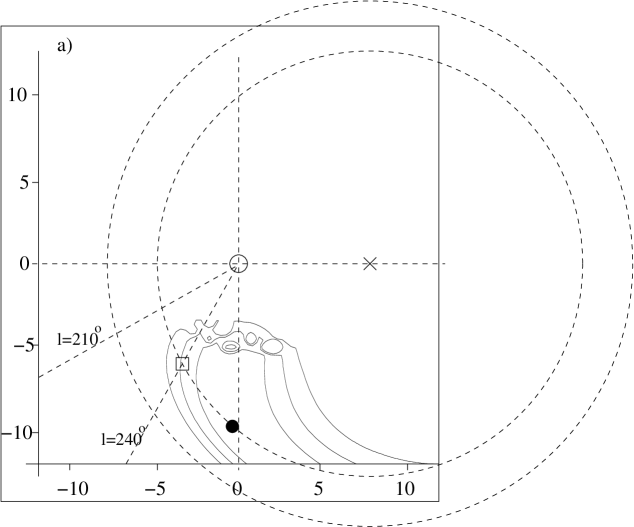
with , and (for the given values of and ; the normalization will change if and/or vary). B06b calculate in their fig. 6(down) the south/north overdensity of the red clump stars, due to this L02 warp and the flared disc parameters given in L02222There is an error in L02: “+15” pc was written in eq. (20) instead of “15”; the correct value is 15 pc because the Sun is “above” the plane. The calculations in L02 were correctly carried out with 15, and the error is just typographical. In any case, this does not affect too much to the analysis of the warp at high values of .. The factor 1.2 was put by B06b to compensate for the average south/north asymmetry. The asymmetry between south and north is not constant, and it is a very bad approximation to take it as B06b does, but I use their expression in order to show that I can roughly reproduce the results of their fig. 6 with the warp. We confirm their results in Figure 1a). Effectively, the maximum of the overdensity is around 270∘ as they claim (and contrary to the claim by M06, who used a different maximum definition and different constraints on region selection), somewhat far from the centre of the observed CMa structure at (B06b, Fig. 6, top).
L02 only give a warp formula for kpc; beyond 13 kpc, different extrapolations are possible. We also make the same plot with a different extrapolation of the L02 model over the range , with a constant height of the warp, , which is more similar to the real gas southern warp (see §2.2). This is shown in Fig. 1b); the result does not change too much. As noted by B06b, the extrapolation beyond 13 kpc is not too important because the CMa feature occurs approximately at this galactocentric distance.
However, some attention should be paid to other parameters of the warp. L02 have given an approximate model of the “average” warp for the whole sky assuming north–south symmetry and a power law for the amplitude of this warp. This assumption is just a first-order approximation since, as is well known, the Galactic warp is not symmetric (Burton 1988; Voskes & Burton 2006, Levine et al. 2006); our warp is somewhere between an L-warp and a S-warp rather than being a pure S-warp. Moreover, the position of the Sun also affects our perspective of the northern and southern warp. Also, there are some other parameters of the disc (galactocentric distance of the Sun, height of the Sun above the plane, flare parameters, scale length, scale height at the Sun galactocentric distance, etc.) whose variations affect the result. Furthermore, the thick-disc component (Cabrera-Lavers et al. 2005), which was not included, could also produce some small variations.
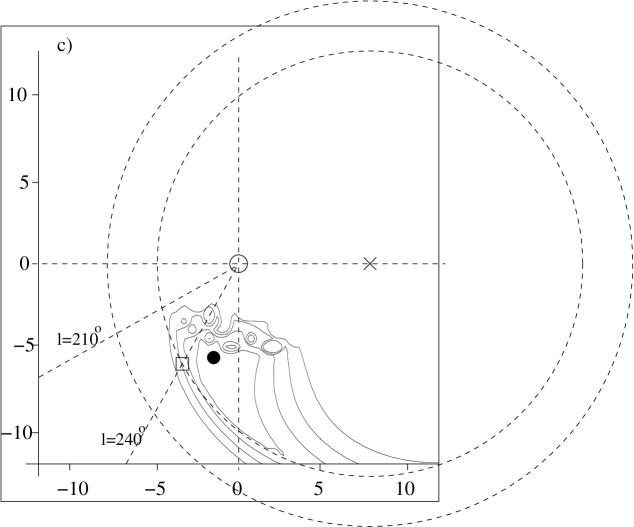
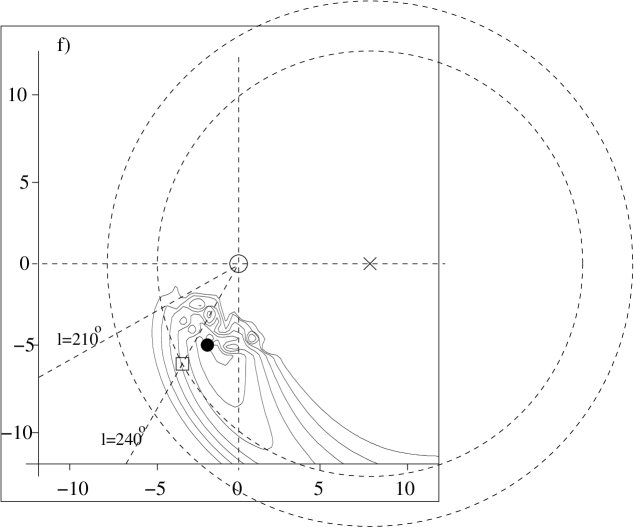
I am not going to explore all the set of parameters here but just the azimuth, , of the warp; that is, the galactocentric angle in which the warp has null amplitude. It was checked that the galactic longitude of the maximum is more sensitive to the changes in than changes in other parameters. For instance, changes in (with the corresponding change in to preserve the amplitude at high ) mainly affect the distance of the maximum overdensity rather than its galactic longitude; also, other changes in the disc or flare have less effect than changes in with galactic longitude. Figures 1c–e show the density maps for angles , instead of the original value given by L02. As observed the variation in the position of the maximum is notable. With (2 from the value given by L02) the angle of the maximum is 248∘. Just to see that the position of the maximum is not so sensitive to slight changes in the shape of the warp, we also performed the calculations with Drimmel & Spergel’s (2001) formula for the warp amplitude ( instead of in expression (1); the result was also 248∘ (Fig. 1f). This galactic longitude is not very far from the observed value of 240-244∘ by B06b, and its distance of 5.4 kpc is somewhat less than the value kpc given by B06b. The distance of the maximum could be changed if the flare, warp and scalelength were rescaled, or if they showed a different dependence on from those given by L02. For instance, a large scalelength for the disc and the flare, and a lower exponent places the maximum farther away.
These plots may be compared in fig. 6 (top) of B06b. The similarity is quite high (although not for larger than 9–10 kpc since in this case the B06b red clump maps are highly contaminated by the dwarf population and are very inaccurate). Taking into account that we have only modified one parameter, the result is not so bad. An angle of is only 2 from the mean value in the fit of the average symmetric warp in the star counts. Other models of the average warp also give similar values: (Freudenreich 1998; Drimmel & Spergel 2001; Robin et al. 2003) or +15∘ (Yusifov 2004, M06).
We must also consider that the error of 5 degrees for in the analysis of L02 is merely statistical, but there might be further systematic errors due, for instance, to errors in the assumed luminosity function of stars, or deviations from equation (1). As M06 say, some uncertainties of the L02 model could also come from gaps in the region around in the data used for the fit. However, M06 are not correct when they claim that the L02 warp is affected by contamination of dwarfs for red clump stars, because L02 do not use red clump stars for the determination of the parameter of the warp but only the total star counts.
As has been said, given the irregularities of the southern warp, it is quite possible that an extra shift in the azimuth in the southern with respect the average L02-warp might occur. Indeed, the analysis by Voskes & Burton (2006) gives precisely the best fit for (warp maximum at ) for their gas warp. The asymmetries in the gas warp (similar to the stellar warp according to L02) are shown by Voskes & Burton (2006) or Levine et al. (2006), which should serve to indicate that there is no unique large-scale symmetric warp model of the type eq. (1); therefore, we cannot extrapolate the exact result at around to the whole Galaxy. Figure 11 of Levine et al. (2006) shows how the line of nodes defined by varies depending on the galactocentric distance and from north to south. Indeed, Levine et al. (2006) explain the asymmetries with a warp dependence
| (2) |
The fact that [the difference is up to 12 degrees according to Levine et al. (2006)] and depending on , causes the equivalent in expression (1) not to be constant. The first term, the mode of , is dominant for kpc, so eq. (1) can be a relatively good approximation, but if we aim to provide an accurate explanation for all the deviations from it, perhaps eq. (1) is insufficient. Here we are not making a fit of the parameters of the global warp ; instead, we are showing that within the uncertainties the warp is compatible with B06b’s plots.
M06 claim that a global and regular warp signature is traced to Galactocentric distances of at least kpc, and the north/south asymmetry, apart from the fact that , is due to the chance location of the northern warp behind the Norma–Cygnus spiral arm. Perhaps this spiral arm is responsible for the asymmetry, but data such as those illustrated in fig. 2 of Levine et al. (2006) show something else: a lower amplitude for the southern warp for kpc (see §2.2), and this is indeed necessary to explain the distribution of sources along the line of sight, something which was not successfully done by M06.
2.2 Bump
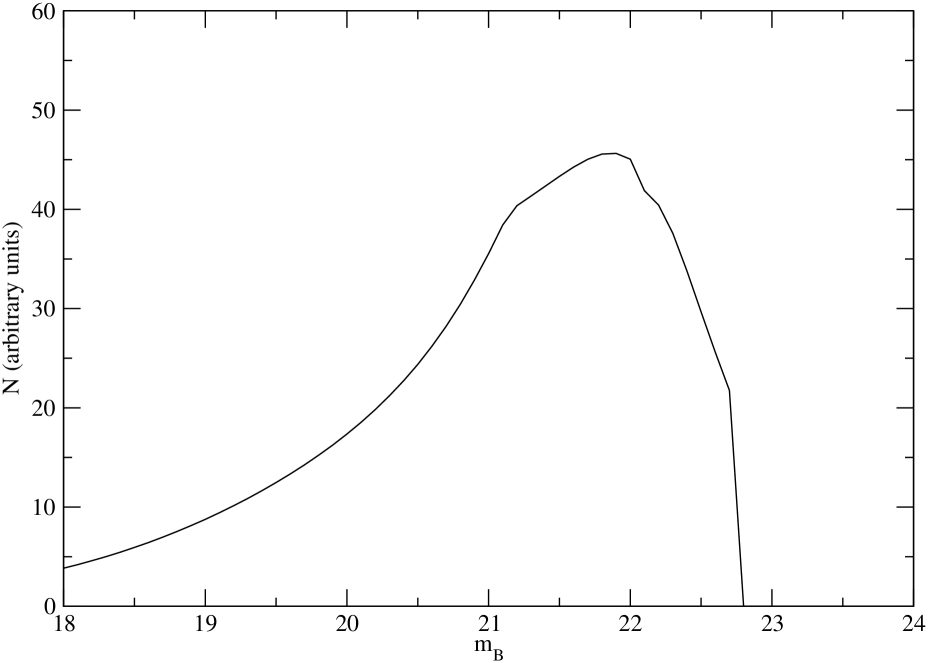
Another comment concerning B06b paper is their claim that the bump in their fig. 1, in the region , , is due to the dwarf galaxy. In this case, they compared it with the predictions of another warp + flare model (Robin et al. 2003) and failed to reproduce it. However, the bump could be explainable in terms of the warp with an appropriate extrapolation for values of kpc. In §2.1, we saw that the extrapolation is not relevant for the position of the maximum overdensity. However, it is relevant if we want to analyse the sources beyond 13 kpc. Taking the southern warp equal to the northern warp is inappropriate because there is an abundance of data for the gas emission of the Galaxy that show the asymmetry. At kpc, the mode becomes important and the extrapolation of the southern and northern warp are not equal. Burton (1988) shows that the southern warp is approximately of constant height between and (beyond is unimportant for our analysis) instead of the monotonically increasing northern warp. Something similar is observed in Voskes & Burton (2006, fig. 16), and we know that the gas warp and stellar warp are similar (L02, M06), so the adopted approximate extrapolation for stars is justified.
Compare Fig. 2 with fig. 1 of B06b. In Fig. 2, we see a bump with a maximum peak at (equivalent to kpc), close to the peak at –13.5 obtained in B06b. Note, however, that only the red clump giants are plotted in Fig. 2, while fig. 1 (right panel) of B06b includes all contaminants, especially dwarfs over . Indeed, the decrease in counts beyond –13.5 is due to the end of the warp at 16 kpc, and, of course, the new increase in the counts around –13.8 in fig. 1 of B06b would be due to the dwarf contamination.
2.3 Colour–magnitude diagram and Canis Major depth
Figure 7 of B06b gives a comparison of real and synthetic colour–magnitude diagrams. This plot is not easy to analyse by eye because it includes CMa and foreground stars all together. And it depends on the model of the warp used, so we should not say that since one model of the warp does not fit, no model of a warp will fit. B06b see in their data a similarity with a Gaussian distribution of stars with an r.m.s. of 0.8 kpc. Could the warp produce such a colour–magnitude diagram? The value of 0.8 kpc that B06b take is from Martínez-Delgado et al. (2005a,b), who claim with their result that the warp hypothesis is difficult to reconcile with such a line-of-sight depth in the main sequence of a colour–magnitude diagram.
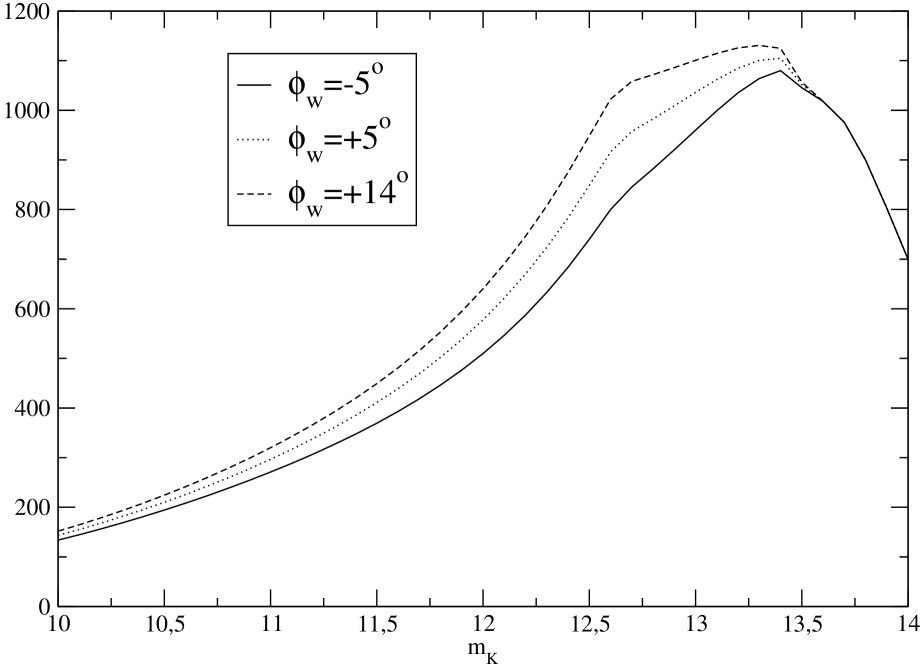
On the one hand, the Martínez-Delgado et al. (2005a) paper contains errors: i) the Gaussian fit of their fig. 3 gives mag; once the contribution of intrinsic broadening (0.19 mag) and latitude dispersion (0.29 mag) are subtracted, it would give mag (equivalent to 1.6 kpc at kpc instead of 0.8 kpc as they calculate); ii) a Gaussian distribution of bins of constant magnitude does not give a Gaussian distribution in the density distribution along the line of sight (the second distribution is proportional to the first multiplied by a factor ), so we cannot translate in magnitudes into in distances, that is, kpc would be the r.m.s. of the function , not the r.m.s. of ; iii) the assumed constant distribution for the underlying Milky Way stars (dotted line in fig. 3 of Martínez-Delgado et al. 2005a) is not even a good first order approximation.
On the other hand, if we forget the analysis by Martínez-Delgado et al. (2005a) but take as correct their data in their fig. 3 (a FWHM magnitudes in the distribution in bins of constant magnitude), we can compare them with our predictions of the warp and see that it is not so different with respect to the predictions of the warp (see Fig. 3): 2.2 mag (2.4 mag if we took into account the intrinsic broadening and the latitude dispersion) instead of 1.6 mag. The prediction of the L02 warp gives a somewhat broader distribution, possibly because the radial dependence is not very accurate.
M06 claim instead that this structure is a spiral arm. Again, I do not agree with the argument by M06 although I agree with their general conclusion that the warp can explain the observed facts. No spiral arm is needed; it is just a question of a wrong calculation of the thickness by Martínez-Delgado et al. (2005a) and a warp with appropriate extrapolation over kpc.
The population attributed by Martínez-Delgado et al. (2005a) to be a 1–2 Gyr old population in the blue plume of intermediate-age open clusters belonging to the CMa dwarf galaxy is indeed a young stellar population ( Myr) of the Galactic spiral arms in the background of open clusters, not placed in the putative CMa galaxy (Carraro et al. 2005). The reply of B06b to Carraro et al. (2005) seems insufficient. Another paper by Bellazzini et al. (2006a) claims that the metallicity of the core of CMa is , a relatively old population; however, this is also within the expectation for the outer disc; for an kpc, is expected for the Galactic disc according to the metallicity distribution by Cameron (1985).
In conclusion, I do not see in the analysis of colour–magnitude diagrams of the Canis Major region any conclusive proof that we are observing a population different from that of our own warped Galaxy.
2.4 Velocity of the CMa stars
The bimodal distribution in the radial velocity of M-stars (Martin et al. 2004), presented as a proof that Canis Major is not the warp, reflects two kinds of origins for the sources: one was artificially produced by template issues resulting from a fluctuating line spread function asymmetry during the different observing nights, as recognized by the authors in a later paper (Martin et al. 2005); and the other peak can be reproduced by the Galactic rotation (M06). In any case, even if M06 were wrong, the kinematics of the warp is somewhat complex and unknown, so we cannot discard it. Another recent claim of measured motion of CMa perpendicular to the disc (Dinescu et al. 2005; Martínez-Delgado et al. 2005b) should not be considered as inconsistent with the expected motion of the warp because indeed we do not know very much about how the warp was formed or its subsequent evolution, whether it is steady or still oscillating with respect to the plane—there is no unique scenario, and there are at least four possible hypotheses of warp formation (Castro-Rodríguez et al. 2002, Sect. 1), each one offering different predictions on its motion—or whether the northern and southern parts should have similar kinematics (given the north–south asymmetry, it is possible that we cannot compare them). Moreover, as M06 state, the stars selected to measure the proper motions might be contamination not associated with CMa, and “the expected warp signature can be and is compatible with negative vertical velocity”.
3 Discussion
The L02 model with the modified fails slightly to reproduce the CMa feature but not by so much (and we must bear in mind that the method of producing the maps also involves certain errors, since the red clump stars used are contaminated by dwarfs, late-type giants and other spectral types in different ratios depending on the line of sight). The bump of red clump stars with –13.5 around , or the depth of the Canis Major structure are also explainable in terms of the warp (with the appropriate extrapolation between 13 and 16 kpc of constant height, as observed). The blue plume in the colour–magnitude diagram is explicable in term of the spiral arm population. The velocity distribution of the stars cannot be a proof to exclude it is a warp. The question now arises as to whether it is absolutely necessary to invoke the existence of a new dwarf galaxy to explain the red clump stars.
The two options (warp or dwarf galaxy) are usually chosen depending on the methodology of analysis. Those authors who prefer the dwarf galaxy hypothesis assume a fixed model of the warp and tend to think that any departure of this model is due to the existence of the new galaxy. However, we must always bear in mind that the predicted warp features depend on the parameters of the disc, the warp itself, the stellar population, the kinematics, etc.; and all this knowledge is not so accurate as to allow a perfect agreement with all the data, specially for the warp. Those authors who prefer the opposite hypothesis claim that whatever you observe is the warp, using an ad hoc model of it (as the case in the present paper with a modified ). Perhaps none of the methodologies is appropriate. I am neither in favour nor against the dwarf galaxy hypothesis. It is quite possible that CMa is a dwarf galaxy, but due to the proximity of the warp feature, for which we do not have very accurate information, it is difficult to disentangle both effects.
Acknowledgments
Thanks are given to T. J. Mahoney (IAC-Tenerife) for proof-reading of this paper, and to the referee, Sébastien Picaud, for useful comments that helped improve the quality of the paper.
References
- (1) Bellazzini, M., Correnti, M., Ferraro, F. R., Monaco, L., & Montegriffo, P., 2006a, A&A, 446, L1
- (2) Bellazzini, M., Ibata, R., Martin, N., Lewis, G. F., Conn, B., & Irwin, M. J., 2006b, MNRAS, 366, 865 (B06b)
- (3) Burton, W. B., 1988, in: Galactic and Extragalactic Radio Astronomy, ed. K. I. Kellerman, & G. L. Verschuur (Springer Verlag, Berlin), 295
- (4) Cabrera-Lavers, A., Garzón, F., & Hammersley, P. L., 2005, A&A 433, 173
- (5) Cameron L. M., 1985, A&A 147, 47
- (6) Carraro, G., Vázquez, R., Moitinho, A., & Baume, G., 2005, ApJ 630, L153
- (7) Castro-Rodríguez, N., López-Corredoira, M., Sánchez-Saavedra, M. L., & Battaner, E., 2002, A&A 391, 519
- (8) Dinescu, D. I., Martínez-Delgado, D., Girard, T. M., Peñarrubia, J., Rix, H. W., Butler, D. J., & van Altena, W. F., 2005, ApJ 631, L49
- (9) Drimmel, R, & Spergel, D. N., 2001, ApJ 556, 181
- (10) Freudenreich, H. T., 1998, ApJ 492, 495
- (11) Levine, E. S., Blitz, L., & Heiles, C., 2006, astro-ph/0601697
- (12) López-Corredoira, M., Cabrera-Lavers, A., Garzón, F., & Hammersley, P. L., 2002, A&A 394, 883 (L02)
- (13) Martin, N. F., Ibata, R. A., Bellazzini, M., Conn, B., Irwin, M. J., Lewis, G. F., & McConnachie, A. W., 2004, MNRAS, 355, L33
- (14) Martin, N. F., Ibata, R. A., Conn, B. C., Lewis, G. F., Bellazzini, M., & Irwin, M. J., 2005, MNRAS 362, 906
- (15) Martínez-Delgado, D., Butler, D. J., Rix, H.-W., Franco, Y. I., Peñarrubia, J., Alfaro, E. J., & Dinescu, D. I., 2005a, ApJ 633, 205
- (16) Martínez-Delgado, D., Peñarrubia, J., Dinescu, D. I., Buthler, D. J., & Rix, H. W., 2005b, in: Near Field cosmology with Dwarf Elliptical Galaxies (IAU Symp. 198), H. Jerjen, & B. Binggeli (eds.), Cambridge Univ. Press, Cambridge, p. 97
- (17) Momany, Y., Zaggia, S. R., Bonifacio, P., Piotto, G., De Angeli, F., Bedin, L. R., & Carraro, G., 2004, A&A 421, L29
- (18) Momany, Y., Zaggia, S. R., Gilmore, G., Piotto, G., Carraro, G., Bedin, L. R., & De Angeli, F. 2006, astro-ph/0603385 (M06)
- (19) Robin, A. C., Reylé, S., Derriére, S., & Picaud, S., 2003, A&A 409, 523
- (20) Voskes, T., & Burton, W. B., 2006, astro-ph/0601653
- (21) Yusifov, I., 2004, in: The Magnetized Interstellar Medium, Eds: B. Uyaniker, W. Reich, and R. Wielebinski, Copernicus GmbH, Katlenburg-Lindau., p. 165